Unplanned equipment downtime costs manufacturing operations a median of $125,000 per hour — and 42% of that downtime is caused by aging equipment that a structured preventive maintenance program would have caught weeks earlier. The gap is not technology. It is the absence of a repeatable system: no asset criticality ranking, no PM task library, no scheduling logic that triggers work before failure rather than after. Organizations that close this gap reduce total maintenance costs by 25–40% and achieve full program ROI within 8 to 16 months. Build your PM program in Oxmaint free and have your first schedules running this week — or book a live demo to see how leading manufacturing teams structure their preventive maintenance in Oxmaint.
Preventive Maintenance Program for Manufacturing
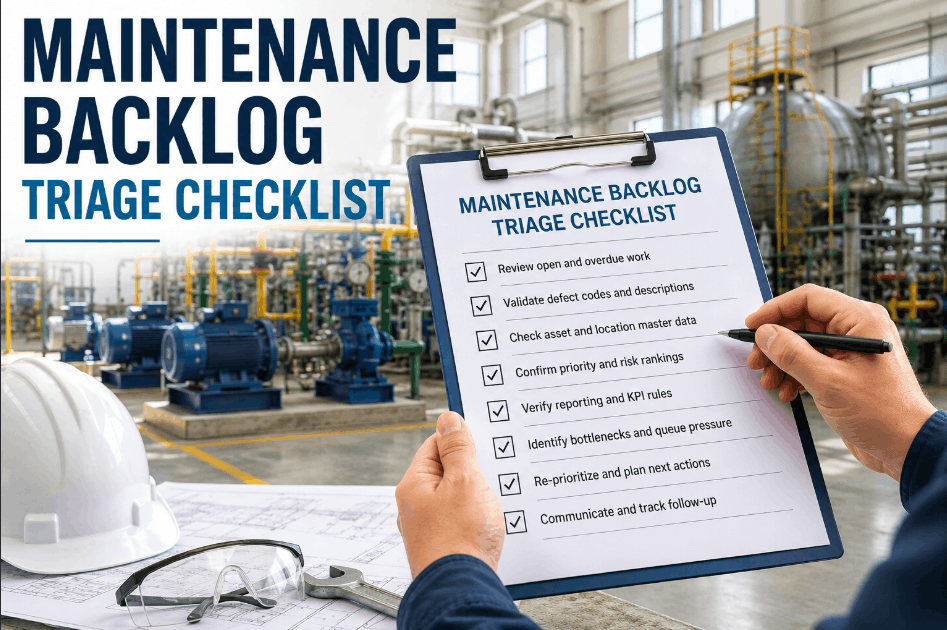
A practical, step-by-step guide to building a PM program that actually runs — asset criticality, task libraries, scheduling logic, compliance tracking, and measurable ROI from day one.
Why Most Manufacturing PM Programs Fail Before They Start
The number is striking: 88% of manufacturing facilities say they have a preventive maintenance program. But when you look at what that actually means on the floor — 59% of those same facilities spend less than half their maintenance time on planned work. The rest is firefighting. The reason is almost always structural. PM programs fail not because maintenance teams lack effort, but because the program was never built on a foundation that makes execution reliable. No asset list. No criticality ranking. No task standards. No scheduling trigger logic. Without these four elements, every PM program eventually collapses into reactive maintenance wearing a preventive maintenance label.
- Paper checklists signed off without completion
- Schedules based on guesswork, not asset criticality
- No tracking of what was done vs. what was due
- Reactive work logged retroactively as PM
- No PM history to support replacement decisions
- Every asset ranked by criticality — critical, important, standard
- Task library with time, parts, and skill requirements per asset
- Schedules triggered by time, meter count, or condition
- Mobile completion with mandatory point-by-point confirmation
- Compliance rate tracked. Trends visible. Intervals adjusted by data.
Build Your Asset Register and Rank Every Asset by Criticality
You cannot schedule PM for assets you have not listed, and you cannot prioritize correctly without a criticality rank. The asset register is the foundation of the entire program — every schedule, every task, every spare part requirement traces back to it. Criticality ranking determines how much PM investment each asset receives. Critical assets — typically 10 to 15% of your total asset count — should receive 50% of your PM budget. Standard assets can run on basic time-based schedules. Non-critical assets may run to failure acceptably. Without this tiering, PM budgets get spread evenly across all assets, which means critical equipment gets under-maintained and low-priority equipment gets over-maintained.
| Criticality Tier | % of Asset Count | PM Strategy | Budget Share | Trigger Type |
|---|---|---|---|---|
| Critical | 10–15% | Preventive + condition monitoring | 50% of PM budget | Time + condition + meter |
| Important | 25–30% | Preventive — standard frequency | 30% of PM budget | Time-based or meter |
| Standard | 40–50% | Basic preventive — longer intervals | 15% of PM budget | Calendar-based |
| Non-Critical | 10–15% | Run-to-failure acceptable | 5% of PM budget | Reactive or annual check |
Scroll horizontally to view full table on smaller screens
Build a Standardized Task Library for Every Asset Class
The PM task library is what separates a program from a checklist. A task library defines, for every asset class and criticality tier, exactly what work must be performed, how long it takes, what parts and tools are required, and what skill level is needed. Without a task library, PM quality depends entirely on which technician shows up — experienced technicians do thorough work, newer technicians miss steps. With a standardized task library in your CMMS, every PM execution follows the same standard regardless of who performs it.
Set Scheduling Triggers — Time, Meter, and Condition
The most common failure point in PM scheduling is using only calendar-based triggers. A pump that runs 24 hours per day and a pump that runs 4 hours per day should not be on the same monthly schedule — but they will be if the only trigger is a date. World-class PM programs use three trigger types simultaneously per asset and generate the work order whichever fires first. Industry leaders achieve an 85 to 90% planned maintenance ratio with this approach — compared to the 40 to 60% reactive maintenance ratio typical of calendar-only programs.
PM fires on a fixed date regardless of usage. Best for: lubrication, filter changes, fluid sampling, inspections tied to regulatory compliance. Simplest to configure. Risk of over- or under-maintenance on variable-usage assets.
PM fires when a counter — hours run, cycles completed, units produced — reaches a threshold. Best for: high-variability-usage assets, production-linked equipment. More accurate than calendar for assets with inconsistent runtime.
PM fires when a sensor reading — temperature, vibration, pressure — crosses a defined limit. Best for: critical assets with sensor coverage. Enables true predictive maintenance. Requires SCADA or IoT integration to function automatically.
Ready to Move From Reactive to Planned? Build Your PM Program in Oxmaint.
Oxmaint gives you asset criticality ranking, multi-trigger PM scheduling, mobile task execution, and compliance tracking — all in one platform. No spreadsheets. No paper. No missed PMs.
Execute and Track: Mobile Completion, Compliance Rate, and Work Order History
Scheduling a PM is not the same as completing it. The most common failure in execution is the paper sign-off: a technician marks a checklist complete without performing every step because no system verifies individual task completion. A CMMS with mobile execution changes this — each PM task becomes a mandatory checkpoint that cannot be bypassed. Pass/fail status, photograph capture, and parts-used recording all happen at the point of work, creating an audit trail that is available immediately to supervisors and maintenance managers.
Mobile Work Order Delivery
PM work orders arrive on the technician's mobile device with the full task list, asset history, required parts, and estimated time. No paper. No desk visit. Technicians see exactly what is due and in what order.
Point-by-Point Task Confirmation
Each task in the PM checklist must be individually confirmed before the work order can be closed. If a task fails, a corrective work order is auto-generated. No step can be skipped silently.
Compliance Rate Dashboard
PM compliance rate — PMs completed on time divided by PMs scheduled — is the primary KPI for program health. World-class programs maintain 95%+ compliance. Any drop below 85% signals a scheduling or resource problem that needs investigation.
Asset History and Trend Tracking
Every PM execution adds to the asset's maintenance history record — what was done, what was found, what parts were used, how long it took. Over 6 to 12 months, this history enables interval optimization: extending overdue PM on healthy assets, shortening intervals on deteriorating ones.
Optimize: Use History Data to Adjust Intervals and Extend Equipment Life
A PM program that never changes its intervals is not optimizing — it is just maintaining the schedule someone guessed at during implementation. The final step is using the maintenance history your CMMS accumulates over 6 to 12 months to make data-driven interval decisions. Assets that consistently show no findings at PM execution can have intervals extended — reducing labor cost without increasing failure risk. Assets showing early-stage deterioration at every PM should have intervals shortened or trigger thresholds tightened. This continuous optimization loop is what separates an 8–12 month ROI from a 3–5 year ROI on the same PM program investment.
PM history shows zero or near-zero findings at every execution over 6+ months. Asset failure history shows no trend toward increasing frequency. Condition monitoring data shows stable readings well within limits. Extending intervals on these assets frees up technician time for higher-priority work.
PM findings show deterioration at the beginning of each interval — suggesting the trigger is firing too late. Motor current, vibration, or temperature trends are rising between PMs. Failure history shows an increasing frequency pattern that the current schedule is not containing.
How Oxmaint Structures and Automates Your PM Program
Oxmaint is built around the five-step PM program structure in this guide. Asset criticality ranking, task library management, multi-trigger scheduling, mobile execution, compliance dashboards, and interval optimization tools are all native to the platform — not add-ons requiring additional configuration. Here is how each capability maps to the PM program steps covered above.
Asset Register with Criticality Ranking
Build your complete asset register in Oxmaint with criticality tier, location, OEM specs, and associated spare parts. Criticality ranking drives automatic PM frequency assignment. Every asset has a full lifecycle record from first PM to replacement decision.
Standardized PM Task Library
Build reusable task templates per asset class — with time estimates, required parts, skill level, and mandatory confirmation steps. Apply the same task standard across every asset of the same class. No task variation between technicians.
Multi-Trigger PM Scheduling
Configure time, meter, and condition triggers per asset simultaneously. PM fires on whichever trigger is reached first. Meter values feed from MES or manual entry. Condition triggers connect via SCADA or IoT integration.
Mobile Execution and Compliance Tracking
Technicians receive PM work orders on mobile with full task lists and asset history. Point-by-point confirmation required. Compliance rate and overdue PM count visible in real time on the supervisor dashboard. Missed PMs generate immediate alerts.
Interval Optimization from History Data
Oxmaint surfaces PM finding trends per asset over time — enabling data-driven decisions on interval extension or compression. Asset MTBF trends visible alongside PM compliance history. Replace calendar guesswork with evidence from your own maintenance records.
Spare Parts and Procurement Integration
Every PM task links to its required parts. Parts consumption from PM execution updates inventory in real time. Reorder thresholds trigger purchase requisitions automatically — so parts are always available before the PM window, not ordered after a delay.
Frequently Asked Questions About PM Programs in Manufacturing
How long does it take to see ROI from a new preventive maintenance program?
Most manufacturing facilities reach positive ROI within 8 to 16 months of implementing a structured PM program. The fastest returns come from critical equipment where failure costs are highest — emergency repair premiums, lost production, and expedited parts orders disappear first. Programs focused on the right assets from day one, with compliance rates above 90%, consistently report 300 to 500% annual returns once fully mature. Start your PM program in Oxmaint free and track ROI from your first completed PM cycle.
What is the right ratio of preventive to reactive maintenance for a manufacturing plant?
World-class manufacturing operations achieve an 85% planned to 15% reactive maintenance ratio. The industry average is roughly 60% planned and 40% reactive. If your plant is currently running at 40% planned or below, increasing PM coverage on critical assets — even without changing reactive practices on non-critical equipment — typically delivers a 12 to 18% reduction in total maintenance costs within the first year. Book a demo to see how Oxmaint measures and tracks your planned vs. reactive ratio in real time.
How do we determine the right PM frequency for each piece of equipment?
Start with manufacturer OEM recommendations as the baseline interval. Adjust based on actual operating conditions — equipment running 24 hours per day needs shorter intervals than equipment running 6 hours per day. Apply criticality ranking to weight frequency investment correctly. After 6 to 12 months of PM history in your CMMS, use finding trends to optimize: extend intervals on assets with consistent zero-findings, shorten intervals where deterioration is detected early. Start free in Oxmaint and begin building the history data that makes interval optimization possible.
Can a small maintenance team with limited resources build an effective PM program?
Yes — and the key is starting with asset criticality rather than trying to PM everything at once. A team of four technicians covering 200 assets cannot maintain weekly PMs on all of them. But they can maintain weekly PMs on the 20 to 30 assets that would cause the most production impact if they failed. Building a focused PM program on your critical 15% of assets delivers the most meaningful reliability improvement per hour of technician time. Book a scoping call to discuss how to phase your PM program based on your team size and asset count.
Build a PM Program That Actually Runs — Not Just a Schedule That Looks Good on Paper.
Oxmaint gives manufacturing maintenance teams the asset register, task library, multi-trigger scheduling, mobile execution, and compliance tracking they need to move from reactive to planned. Start free. First PM schedules live in days.