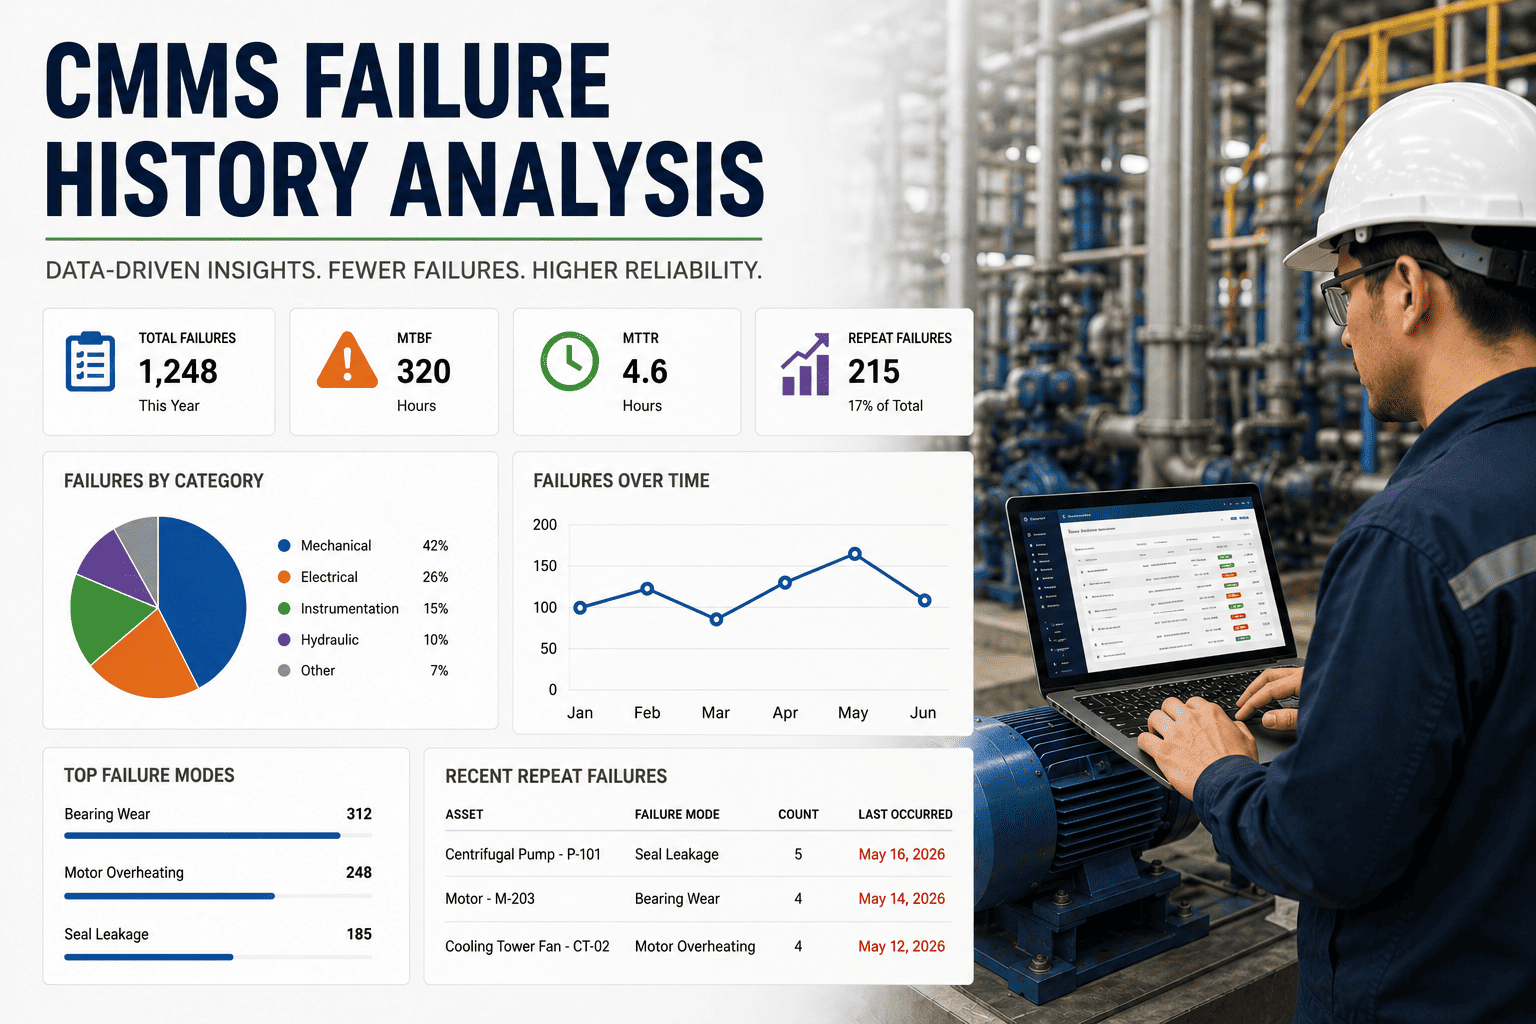
Maintenance trend analysis in manufacturing is the practice of tracking reliability metrics—like failure frequency, MTBF, and cost-per-asset—over time to spot slow degradation and seasonal patterns before they cause unplanned downtime. For plant managers and reliability engineers, leveraging a CMMS to analyze these data trends transforms reactive fire-fighting into predictive, cost-saving maintenance strategies. This 2026 guide breaks down how to use CMMS trend dashboards and maintenance analytics to optimize asset health. Ready to modernize your plant maintenance trending? You can Start Free Trial today.
2026 GUIDE · MAINTENANCE ANALYTICS
Are hidden reliability trends draining your plant's profitability?
Slow degradation, seasonal failure spikes, and PM compliance drift cost manufacturers billions annually. With CMMS-powered trend analysis, you can surface these maintenance data trends months before they cause unplanned downtime.
THE BUSINESS CASE
Why manufacturing maintenance trends dictate your bottom line
A 200-asset manufacturing plant typically loses over $420,000 annually to unplanned downtime. Ignoring plant trend analysis means accepting these losses as routine, when in reality, 70% of equipment failures exhibit detectable warning signs weeks in advance.
Cost Trend Analysis Formula
Total Maintenance Cost ÷ Asset Replacement Value × 100
World-class maintenance organizations maintain a ratio below 2.0%. Without consistent CMMS trend dashboard monitoring, most manufacturing plants operate blindly between 3.5% and 5.0%.
Rolling MTBF Formula
Total Operating Hours ÷ Number of Failures
Tracking MTBF as a 90-day rolling average reveals reliability drift. A downward slope of 15% or more over six months indicates escalating asset health trending issues requiring intervention.
$50K+
Annual labor savings from optimized PM frequencies based on failure rate trends
20%
Average inventory cost reduction via trend-informed spare parts forecasting
6 Mo
Typical payback period for a CMMS analytics deployment in mid-sized plants
STEP-BY-STEP METHODOLOGY
How to perform plant trend analysis with a CMMS
Effective maintenance analysis in manufacturing requires a structured approach to data collection, baseline establishment, and continuous monitoring. Here is the 5-month implementation timeline reliability teams use to operationalize CMMS maintenance trends.
Data normalization & asset hierarchy
Standardize work order codes, failure modes, and asset naming conventions. Clean historical maintenance data logs to ensure your CMMS trend dashboard reflects reality, not data entry inconsistencies.
Establish baseline metrics
Calculate baseline MTBF, MTTR, PM compliance, and cost-per-asset. These baseline figures are critical for identifying reliability drift and measuring the ROI of future maintenance strategy adjustments.
Deploy trend dashboards
Configure automated CMMS analytics trends to visualize failure frequency, aging asset health, and cost overruns. Eliminate manual spreadsheet reporting to surface real-time data trends instantly.
Identify predictive patterns
Analyze seasonal failure spikes and PM compliance drift. Shift from time-based preventive maintenance to condition-based predictive maintenance guided by rolling failure rate trends.
Optimize & refine strategies
Use accumulated manufacturing data trending to adjust PM intervals, reallocate maintenance budgets, and phase out chronically failing assets. Continuous improvement locks in long-term cost savings.
METRICS THAT MATTER
Key CMMS analytics trends every plant must track
Not all data is useful. High-performing maintenance and reliability teams focus on specific manufacturing maintenance trends that directly correlate with OEE and operational costs. Track these core metrics in your maintenance trend guide.
| Trend Metric | What It Reveals | Target Benchmark |
|---|---|---|
| Rolling MTBF | Long-term reliability degradation and asset aging patterns | Increasing trend over 90 days |
| Failure Rate Trends | Seasonal spikes and recurring equipment weaknesses | Stable or declining month-over-month |
| PM Compliance Drift | Schedule adherence gaps leading to reactive maintenance | Greater than 90% compliance |
| Cost-Per-Asset Curves | Financial inefficiency and end-of-life asset identification | Flat or decreasing annually |
| Mean Time To Repair (MTTR) | Technician efficiency and spare parts availability issues | Decreasing trend year-over-year |
Stop guessing. Start trending.
See how OxMaint transforms your raw work order history into predictive maintenance trend dashboards that prevent failures before they happen.
PLATFORM CAPABILITIES
How OxMaint simplifies maintenance trend analysis
OxMaint is an AI-powered CMMS and EAM platform built to surface actionable maintenance data trends without requiring deep manual report drilldowns. From automated failure rate tracking to predictive analytics, here is how OxMaint solves your plant trend analysis challenges.
Automated CMMS Trend Dashboards
Pre-built dashboards visualize rolling MTBF, PM compliance drift, and cost-per-asset curves in real-time. No more exporting to spreadsheets—your maintenance analysis guide comes alive visually.
AI-Driven Failure Prediction
Machine learning algorithms analyze historical work orders to predict equipment failures weeks in advance, shifting your team from reactive fixes to precision planned maintenance.
Asset Health Trending
Track degradation curves for every critical asset. OxMaint automatically flags reliability drift, enabling you to intervene before an aging machine impacts your OEE or causes costly downtime.
Cost & Inventory Analytics
Link spare parts usage to specific asset failures to optimize inventory levels. Visualize cost trend analysis to identify assets that are cheaper to replace than to maintain continuously.
REAL-WORLD IMPACT
A worked example: Trend analysis saves a 180-asset plant $42K
THE CHALLENGE
A mid-sized food processing facility operated 180 critical assets. Maintenance was entirely reactive. Pump seals failed every 60 days, and the team carried $85,000 in emergency spare parts inventory. They had no visibility into failure frequency trends or PM compliance.
THE OXMAINT SOLUTION
By deploying OxMaint, the team standardized failure codes and established a CMMS trend dashboard. Within 3 months, data trending revealed that humidity spikes were accelerating seal degradation, and PM compliance had drifted to 62% on critical lines.
THE MEASURABLE OUTCOME
Using CMMS analytics trends, they adjusted PM schedules ahead of humidity cycles, raised compliance to 94%, and cut emergency parts inventory by 25%. The plant saved $42,000 in the first year and reduced unplanned downtime by 31%.
FREQUENTLY ASKED QUESTIONS
Common questions about CMMS maintenance trends
What is maintenance trend analysis in manufacturing?
Maintenance trend analysis is the process of tracking equipment reliability metrics—such as MTBF, failure rates, and maintenance costs—over time to identify patterns, seasonal shifts, and degradation. In manufacturing, this analysis helps teams predict failures, optimize preventive maintenance schedules, and reduce costly unplanned downtime.
How does a CMMS improve plant trend analysis?
A CMMS automates the collection of work order data, asset histories, and downtime logs, feeding them into real-time trend dashboards. This eliminates manual spreadsheet reporting and ensures maintenance data trends are accurate and instantly accessible for better decision-making.
What metrics should be included in a CMMS trend dashboard?
A robust CMMS trend dashboard should track rolling MTBF, failure rate trends, PM compliance drift, cost-per-asset curves, and MTTR. These metrics provide a comprehensive view of asset health, technician efficiency, and overall maintenance program ROI. To see a live example, Book a Demo with our team.
How long does it take to see ROI from maintenance analytics?
Most manufacturing plants see a measurable return on investment within 6 months of implementing a CMMS for trend analysis. Immediate savings come from reduced emergency parts inventory and optimized PM schedules, while long-term savings stem from preventing catastrophic equipment failures.
Can OxMaint integrate with our existing manufacturing data?
Yes. OxMaint is designed to ingest historical work order data, asset registers, and IoT sensor inputs. You can start your implementation easily when you Start Free Trial, allowing the AI to immediately begin establishing baselines and identifying reliability trends.
Ready to see your maintenance trends clearly?
Join the manufacturing plants using OxMaint to predict failures, cut maintenance costs, and eliminate reactive fire-fighting. Book a personalized demo to see our CMMS trend dashboards on your own assets.
Free 14-day trial · No credit card required