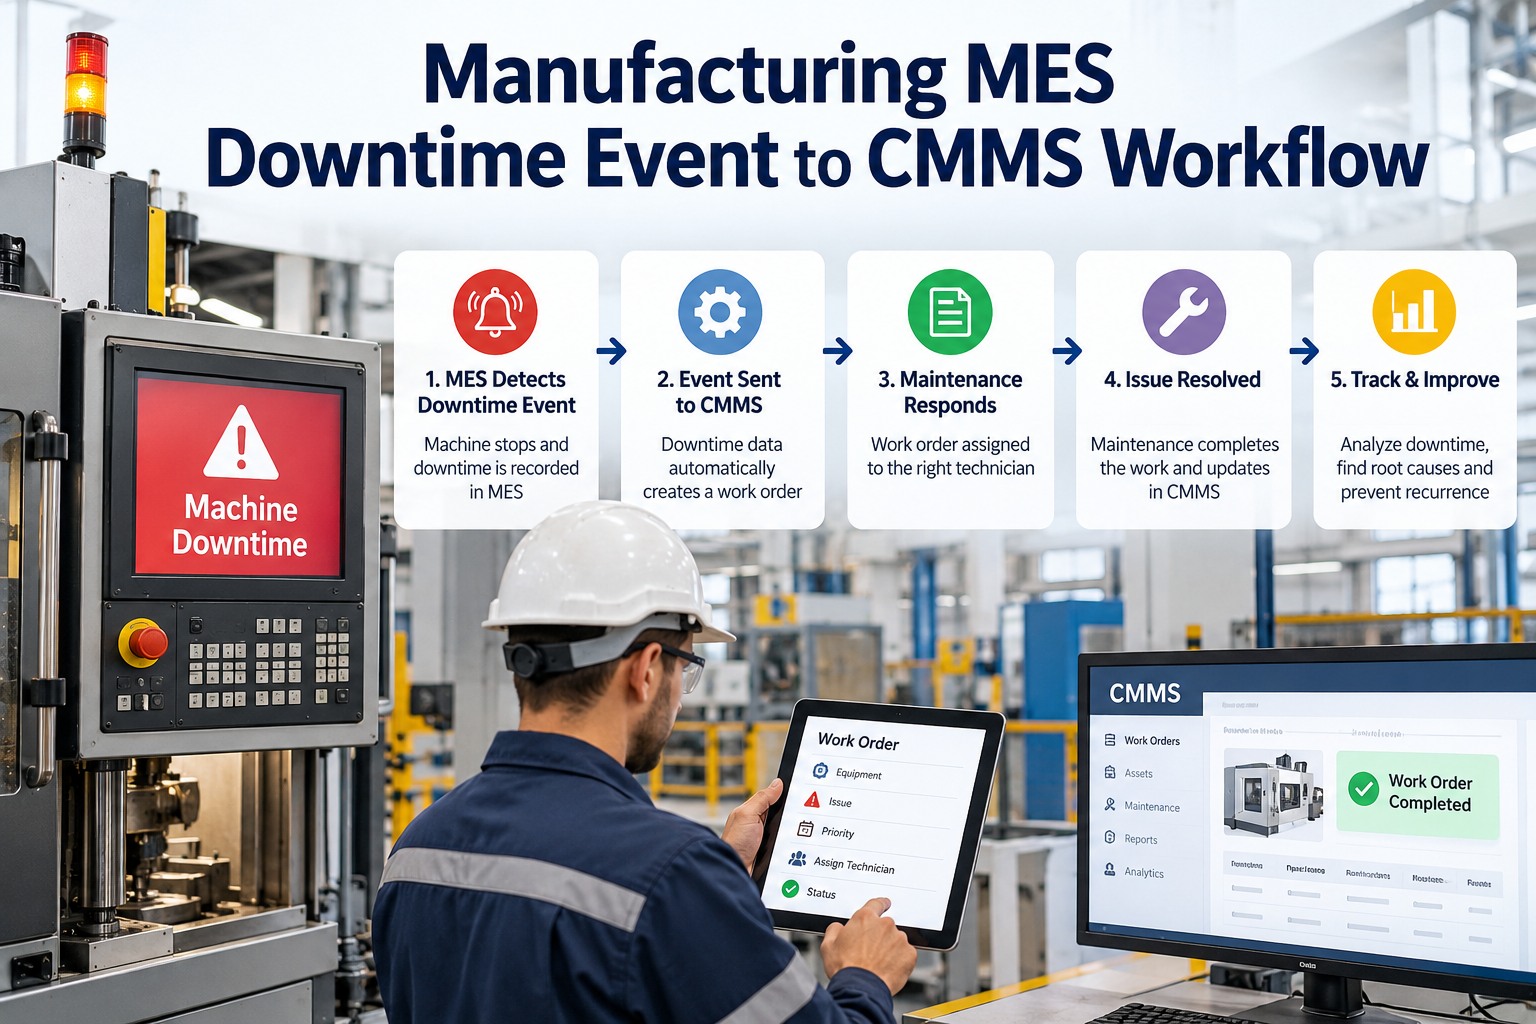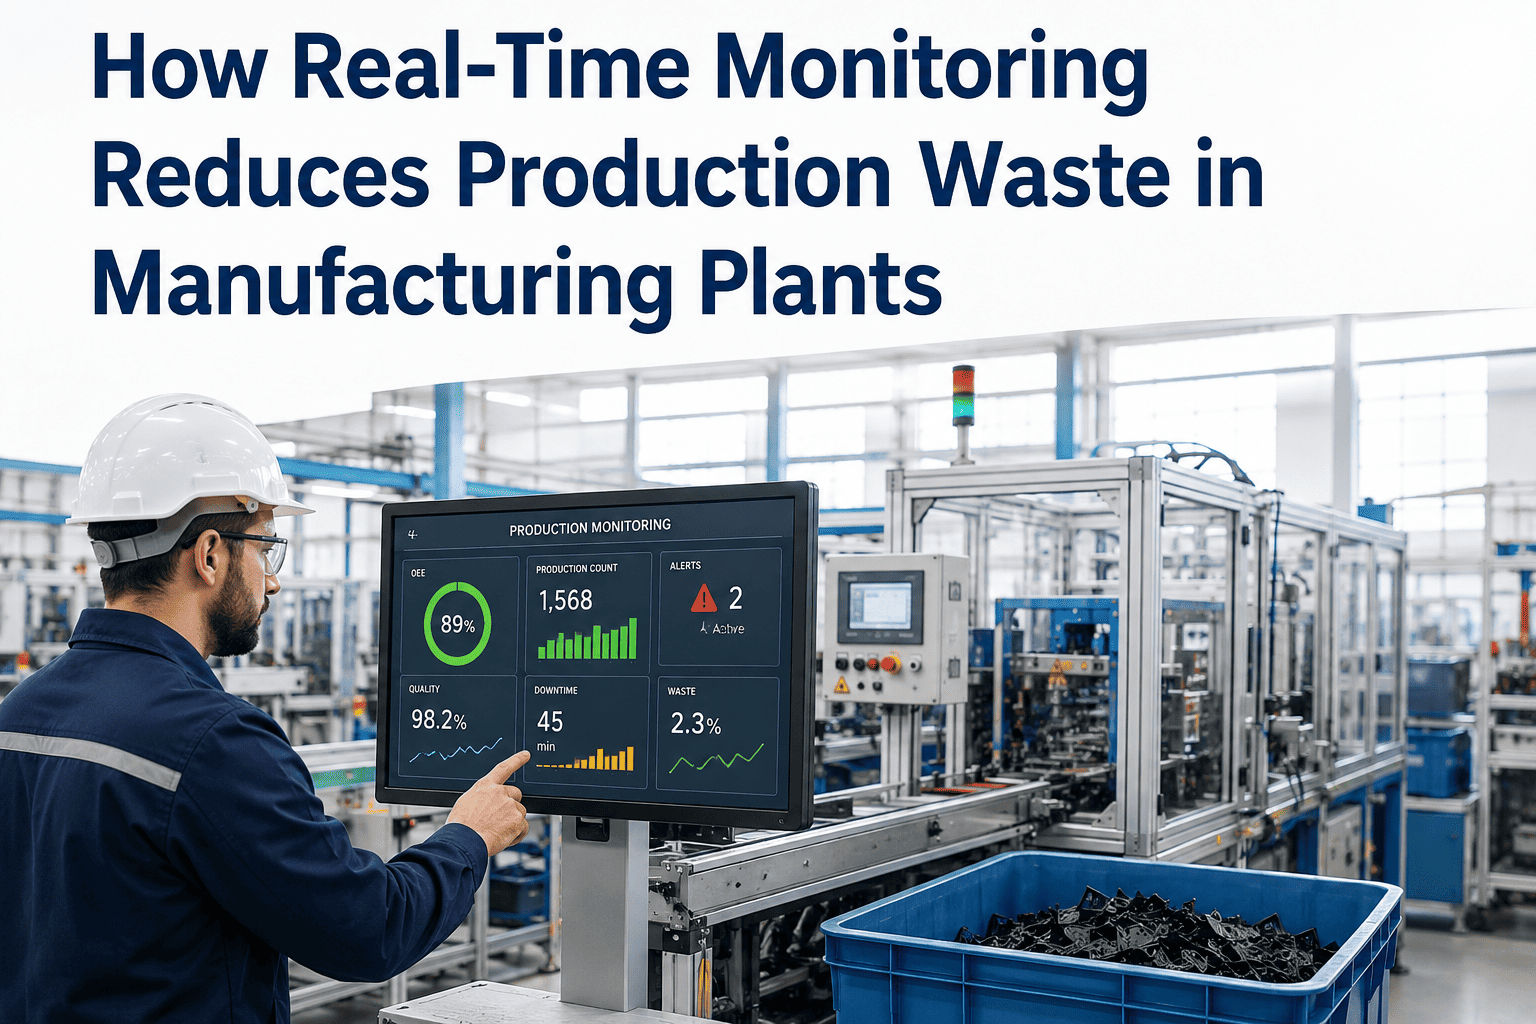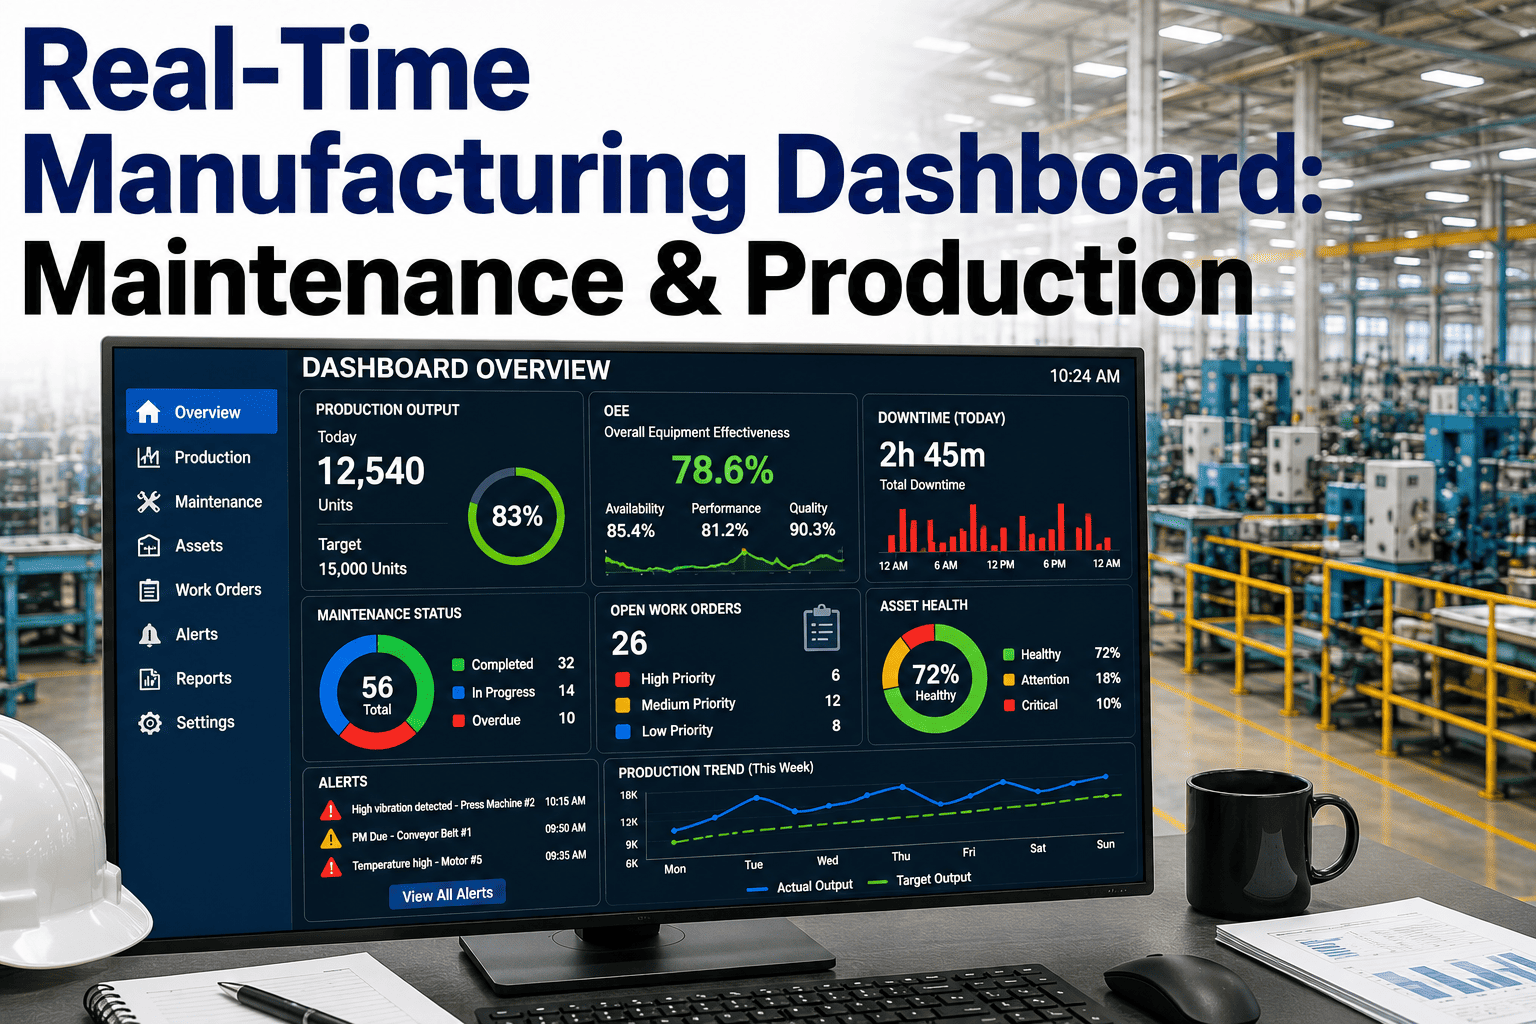
A real-time manufacturing dashboard collapses the gap between production output and equipment health by streaming CMMS work-order data, MES throughput signals, and IIoT sensor feeds into one live view that both teams trust. Instead of arguing over whose spreadsheet is right, maintenance and operations leaders read the same OEE trends, downtime triggers, and PM compliance numbers the moment they change — cutting unplanned stoppages, improving audit readiness, and turning reactive firefighting into predictable asset performance. Plants that unify these data sources typically see 20–40% less unplanned downtime within the first year. The fastest way to build this single source of truth is to connect your existing systems to OxMaint — you can Start Free Trial in minutes and stream live KPIs to any wall display or mobile device.
REAL-TIME VISIBILITY · MAINTENANCE × PRODUCTION
One live dashboard that ends the "which report is right?" argument for good.
When your CMMS, MES, and IIoT feeds all push to the same real-time manufacturing dashboard, maintenance and production stop debating whose numbers are correct and start acting on them. OxMaint unifies work orders, asset health, and OEE trends into a single pane your whole plant can trust.
SINGLE SOURCE OF TRUTH
Why a real-time manufacturing operations dashboard matters in 2026
In most plants the maintenance team tracks wrench-time and PM compliance in a CMMS, while production tracks throughput, scrap, and OEE in an MES — and nobody looks at both at the same time. The result is a 4–8 hour lag between a machine trending toward failure and the shift lead seeing the impact on the production board. A plant real-time dashboard eliminates that lag by streaming work-order status, sensor alarms, and line performance into one continuously updating view, so a bearing temperature spike and the OEE drop it causes appear on the same screen within seconds, not next Monday's report.
DASHBOARD ARCHITECTURE
What a maintenance production dashboard must show — the 5 non-negotiable KPI layers
A manufacturing KPI dashboard built for real-time decisions is not a wall of 40 gauges. The best plants we work with organise the screen into five drill-down layers, each answering one question before the eye moves to the next.
DATA INTEGRATION
How to integrate MES, CMMS, and IIoT feeds into one real-time CMMS dashboard
The hardest part of building a manufacturing real-time dashboard is not the front-end — it is piping three heterogeneous data sources into one stream without creating a custom integration project that takes six months. OxMaint ships with native connectors for the most common MES, ERP, and IIoT protocols, so a typical 150-asset plant goes live in 2–4 weeks, not 2–4 quarters.
Open WOs, PM schedules, asset hierarchy, labor hours, and completion timestamps flow from OxMaint into the dashboard in real time. This is the maintenance production KPI backbone — without it, you are watching machines but not managing work.
Good-unit counts, scrap rates, changeover events, and production schedules stream from the MES or ERP (SAP, Oracle, Epicor, Plex) via REST API or OPC-UA. This is what turns a maintenance dashboard into a true maintenance production dashboard.
Vibration, temperature, pressure, and amperage signals from sensors on critical assets feed OxMaint's predictive models. When a reading crosses an AI-defined threshold, the dashboard posts a predictive alert and auto-generates a work order — before the failure happens.
DESIGN PATTERNS
Mobile vs wall display: how to design the plant operations dashboard for both
A real-time manufacturing dashboard that only lives on a 55-inch TV on the plant floor helps the shift supervisor but not the technician on the line. The most effective plants deploy the same data in two layouts: a high-density wall display for the operations room and a card-based mobile view for technicians in the field.
| Design dimension | Wall display (55" +) | Mobile view (technician) |
|---|---|---|
| Primary audience | Shift supervisors, plant managers | Mechanics, electricians, reliability techs |
| Refresh rate | Every 5–10 seconds | On load + push notifications |
| Information density | High — 8–12 KPIs, heat maps, trend lines | Low — 3 cards: my WOs, asset alerts, parts |
| Interaction | View-only or touch drill-down | Tap to accept WO, log downtime, photo defect |
| Alert style | Full-screen red flash + audible alarm | Push notification with deep link to WO |
| Color contrast | Dark navy background for reduced glare | Light background for outdoor readability |
A Tier-2 supplier running 180 critical assets across three lines was spending $42K/year on unplanned downtime and losing 6 hours per week reconciling maintenance logs with production reports. After deploying an OxMaint real-time CMMS dashboard that merged their CMMS work orders with MES throughput and 40 vibration sensors:
PRODUCT FIT
How OxMaint helps: from fragmented spreadsheets to a real-time maintenance operations dashboard
OxMaint is an AI-powered CMMS and EAM platform purpose-built to be the single source of truth your dashboard runs on. Instead of exporting CSVs from three systems and pasting them into a slide deck, OxMaint ingests the data, applies predictive models, and publishes live KPIs to any screen — so maintenance and production always see the same numbers.
Every WO created, accepted, or closed updates the dashboard in real time. Technicians log labor and parts from mobile, and the production board reflects the change instantly — no end-of-day data entry.
OxMaint's AI engine analyses vibration, temperature, and amperage trends from IIoT sensors and flags developing failures 7–21 days before they trigger a breakdown — posting the alert straight to the dashboard with a recommended action.
OxMaint calculates OEE from MES throughput data and overlays it with PM compliance, MTBF, and backlog age — so a drop in availability is immediately traceable to a specific asset, work order, or missing spare part.
Tap any KPI on the dashboard to drill from plant → line → asset → component → work order history. OxMaint stores the full asset tree and maintenance log, so every number on the screen is three taps from its root cause.
See OxMaint live on your assets — book a 30-minute demo.
We'll connect your CMMS, MES, and sensor data sources and show you exactly what your real-time manufacturing dashboard will look like on day one.
FREQUENTLY ASKED
Real-time manufacturing dashboard — 5 questions maintenance leaders ask
Stop reconciling reports. Start watching your plant in real time.
Deploy OxMaint's real-time manufacturing dashboard and give maintenance and production one screen they both trust — live OEE, downtime alerts, predictive AI, and work-order status in a single view.
Free 14-day trial · No credit card