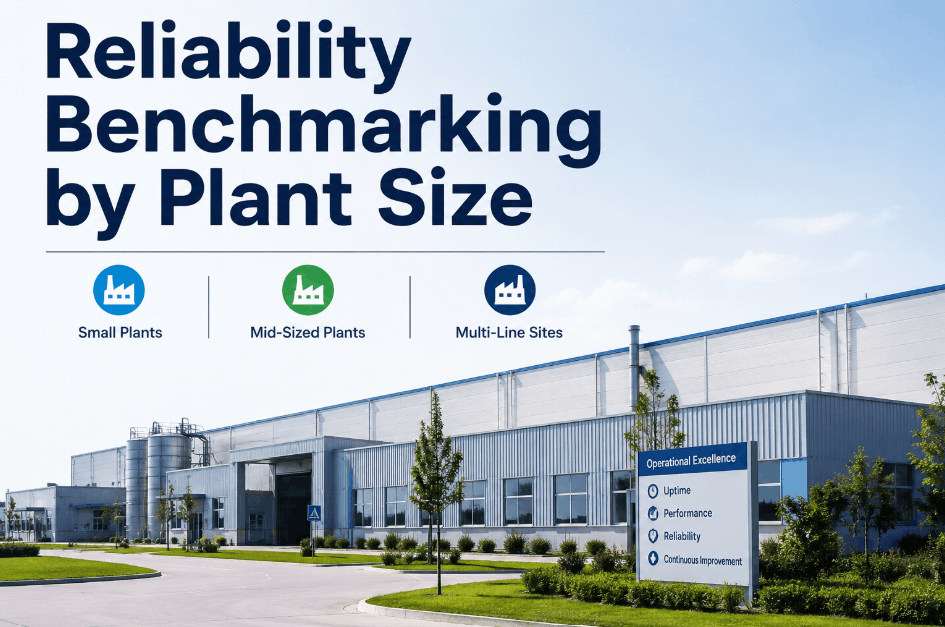
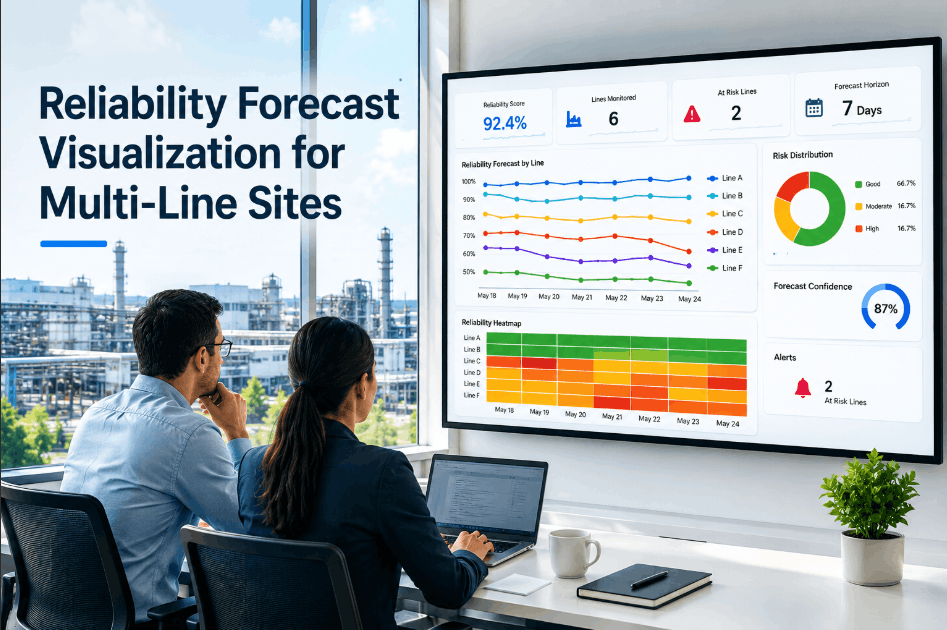
Comparing a 15-line multi-site operation against a single-line shop on the same reliability scale produces meaningless numbers — uptime percentage alone doesn't account for asset count, crew size, or shift complexity. Reliability benchmarking by plant size groups sites into comparable bands so a small plant is measured against small plants, not against a facility ten times its scale. Without that segmentation, maintenance managers either chase unrealistic targets or under-report real performance gaps. Sign Up Free to pull live reliability metrics from OxMaint and benchmark your plant against sites of comparable size, not an arbitrary industry average.
Reliability · Blog · Plant Operations
Reliability Benchmarking by Plant Size
Uptime comparison, MTBF tracking, and size-segmented scoring — practical reliability benchmarking for small, mid-sized, and multi-line plants using a single CMMS dataset.
3 bandsPlant-size segments needed for a fair reliability comparison: small, mid-sized, multi-line
41%Of plants misjudge their own reliability standing when benchmarked against the wrong size class
+19%Average uptime gain when reliability targets are set against size-matched peers
2.7×Faster gap identification with live CMMS data versus annual manual benchmarking
Reliability Benchmark Components — What Every Plant Score Needs
A meaningful reliability benchmark is built from the same core inputs regardless of plant size, normalized for scale before comparison. Book a Demo to see how OxMaint normalizes uptime, MTBF, and PM compliance data across plant sizes for an apples-to-apples comparison.
Step 1
Asset Count Baseline
Total tracked assets and critical asset count recorded per plant, establishing the scale denominator for every metric.
Foundation
Step 2
Uptime Tracking
Planned versus unplanned downtime logged per asset and rolled up to plant-level uptime percentage.
Core Metric
Step 3
MTBF Calculation
Mean time between failures calculated per asset class, surfacing where reliability gaps concentrate.
Diagnostic
Step 4
PM Compliance Rate
Percentage of scheduled preventive maintenance completed on time, a leading indicator of future reliability.
Critical Gate
Step 5
Size-Band Normalization
Metrics segmented into small, mid-sized, and multi-line bands so comparisons reflect actual operational scale.
Comparison
Step 6
Gap Reporting
Plant score compared against size-matched peers, with the largest gaps surfaced for the reliability manager.
Closure
The Benchmarking Blind Spot Cascade — How Unmatched Comparisons Hide Real Gaps
Comparing reliability across mismatched plant sizes does not just produce noise — it actively hides where the real gap is. Sign Up Free to replace mismatched industry averages with size-matched benchmarks pulled directly from your CMMS data.
Reliability Benchmarking Blind Spot — 5 Stages from Mismatched Comparison to Missed Investment
Stage 1
Industry Average Used as Target
Plant compares its uptime to a generic industry average that blends sites of vastly different scale.
$0
Cost if size-matched from the start
↓
Stage 2
False Sense of Performance
A small plant beats the blended average and assumes reliability is strong, masking gaps that only show against true peers.
$1,100
Missed improvement opportunity, quarterly
↓
Stage 3
Investment Misdirected
Reliability budget allocated based on misleading comparisons, missing the asset classes actually driving downtime.
$5,400
Misallocated maintenance budget
↓
Stage 4
Gap Widens Against True Peers
Size-matched competitors continue improving while the plant's actual standing slips unnoticed.
$14,000
Lost throughput versus peer plants
↓
Stage 5
Reliability Crisis at Scale
Accumulated downtime and missed investment surface as a major reliability event, forcing emergency capital review.
$32,000+
Emergency capital review + downtime
Plant Reliability Maturity Score — How Does Your Plant Compare to True Peers?
Score your plant's benchmarking practice against the framework below.
Reliability Benchmarking Maturity Score
Score 5 = full size-matched benchmarking · Score 1 = no benchmarking practice · Assess per site or per plant group
5
Fully Controlled — Size-Matched Live Benchmarking
Plant compared continuously against size-matched peers using live uptime, MTBF, and PM compliance data.
Action: Maintain benchmarking cadence. Review peer band assignment annually as scale changes.
4
Mostly Controlled — Quarterly Manual Comparison
Benchmarking happens but relies on quarterly manual data pulls rather than live tracking.
Action: Automate metric capture in the CMMS to enable continuous benchmarking.
3
Partially Managed — Single Generic Target
Plant tracks uptime against one generic industry target without segmenting by plant size.
Action: Identify size-matched peer plants and rebuild the comparison baseline.
2
Reactive — No Formal Comparison
Reliability tracked internally but never compared externally to any peer group.
Action: Establish baseline metrics this quarter and begin external comparison.
1
No Programme — No Reliability Tracking
No uptime, MTBF, or PM compliance metrics tracked at all. No basis for any comparison.
Action: Implement core reliability tracking in the CMMS immediately.
Technology Integration: CMMS Reliability Data and Size-Segmented Reporting
Reliability benchmarking depends on consistent, live data — not a once-a-year manual spreadsheet pull. Sign Up Free to capture uptime, MTBF, and PM compliance automatically and compare your plant against size-matched peers in one dashboard.
Live Uptime Tracking
100%
Planned vs unplanned downtime captured per asset
Every downtime event logged against the asset, rolling up automatically into plant-level uptime reporting.
Size-Band Segmentation
3 bands
Small, mid-sized, and multi-line peer comparison
Metrics normalized by asset count and shift structure so comparisons reflect true operational scale.
MTBF & PM Compliance
+19%
Uptime gain when targets are set against true peers
Mean time between failures and PM completion rate tracked per asset class, surfacing the gaps that matter most.
Multi-Site Dashboard
2.7×
Faster gap identification across sites
Reliability data from every plant in the portfolio visible in one dashboard, filterable by size band.
"
We were comparing our 40-asset facility against a corporate average built mostly from our largest multi-line sites and consistently looked fine on paper. Once we segmented benchmarking by plant size in OxMaint, we saw our actual MTBF was well behind comparable small plants, and we finally knew where to focus.
Reliability Manager — Multi-site manufacturing group
Root Causes of Misleading Reliability Benchmarks
Misleading reliability comparisons across plants cluster into six recurring root causes.
Reliability Benchmarking Failure — Root Cause Distribution (%)
No size segmentation in comparison
71%
Manual, infrequent data collection
64%
PM compliance excluded from score
57%
MTBF not tracked per asset class
49%
Generic industry average used as target
42%
No cross-site visibility for comparison
36%
Benchmark Against Plants Your Size — Not Every Plant.
OxMaint tracks uptime, MTBF, and PM compliance automatically and compares your plant against true size-matched peers.
Frequently Asked Questions
Why does plant size matter in reliability benchmarking?
Asset count, crew size, and shift complexity all affect uptime and MTBF, so comparing a small plant directly to a large multi-line site produces a misleading score.
What metrics belong in a reliability benchmark?
Uptime percentage, mean time between failures, and preventive maintenance compliance rate, normalized by asset count and segmented by plant size.
How does a CMMS support reliability benchmarking?
A CMMS captures downtime, MTBF, and PM completion automatically per asset, enabling live, size-segmented comparison instead of manual annual reviews.
Can reliability data be compared across multiple sites?
Yes — a multi-site CMMS dashboard shows reliability metrics from every plant in a portfolio, filterable by size band for fair comparison.
How often should reliability benchmarks be updated?
Continuously where possible — live data from work orders and PM schedules gives a far more accurate picture than quarterly or annual manual reviews.
See Where Your Plant Really Stands.
OxMaint turns work order and asset data into a live, size-matched reliability benchmark — free to start.