A maintenance budget that only shows a total tells you nothing about which assets are quietly draining it. One line item hides the chiller that costs twice what it should, the conveyor creeping toward replacement, and the transformer running clean — all averaged into a single number no one can act on. Benchmarking maintenance cost per asset, against replacement value and against peers, turns that flat total into a map of where the money actually goes. This guide shows how to do it, and how OXMAINT AI, the AI-powered CMMS, costs every work order back to the asset automatically.
Maintenance Cost per Asset Benchmarking for Manufacturing
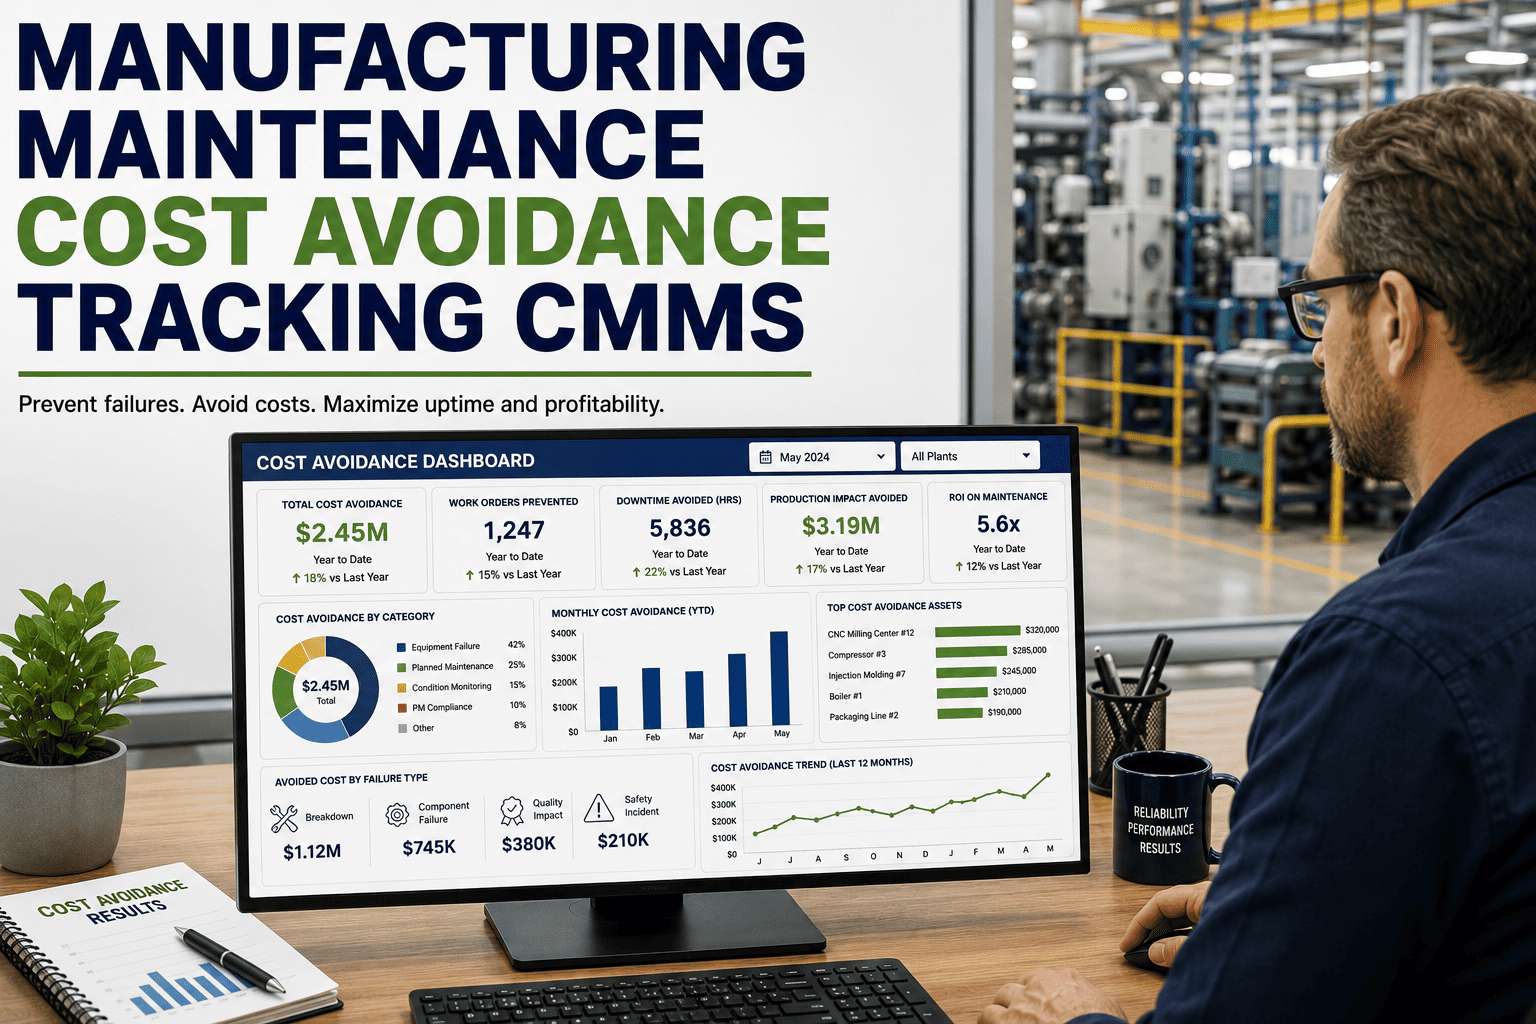
A single budget line, no idea which assets are bleeding it, and a replace-or-keep call made on a hunch — that's maintenance finance without benchmarking. OXMAINT AI, the AI-powered CMMS and maintenance management software, attributes labor, parts, contractor and downtime cost to each asset, measures it against replacement value, and flags the outliers — so the budget becomes a decision tool, not a mystery.
What Cost per Asset Actually Adds Up To
The number starts with a simple sum — four components rolled up per asset, not per department. Attribute each to the equipment it was spent on and the true cost of owning that asset appears, including the downtime most budgets never capture. OXMAINT AI costs each component automatically as work orders close. Book a demo to see per-asset costing in OXMAINT AI.
The downtime component is the one spreadsheets usually miss — and across a plant the indirect cost of production loss often exceeds all the direct costs combined. Leaving it out makes a cheap-looking asset look even cheaper than it is.
Normalize It: Cost as a Share of Replacement Value
Absolute spend can't be compared across a chiller and a conveyor — a big asset will always cost more to maintain. Dividing annual maintenance cost by the asset's replacement value (MC/RAV) normalizes it onto one scale, where a transformer and a boiler can finally be judged on the same terms. OXMAINT AI calculates it from live work-order data. Start free and benchmark your MC/RAV in OXMAINT AI.
Benchmarks Are Asset-Class Specific
A healthy MC/RAV for a conveyor isn't healthy for a transformer — each asset class carries its own band, its own watch level, and its own point where maintaining costs more than replacing. Benchmark each asset against its own class, not a plant-wide average. Book a demo to see class benchmarks in OXMAINT AI.
| Asset class | Healthy | Watch | Replace trigger |
|---|---|---|---|
| Centrifugal chillers | 2.5–4.5% | 5–7% | Above 8% |
| Air handling units | 1.5–3.5% | 4–6% | Above 7% |
| Industrial boilers | 2–4% | 5–6.5% | Above 8% |
| Conveyor systems | 3–6% | 7–9% | Above 12% |
| Electrical transformers | 0.5–1.5% | 2–3% | Above 4% |
A Flat Budget Hides the Asset That’s Eating It.
Averaged across a plant, the one asset costing double disappears into the total. Cost it per asset, normalize against replacement value, and the outlier stands out — the asset to rebuild, the one to replace, and the one running clean all become visible decisions instead of a single number.
Four Lenses on the Same Cost
One figure isn't enough to benchmark well — each lens answers a different question, and together they separate a genuinely expensive asset from one that's simply large or heavily used. OXMAINT AI tracks all four per asset. Start free and view every lens in OXMAINT AI.
Where the Money Goes — and Why Reactive Costs More
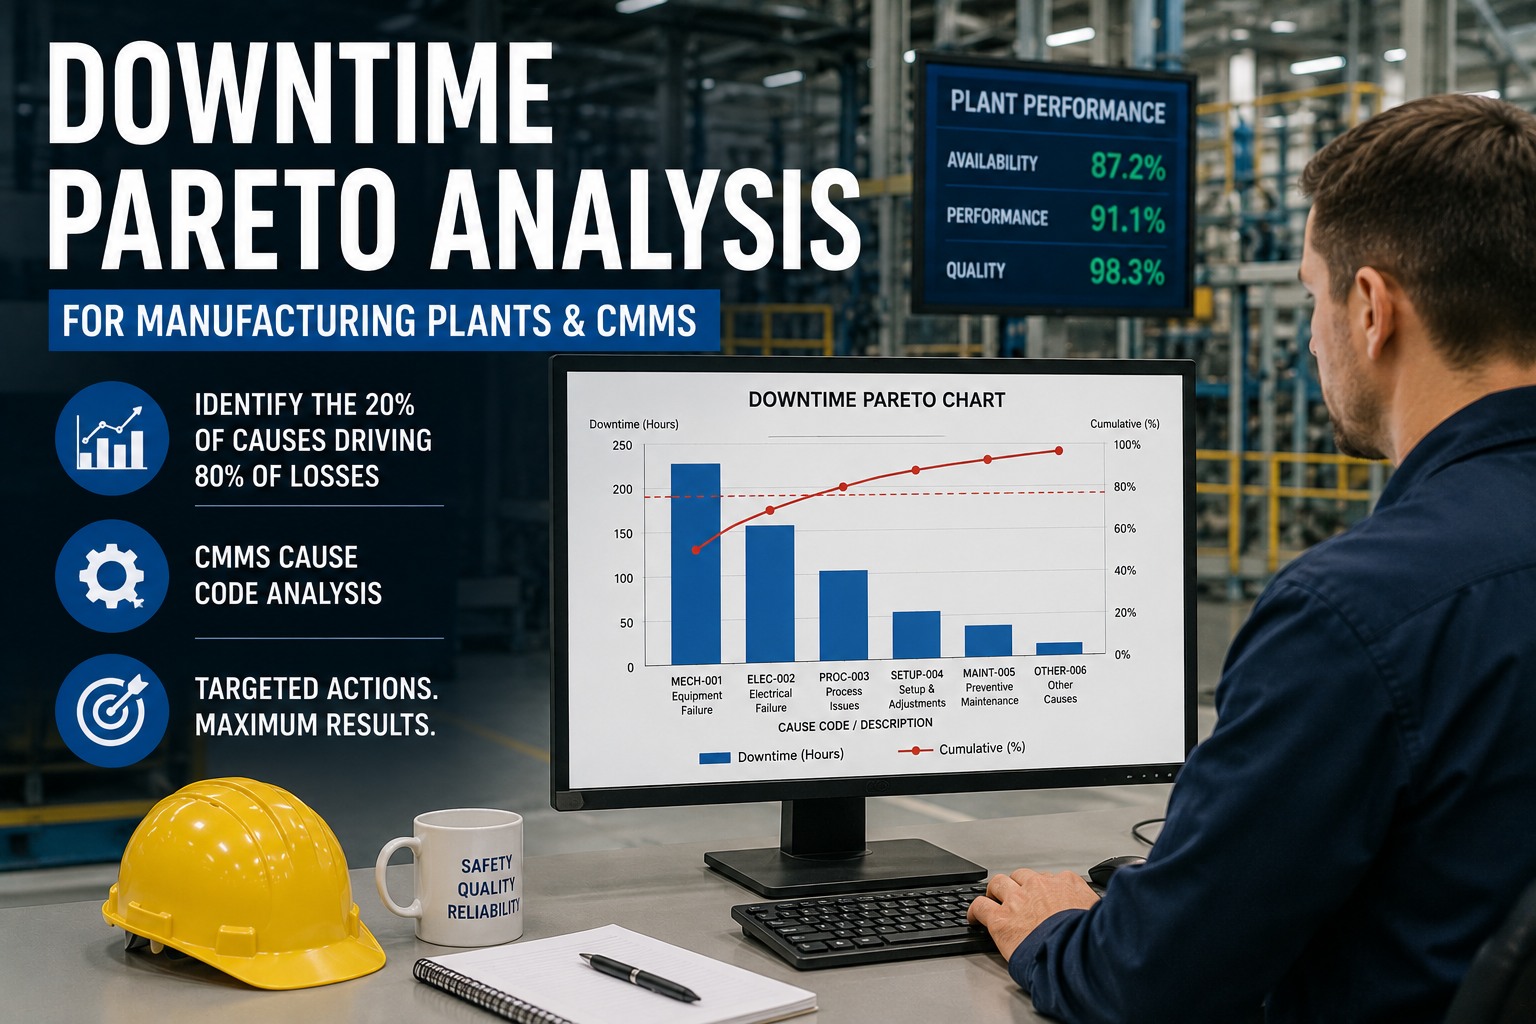
Benchmarking also means knowing the shape of the spend. In a typical manufacturing plant the maintenance dollar splits across a few categories — and the single biggest lever on the total is the planned-versus-reactive ratio. Book a demo to break down your spend in OXMAINT AI.
On top of those direct costs sits downtime production loss, which across a plant tends to exceed all of them combined — and it's driven by reactive work, which runs 3–5× the cost of the same job done as planned maintenance. Moving the planned-work ratio up is the most reliable way to pull the whole total down.
How OXMAINT AI Makes the Numbers Real
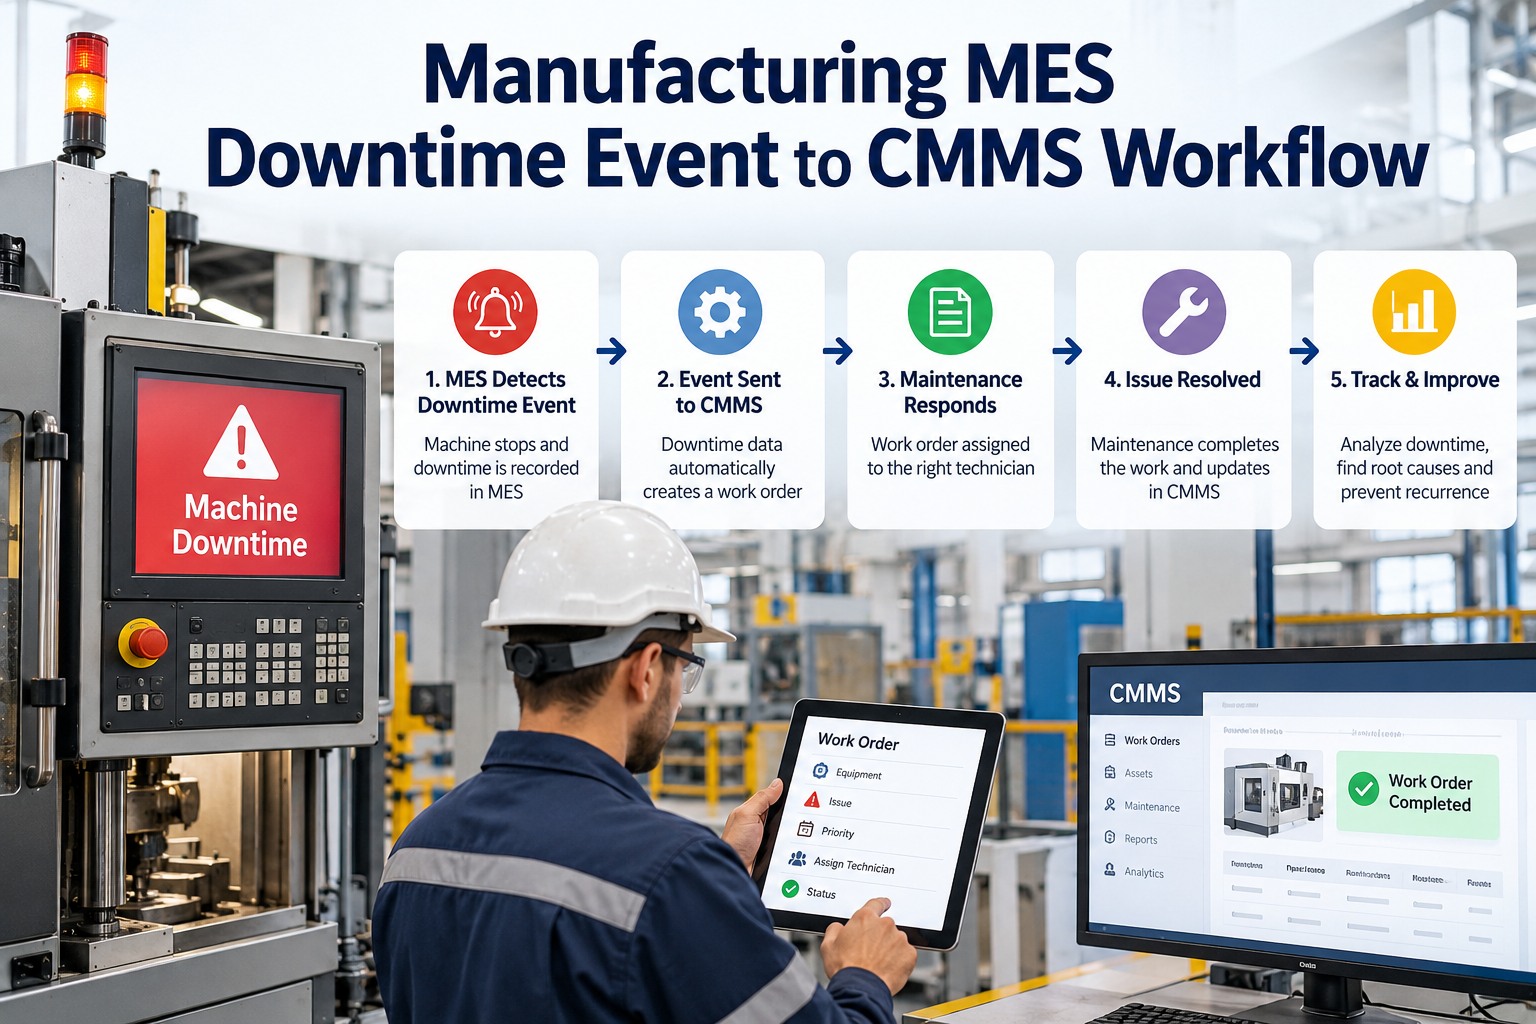
Benchmarking is only as good as the cost data behind it, and that data has to attribute to the asset automatically — not get re-keyed from invoices into a spreadsheet. OXMAINT AI captures it as the work happens. Start free and build real cost history in OXMAINT AI.
Finance saw one maintenance number, and every budget conversation was a standoff because nobody could say where the money went. Costing it per asset and against replacement value changed the whole discussion — we could point at the two chillers running well past their class band, show the twelve-month trend climbing on a third, and make the replace-or-rebuild case with evidence instead of opinion. The budget stopped being a fight and started being a plan.
Frequently Asked Questions
Turn the Budget Into a Map.
Benchmark maintenance cost per asset with the OXMAINT AI maintenance management software — the four-part per-asset cost, MC/RAV against class-specific bands, four analytical lenses, and live cost history for every CapEx case. Stop defending a flat total and start showing exactly where the money goes.