A maintenance team is usually paid for 2,080 hours a year and books maybe 700 of those as wrench time. The other 1,380 go to looking for parts, waiting for permits, chasing drawings and walking to the job. If you don't benchmark it, you can't fix it — and if you don't fix it, you're paying twice for every repair. OXMAINT AI is the AI-powered CMMS and maintenance management software that holds the six KPIs that decide labor efficiency against industry benchmarks and your own trend, so the quarterly review stops being an opinion and becomes a scorecard.
MANUFACTURING MAINTENANCE · LABOR EFFICIENCY BENCHMARKING · 2026
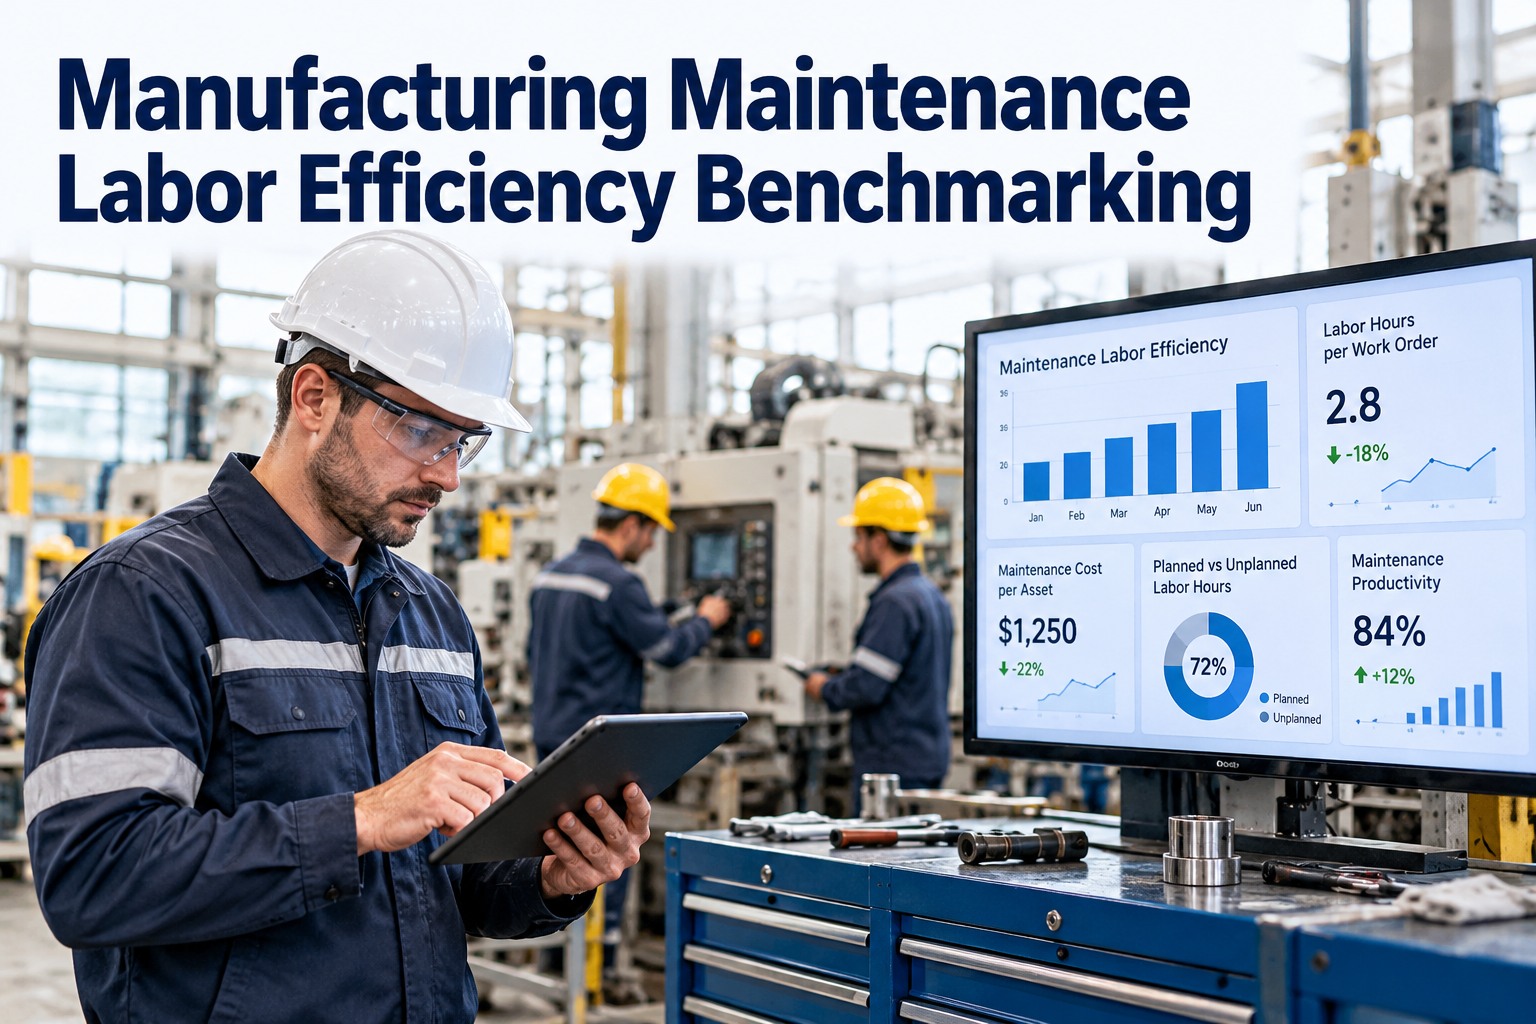
Manufacturing Maintenance Labor Efficiency Benchmarking
Six KPIs decide whether a maintenance team is laggard, median or best-in-class — wrench time, schedule compliance, PM compliance, planned WO share, MTTR and MTBF. The OXMAINT AI software scores each one against the industry benchmark and your own baseline, then ties each gap to the fix that closes it.
1Wrench time
2Schedule
3PM
4Planned WO
5MTTR
6MTBF
30-35%
wrench time is the industry median — best-in-class sits around 55%+
80:20
planned-to-reactive WO ratio is the mature-fleet benchmark — most plants land closer to 50:50
≥90%
PM compliance target under reliability-centered maintenance programs
4-5×
cost multiplier of a reactive repair over the same job planned in-shop
Your Score vs the Benchmark — Six KPIs at a Glance
The honest first step is a one-screen scorecard: your current KPI against the industry median and the best-in-class band. OXMAINT AI generates it live from the work-order log, so a quarterly review is a glance, not a re-pull from four spreadsheets — schedule a walkthrough of the KPI scorecard in OXMAINT AI.
LABOR EFFICIENCY SCORECARD · PLANT 02 · Q3
YouMedianBest-in-class
Wrench timeshare of paid hours spent on tools
Median 33% · Best 55%+
Schedule compliance% of weekly scheduled jobs completed
Median 70% · Best ≥ 90%
PM compliance% of PMs completed on cadence
Median 75% · Best ≥ 95%
Planned WO shareplanned vs reactive work orders
Median 55% · Best 80%+
MTTRmean time to repair — shorter is better
Median 6 hr · Best < 3 hr
MTBFmean time between failures — longer is better
Median 380 hr · Best 650+ hr
Where the Paid Hour Actually Goes
The industry median of 30-35% wrench time means most of a technician's paid hour disappears into coordination overhead. The breakdown below is what a sampled day-in-the-life study typically reveals — and almost every bar below "actual wrench time" is addressable without hiring.
Travel / walking to the job
16%
Looking for parts / stores
14%
Waiting for permit / isolation
11%
Drawings, instructions, info hunt
9%
Three Maturity Tiers — Which One Are You?
Benchmark numbers only mean something against a maturity reference. The three tiers below are the industry archetypes — each with a different wrench-time ceiling and a different cost structure.
LAGGARD
Wrench < 25%
Reactive-heavy. Low planned-WO share. PM slips when the floor is noisy. Spend high; service level low.
MEDIAN
Wrench 30-35%
PM broadly on cadence; parts and permit coordination still bleed hours. Where most plants sit without a focused program.
BEST-IN-CLASS
Wrench 50-60%
Scheduled kitting, pre-staged permits, mobile WO execution, condition-based triggers. Fewer hours doing more work.
You Cannot Fix the KPI You Don't Measure Honestly.
The OXMAINT AI software calculates every KPI from the work-order log directly — wrench time, schedule compliance, PM compliance, planned share, MTTR and MTBF — against the benchmark and your own trend. The quarterly review becomes a scorecard, not a slide-deck.
Gap-to-Action Playbook
A score below benchmark doesn't mean "work harder". Each gap has a specific fix. The playbook below ties each KPI shortfall to the control that closes it — and OXMAINT AI holds the control natively.
KPI below benchmark
Usually caused by
The fix
Low wrench time
Parts hunts, permit waits, info hunts
Pre-kitted WOs, mobile WO, pre-staged permits
Low schedule compliance
Reactive work bumping planned
Firm weekly schedule + reactive queue separation
Low PM compliance
Shop capacity consumed by walk-ins
PM time ring-fenced in the schedule
Low planned-WO share
No condition triggers; defects not captured
DVIR / sensor-to-WO loop; condition-based PM
High MTTR
Diagnosis time, no history, no spares staged
Asset history on mobile; kitting; failure-mode playbooks
Low MTBF
Root cause not addressed; repeat failures
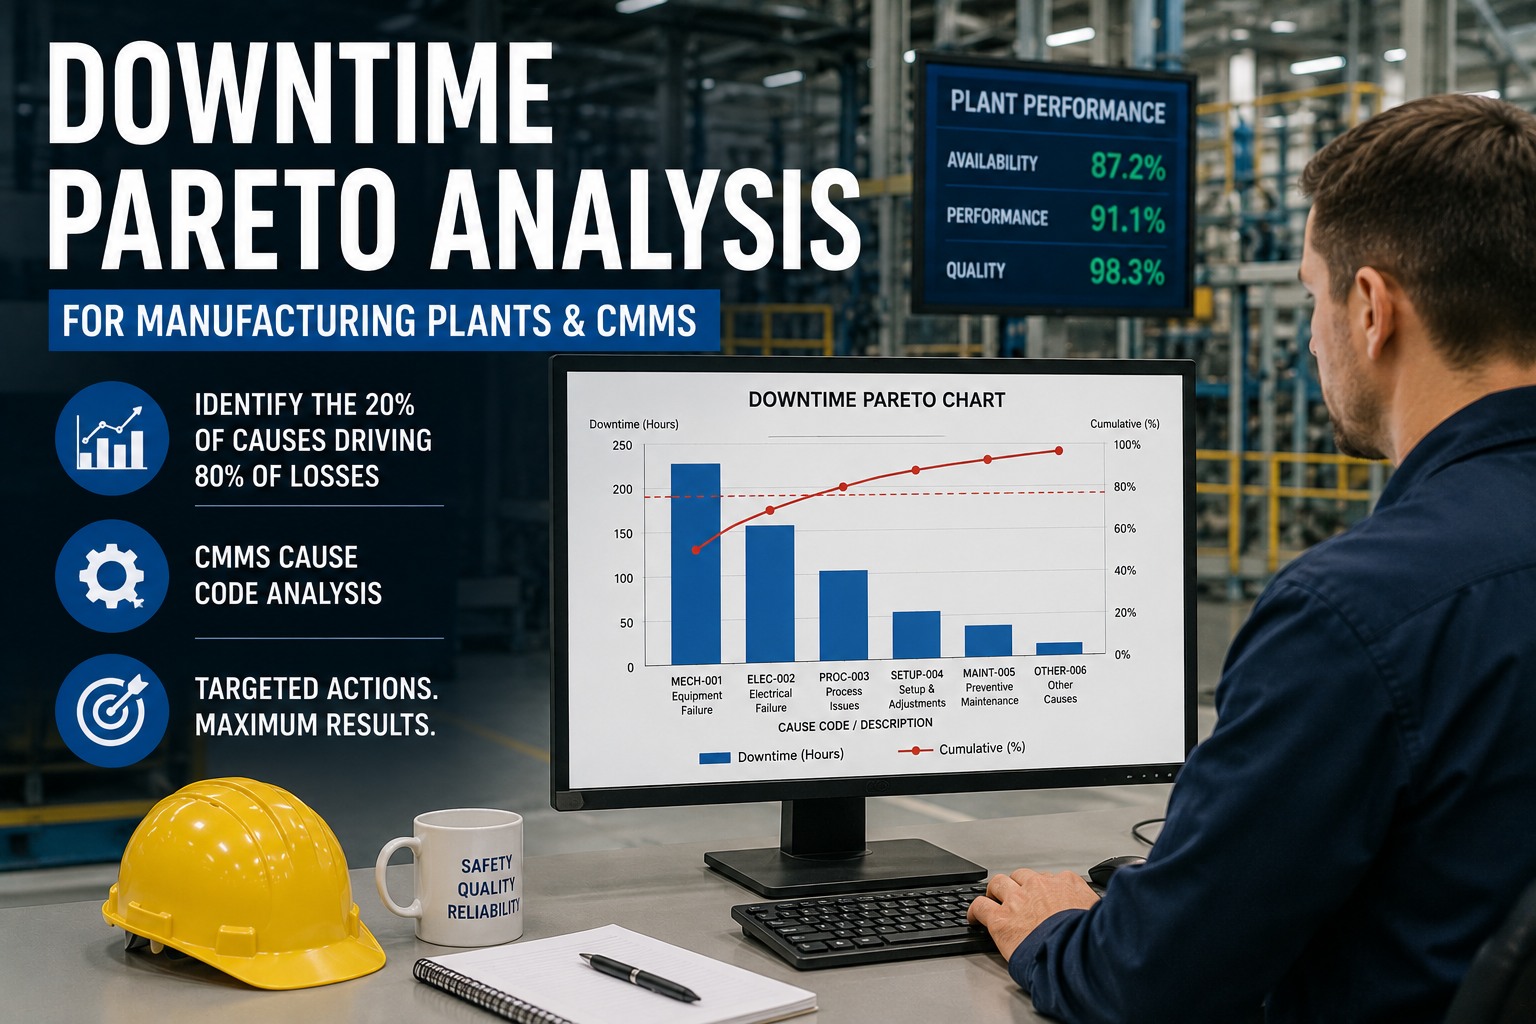
Repeat-failure flagging + RCA on top offenders
How OXMAINT AI Runs the Benchmarking Loop
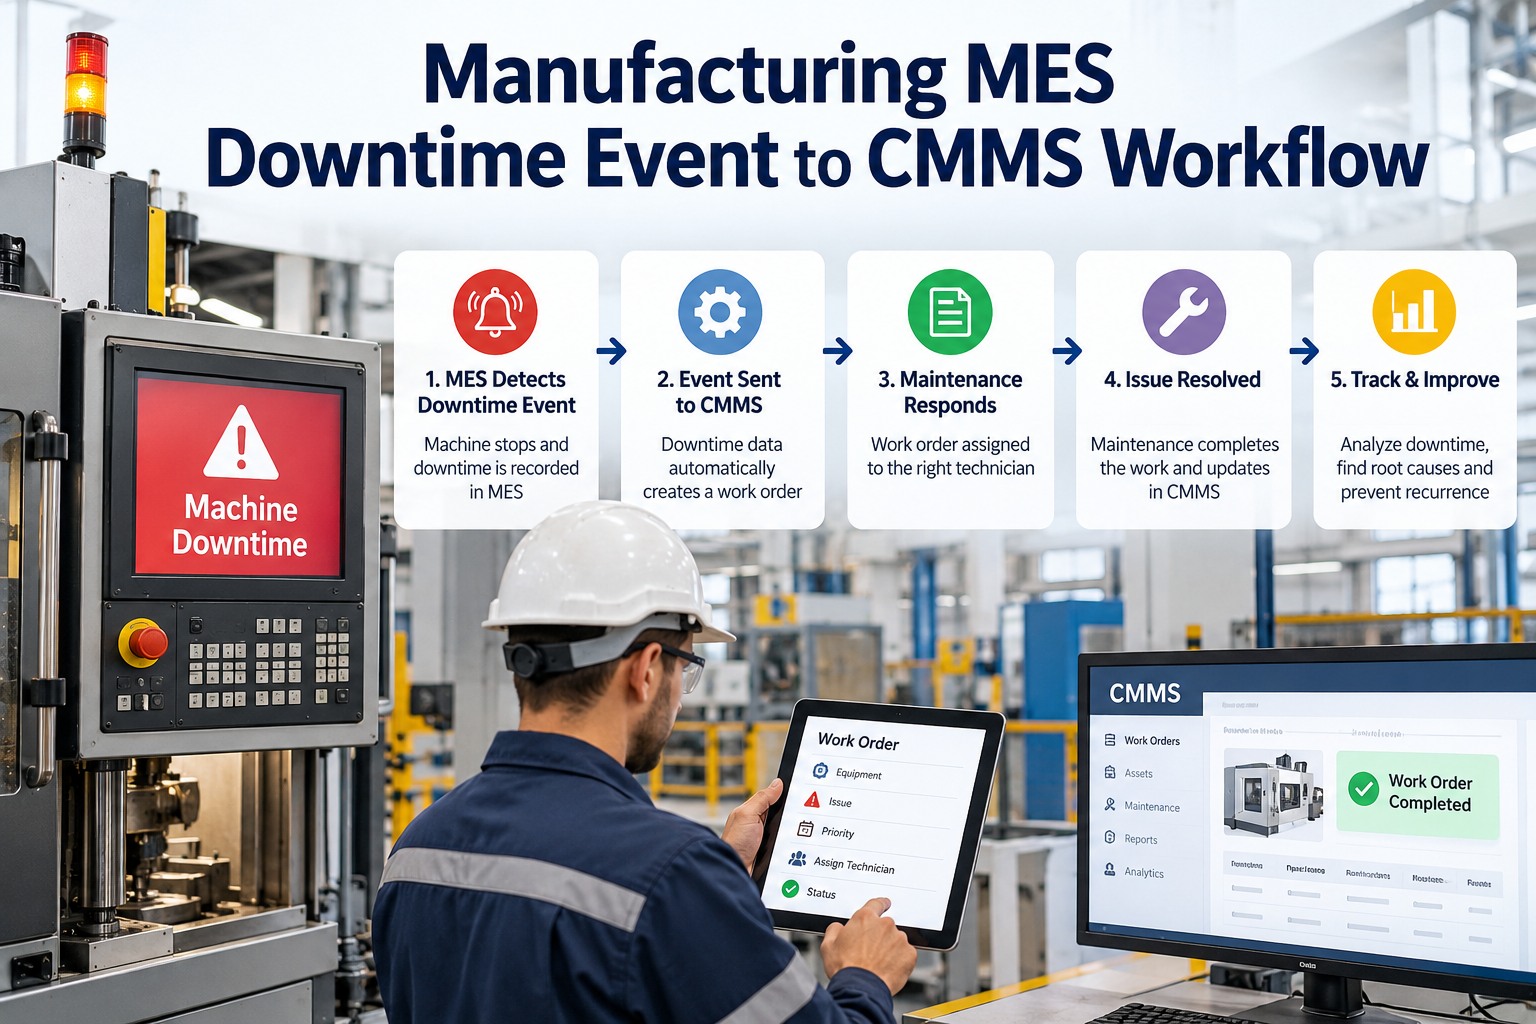
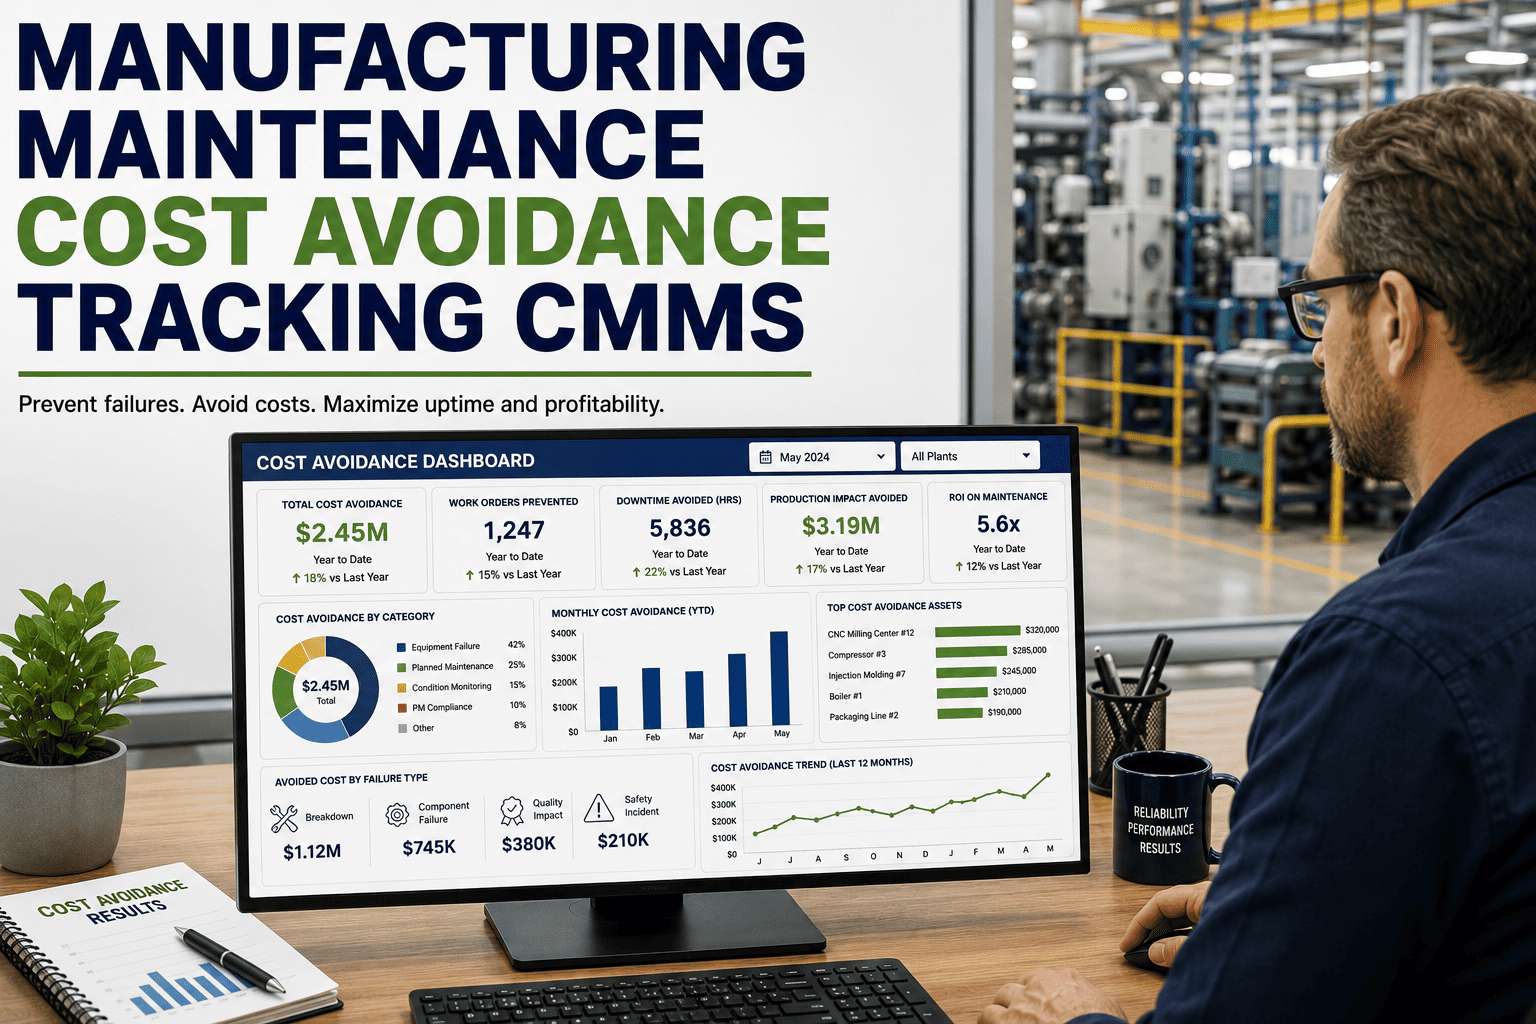
Every KPI on this page is calculated and tracked in the OXMAINT AI maintenance management software directly from the work-order log — so the benchmark review is live, not quarterly — spin up a free account and see your KPI scorecard in OXMAINT AI.
Live KPI Scorecard
All six KPIs scored against industry benchmark and your own trend — one dashboard per plant, per cell, per crew.
Wrench-Time Capture
Mobile execution timestamps tool-on-task vs coordination time — the real distribution, not a sampled estimate.
Repeat-Failure Flagging
Same issue, same asset, twice — the software flags it as a repeat and raises an RCA ticket instead of a third repair.
Parts Kitting & Staging
PM and corrective WOs land with their parts list already reserved — the single biggest wrench-time lever.
Schedule & PM Ring-Fencing
PM slots held in the weekly schedule; reactive queue separate — planned work stops losing to walk-ins by default.
Trend History
Quarter-over-quarter KPI history retained — the benchmark review shows direction, not just today's number.
Frequently Asked Questions
What is the single most important KPI to start with?
Are these benchmarks the same across every industry?
The directional ranges hold; the specific numbers shift by sector (discrete manufacturing differs from CPG, process plants differ from both). OXMAINT AI lets you set the benchmark band per plant class so you compare to the right peer group.
How is wrench time actually measured without a stopwatch study?
Mobile work-order execution timestamps start/stop on each task. The software derives wrench time from the actual on-tool time against paid hours — no sampling, no interviews.
How quickly can we see the KPIs move after the first fixes?
Parts kitting and schedule ring-fencing typically move wrench time 5-10 points in the first quarter. PM compliance moves faster once PM slots are protected in the schedule.
Measure the Hour. Then Earn It Back.
Put every KPI on the OXMAINT AI maintenance management software — wrench time, schedule and PM compliance, planned share, MTTR and MTBF — scored against the benchmark and your own trend. The hour you're paying for is the hour you can plan around.