Multi-line production sites operate under a unique reliability pressure: when one line degrades, adjacent lines absorb the load — accelerating wear, compressing maintenance windows, and turning a localized equipment risk into a plant-wide throughput problem. Reliability forecast visualization addresses this by surfacing where performance is likely to dip across each production line before the dip occurs — giving maintenance planners and operations managers a forward-looking view of asset health, not just a record of past failures. For reliability engineers, plant managers, and FM teams responsible for complex multi-line environments, the ability to visualize forecast data and act on it through a structured maintenance platform is the operational difference between planned downtime and unplanned loss. Sign Up Free with Oxmaint and connect your asset health forecasts to a cloud CMMS that turns visualization insights into assigned, tracked, and completed maintenance work orders — across every line in your facility.
Reliability Forecasting · Multi-Line Sites · Asset Health · Predictive Maintenance CMMS
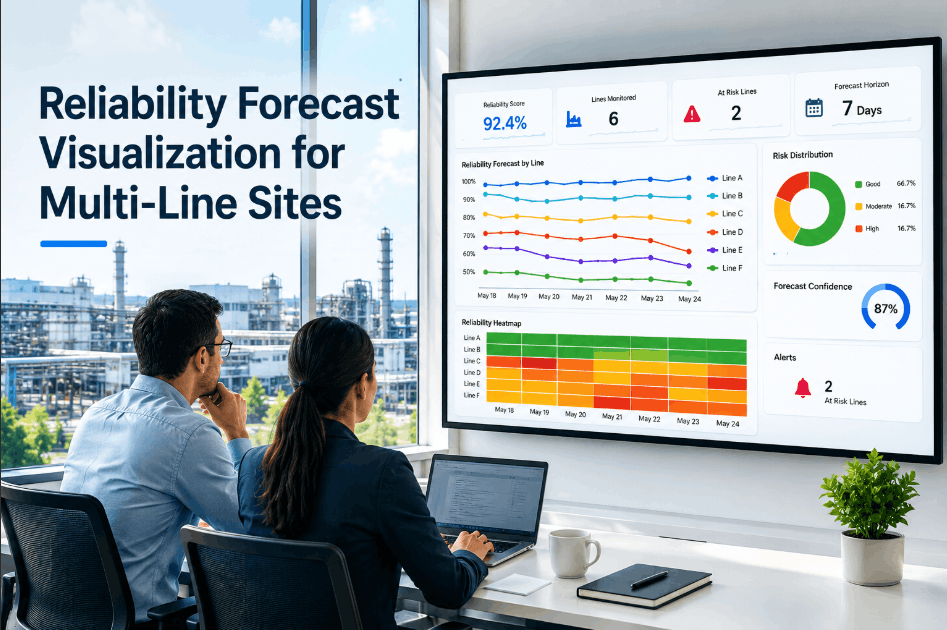
Visualize Reliability Risks Across Every Production Line — Act on Them With Oxmaint
Oxmaint's Cloud CMMS gives multi-line maintenance teams structured work orders, asset health tracking, PM compliance dashboards, and mobile-first execution — so forecast insights translate into real maintenance action before lines go down.
Why Reliability Forecast Visualization Matters for Multi-Line Operations
Reliability data without visualization is a spreadsheet. Visualization without maintenance execution is a dashboard. The gap between insight and action is where most multi-line facilities lose production value — forecast models identify degrading assets weeks in advance, but if that information doesn't reach a technician with a work order, it produces no operational benefit. Book a Demo to see how Oxmaint connects reliability forecast outputs to a structured maintenance execution platform — turning predicted performance dips into preventive work orders before they become unplanned stoppages.
Cross-Line Failure Cascade Risk
In multi-line facilities, a single line failure often overloads adjacent equipment. Reliability forecasting across all lines simultaneously reveals cascade risk — where degradation on one line will drive accelerated wear on others if left unaddressed.
Compressed Maintenance Windows
Continuous production schedules leave maintenance teams with narrow intervention windows. Forecast visualization enables planners to sequence maintenance activities across lines during planned downtime — rather than scrambling after unplanned failures.
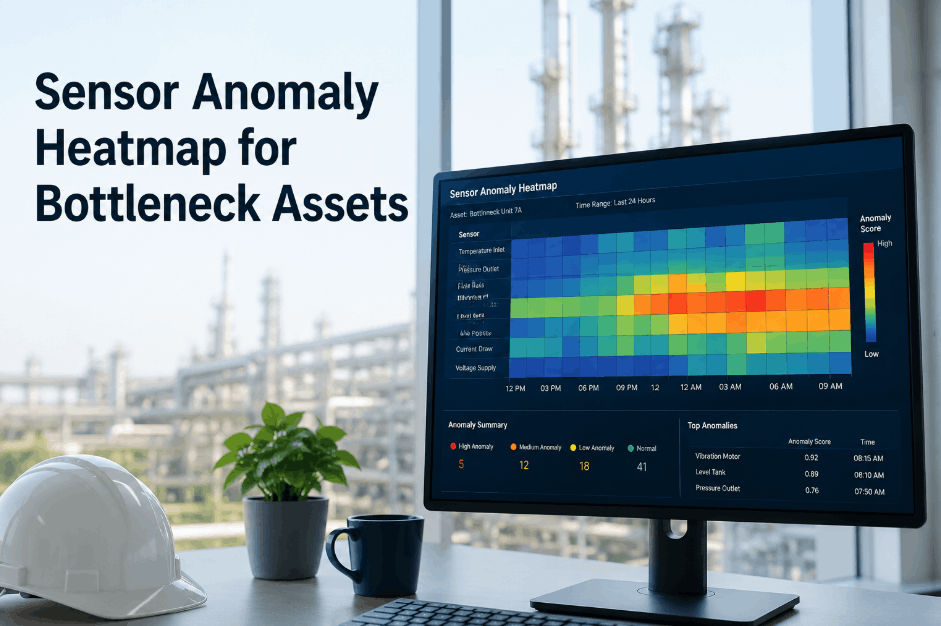
Anomaly Detection Across Multiple Assets
Multi-line sites generate telemetry from dozens or hundreds of assets simultaneously. Pattern recognition and anomaly detection across this data volume requires structured visualization to identify which signals represent developing faults versus normal operating variation.
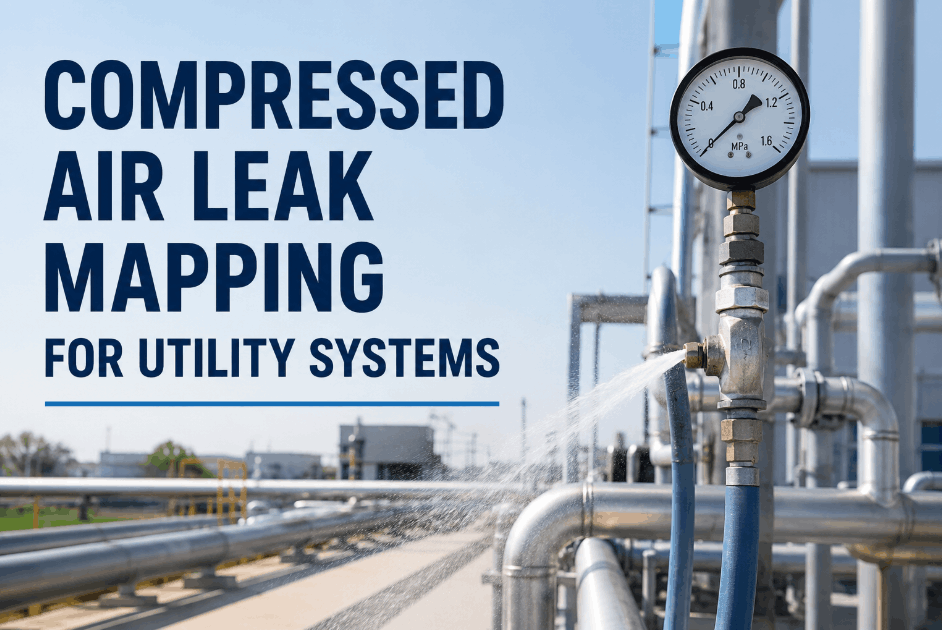
Sensor Drift and Forecast Quality Degradation
Reliability forecasts are only as accurate as their input data. Undetected sensor drift degrades prediction quality silently — producing confident-looking forecasts based on corrupted telemetry. Model confidence tracking and sensor health monitoring are prerequisites for trustworthy visualization.
No Maintenance Execution Layer
Many reliability visualization tools show risk scores and forecasts but lack a direct pathway to maintenance action. Without integration to a CMMS work order system, forecast insights remain observational — unassigned, untracked, and unverified.
Multi-Site Portfolio Complexity
Organizations managing multiple facilities need cross-site reliability forecast aggregation — not just line-level data. Portfolio-level visualization enables capital planning, resource allocation, and benchmarking across sites that site-level dashboards cannot support.
Reliability Forecast Visualization Framework for Multi-Line Maintenance Teams
Effective reliability forecast visualization for multi-line sites requires more than charts — it requires a structured layer that connects forecast outputs to maintenance scheduling, asset records, and team accountability. The following framework reflects best practices for building a visualization-to-execution pipeline across complex production environments. Book a Demo to see how Oxmaint provides the CMMS execution layer that converts forecast data into structured, mobile-accessible work orders for your multi-line maintenance teams.
Asset Health Scoring and Remaining Useful Life Forecasting
Machine learning models trained on historical telemetry, maintenance records, and operating parameters generate asset health scores and remaining useful life estimates for each critical asset across production lines. Visualizing these scores against line production schedules enables maintenance planners to prioritize interventions by both urgency and operational impact — scheduling the highest-risk assets for attention during the next available window.
Multi-Line Performance Trend Visualization
Displaying asset health trends across all production lines simultaneously reveals patterns invisible in single-asset views — clusters of degrading assets on the same line, correlated wear across parallel machines, or systematic performance decline following a specific maintenance event. Trend visualization converts individual data points into actionable maintenance planning intelligence for reliability engineers.
Forecast Confidence and Model Quality Monitoring
Reliability forecasts displayed without confidence intervals or model quality indicators mislead planners into over-reliance on degraded predictions. Visualizing model confidence scores alongside forecast outputs — and flagging assets where feature drift or sensor anomalies have reduced prediction quality — enables teams to distinguish high-confidence maintenance signals from uncertain estimates requiring manual inspection.
Forecast-Triggered Preventive Maintenance Scheduling
The direct connection between reliability forecast visualization and preventive maintenance scheduling is where operational value is realized. Oxmaint enables maintenance teams to convert forecast-identified risk windows into scheduled PM work orders — assigned to technicians, linked to asset records, completed on mobile devices, and verified with photo evidence — closing the loop between prediction and prevention.
Cross-Site Reliability Benchmarking and Capital Planning Support
For organizations managing multiple facilities, aggregated reliability forecast visualization across sites enables comparative benchmarking — identifying which sites are trending toward higher asset replacement rates, where PM compliance correlates with better forecast outcomes, and which capital investments will deliver the greatest reliability return. Oxmaint's portfolio-level dashboard provides the cross-site PM compliance and asset health visibility that supports these decisions.
How Oxmaint Connects Reliability Forecasts to Maintenance Execution
Oxmaint is a cloud CMMS platform built for multi-asset, multi-site maintenance teams that need structured PM scheduling, work order management, and asset health tracking without on-premise infrastructure or complex deployment. For organizations using reliability forecasting and condition monitoring tools, Oxmaint serves as the operational execution layer — converting forecast-identified risks into assigned, trackable, documented maintenance actions. Sign Up Free to register your production line assets and connect your reliability program to a maintenance execution platform your team can use from any device, at any site.
| Reliability Challenge |
Without CMMS Integration |
With Oxmaint |
| Forecast-to-action gap |
Insights sit in dashboards, no maintenance handoff |
Forecast signals trigger assigned digital work orders |
| Multi-line PM scheduling |
Manual coordination, spreadsheet-based, missed windows |
Auto-recurring work orders with mobile alerts across all lines |
| Asset health history |
Fragmented across monitoring tools and paper records |
Unified asset record with full maintenance and condition history |
| Cross-site visibility |
Site-level reports, no portfolio comparison |
Portfolio dashboard with PM compliance and asset health KPIs |
| Maintenance accountability |
Verbal handoffs, no completion verification |
Photo-verified work order sign-off with timestamp and technician record |
Most Common Reliability Visualization Failures in Multi-Line Sites — And How to Prevent Them
Reliability forecast programs in multi-line facilities frequently underperform not because the forecasting technology fails, but because the operational structures needed to act on forecast outputs are absent. The failure modes below represent the most common gaps between reliability visualization and maintenance execution — each addressable through structured CMMS deployment. Sign Up Free to build the execution foundation in Oxmaint that makes your reliability forecast investment deliver measurable uptime improvement.
01
Forecast Data Never Reaches Technicians
Reliability dashboards accessible only to engineers or managers create an execution gap — technicians performing preventive maintenance are unaware of the forecast context driving their work order. Oxmaint links forecast-generated work orders to asset records that technicians access on mobile, giving them the data context needed for effective intervention.
02
Single-Asset Visualization Hiding Line-Level Risk
Viewing asset health forecasts one machine at a time masks multi-asset risk patterns on the same production line. A line with three assets in the 60–70% health range presents a higher collective risk than a single asset at 55% — but single-asset dashboards don't reveal this aggregate picture to maintenance planners.
03
No PM Compliance Baseline for Model Training
Reliability models trained on data from facilities with inconsistent PM histories produce lower-quality forecasts — because the maintenance actions that should reset asset health are not reliably recorded. Structured CMMS records in Oxmaint provide the PM history data quality that improves forecasting model accuracy over time.
04
Visualization Without Prioritization
Displaying all asset health scores equally — without weighting by asset criticality, production line dependency, or replacement lead time — forces maintenance planners to manually assess priority from raw data. Signal ranking that factors in operational impact gives multi-line teams a pre-prioritized action queue rather than a data review exercise.
05
Disconnected Spare Parts and Lead Time Planning
A reliability forecast that predicts bearing failure in three weeks is only actionable if spare parts are on hand. Without CMMS-linked asset records that include component data and procurement triggers, forecast-identified replacement needs arrive as emergency orders — erasing the planning advantage the forecast created.
06
Inconsistent Post-Maintenance Data Capture
Reliability models need accurate post-maintenance condition data to recalibrate forecasts after interventions. When technicians don't log completion details, measurements, or observations — because there is no structured mobile work order system — forecast models operate on stale baselines and produce declining prediction quality over time.
Reliability Forecasting · Multi-Line CMMS · Predictive Maintenance · Asset Health
From Forecast Visualization to Maintenance Action — One Platform for Every Line
Oxmaint connects reliability forecast outputs to digital work orders, asset records, and technician accountability across every production line and site in your portfolio — turning prediction into prevention.
Frequently Asked Questions — Reliability Forecast Visualization for Multi-Line Sites
What is reliability forecast visualization for multi-line sites?
Reliability forecast visualization displays predicted asset health trends and performance dip windows across all production lines simultaneously — enabling maintenance planners to identify cascade risks, prioritize interventions, and schedule preventive work before lines degrade or stop.
How does Oxmaint support reliability forecasting programs?
Oxmaint provides the execution layer — converting forecast-identified risks into assigned digital work orders, asset-linked PM schedules, and photo-verified completion records — giving reliability teams a documented, trackable pathway from prediction to maintenance action.
Can Oxmaint manage PM scheduling across multiple production lines simultaneously?
Yes. Oxmaint supports auto-recurring work orders across all assets on all production lines, with a portfolio-level PM compliance dashboard that gives maintenance managers cross-line visibility into scheduled, completed, and overdue tasks from a single interface.
What role does sensor drift play in reliability forecast quality?
Sensor drift degrades the telemetry input to forecasting models — reducing prediction quality without any visible warning in the forecast output. Structured sensor calibration PM records in Oxmaint ensure the data feeding reliability models remains accurate and auditable.
How quickly can a multi-line facility deploy Oxmaint?
Most teams are live within one to two days — assets uploaded in bulk, QR codes attached to equipment, and technicians submitting mobile work orders the same week.
Sign Up Free to start your deployment today.
Does Oxmaint support cross-site reliability benchmarking?
Oxmaint's portfolio-level dashboard aggregates PM compliance, asset health, and work order completion data across all sites — enabling reliability managers to benchmark performance between facilities and identify which sites require additional resource or capital planning attention.
Book a Demo to see the multi-site view in action.
Multi-Line Reliability · Forecast Visualization · CMMS Execution
Predict the Dip. Plan the Maintenance. Protect Every Line.
Oxmaint turns reliability forecast data into mobile work orders, PM schedules, and asset health records — giving your multi-line maintenance teams the structured execution platform that makes forecast investment pay off in real uptime.