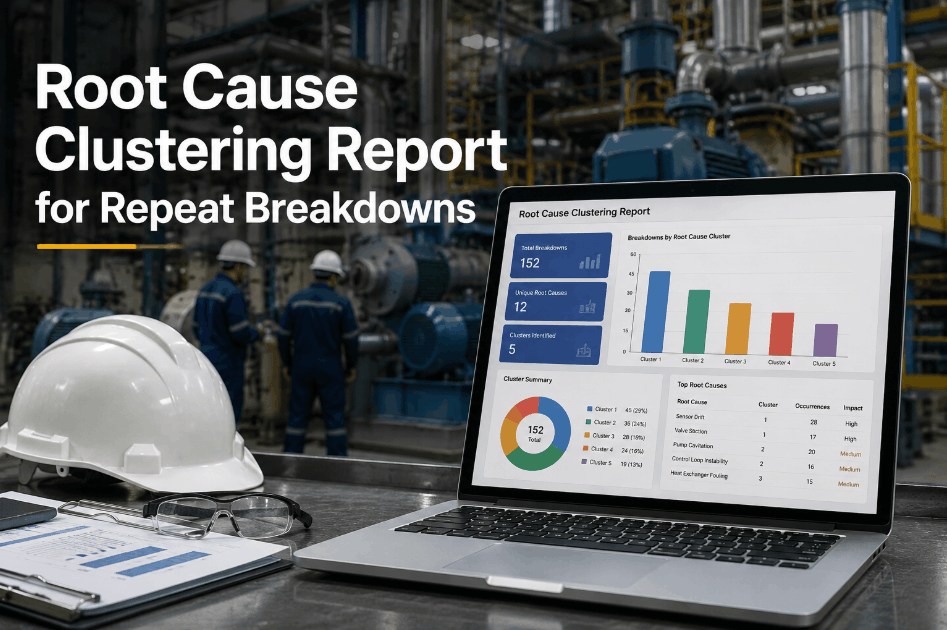
Root cause clustering transforms repeat breakdown data from a reactive maintenance record into a predictive intervention tool. When the same equipment fails repeatedly across different machines, shifts, or production lines, isolated work order records obscure the shared underlying driver — a systemic lubrication gap, a procurement substitution, a PM interval mismatch — that will continue generating failures until it is identified and resolved. Without a structured root cause clustering methodology embedded in your CMMS, maintenance teams fix the same breakdowns at full cost every cycle instead of eliminating the root pattern once. Sign Up Free to connect Oxmaint's root cause analysis and work order clustering tools to your facility's breakdown history. Facilities that implement structured root cause clustering report 30–45% reductions in repeat failure rates within six months and achieve significant shifts in planned-to-reactive maintenance ratios. Book a Demo to see how Oxmaint groups repeat breakdown patterns and surfaces the shared root causes driving your highest-frequency failure modes.
ROOT CAUSE ANALYSIS · REPEAT BREAKDOWNS · CMMS ANALYTICS
Cluster Repeat Breakdowns and Eliminate Root Causes in Oxmaint
Work order pattern analysis, failure mode clustering, root cause tagging, and corrective action tracking — built for maintenance teams ready to stop fixing the same problems repeatedly.
Why Repeat Breakdowns Persist Without Root Cause Clustering
Most CMMS platforms record what broke and when — but do not automatically connect work orders that share the same underlying cause. When root cause analysis is performed in isolation for each breakdown event, reliability teams cannot see the cross-asset, cross-shift, or cross-time patterns that define systematic failure drivers. Sign Up Free to map your facility's repeat breakdown patterns using Oxmaint's failure clustering analytics.
WHY REPEAT BREAKDOWNS PERSIST WITHOUT STRUCTURED CLUSTERING
01
Work Orders Treated as Isolated Events
Each breakdown generates its own work order, completed, and closed without reference to previous similar failures. The pattern connecting five bearing failures across three machines over 90 days is invisible without cross-work-order analysis.
02
Symptom-Level Root Causes Recorded
Technicians record what they found at the point of failure — worn bearing, broken belt, seized pump — rather than the upstream cause: wrong lubricant specification, over-tensioned drive, cavitation from incorrect impeller sizing.
03
No Failure Mode Taxonomy
When failure descriptions are free-text and unstandardized, clustering algorithms and manual reviews alike cannot group similar failures. "Motor tripped" and "Motor overload shutdown" represent the same failure mode recorded in incompatible formats.
04
Corrective Actions Not Tracked to Completion
Root causes are identified during post-failure reviews but corrective actions — design changes, PM interval revisions, parts substitutions — are assigned informally and never tracked to verified completion, leaving the failure driver active.
05
Cross-Site Patterns Missed
Multi-facility operations running the same equipment model experience the same root cause failures independently, each site solving the problem in isolation at full cost rather than sharing the corrective action resolution across the organization.
06
No Recurrence Verification Step
After a root cause is identified and a corrective action implemented, there is no structured process to verify that the fix eliminated recurrence. The failure returns six months later and is treated as a new event rather than a failed corrective action.
Root Cause Clustering Methodology: The Five-Phase Framework
Effective root cause clustering requires a consistent methodology that standardizes failure data collection, groups work orders by shared characteristics, identifies upstream causal patterns, assigns corrective actions, and verifies elimination. Book a Demo to see how Oxmaint automates each phase of this framework using your existing work order data.
ROOT CAUSE CLUSTERING — 5-PHASE METHODOLOGY
01
Standardize Failure Data Collection
Implement a structured failure taxonomy within Oxmaint's work order forms — failure category, failure mode, failed component, and suspected cause — enforced at the point of work order closure. Standardized inputs are the prerequisite for meaningful clustering across work orders, assets, and time periods.
02
Cluster Work Orders by Shared Attributes
Group completed work orders by failure mode, failed component class, asset type, and production area over a defined analysis window (typically 90–180 days). Oxmaint's clustering report automatically surfaces work order groups that share two or more common attributes, flagging them for root cause investigation priority ranking.
03
Apply Root Cause Analysis to Each Cluster
For each identified cluster, conduct a structured root cause analysis — using 5-Why, fishbone analysis, or fault tree methods — to identify the upstream driver shared across all events in the cluster. Document findings directly within Oxmaint's cluster analysis record to maintain traceability from individual work orders to confirmed root cause.
04
Assign and Track Corrective Actions
Generate corrective action work orders within Oxmaint for each identified root cause — PM interval changes, parts specification updates, operator training tasks, or design modifications. Track each corrective action to verified completion with assigned ownership, due date, and completion documentation, preventing informal handoffs that leave root causes unresolved.
05
Monitor Recurrence and Verify Elimination
After corrective action completion, monitor the affected asset group for recurrence over a defined verification window (typically 90–180 days post-implementation). Oxmaint's recurrence tracking module flags any work orders matching the original cluster's failure attributes, triggering a corrective action effectiveness review before the failure pattern re-establishes itself.
Root Cause Clustering KPIs: Benchmarks for Repeat Failure Reduction
Measuring the impact of root cause clustering requires KPIs that capture failure recurrence, corrective action completion, and the overall shift in reactive maintenance volume. These benchmarks define performance standards for manufacturing reliability programs. Book a Demo to see Oxmaint's root cause analytics dashboard tracking these metrics across your entire asset population.
ROOT CAUSE CLUSTERING KPIs — REPEAT FAILURE REDUCTION BENCHMARKS
Repeat Failure Rate
Same-mode failures within 90 days ÷ total failures
> 35%
12–20%
< 8%
Corrective Action Closure Rate
Corrective actions closed on time ÷ total assigned
< 55%
72–85%
> 92%
Cluster Identification Rate
Failures grouped in clusters ÷ total failures reviewed
< 30%
55–70%
> 80%
Mean Time Between Failures (MTBF)
Total operating time ÷ number of failures
Decreasing QoQ
Stable
Increasing QoQ
Root Cause Identification Rate
Failures with confirmed root cause ÷ total failures
< 40%
65–78%
> 90%
Reactive Maintenance Reduction
Emergency WOs current period vs. baseline period
No change
–15 to –25%
> –35%
How Oxmaint Powers Root Cause Clustering for Manufacturing Teams
Oxmaint's CMMS gives reliability teams the data structure, analytics tools, and corrective action workflow to transform individual breakdown records into actionable cluster intelligence. Rather than requiring external analysis tools, Oxmaint surfaces repeat failure patterns directly within the work order management layer where corrective actions can be assigned and tracked to completion. Sign Up Free to activate Oxmaint's root cause and repeat failure clustering capabilities for your facility today.
HOW OXMAINT ENABLES ROOT CAUSE CLUSTERING FOR REPEAT BREAKDOWNS
01
Structured Failure Taxonomy in Work Orders
Enforces standardized failure category, mode, and component fields at work order closure — creating the consistent data foundation required for meaningful cluster analysis across assets and time.
02
Automated Repeat Failure Detection
Oxmaint automatically flags when a new work order shares failure mode and component attributes with previous work orders within a configurable time window — surfacing potential clusters before they accumulate undetected.
03
Cluster Analysis Report Generation
Generate grouped breakdowns reports by failure mode, asset class, production area, and time period with a single click — giving reliability engineers a pre-organized view for root cause investigation without manual data extraction.
04
Corrective Action Work Order Tracking
Link corrective actions directly to root cause records in Oxmaint with ownership assignment, due dates, and completion verification — ensuring no corrective action is informally assigned and forgotten.
05
Recurrence Monitoring Dashboard
Track whether corrective actions successfully eliminated recurrence over post-implementation monitoring windows, with automated alerts when new failures match resolved cluster attributes — catching ineffective corrections early.
06
Cross-Facility Pattern Sharing
Multi-site Oxmaint deployments enable root cause findings and verified corrective actions from one facility to be shared across all sites running the same asset types — eliminating duplicate failure investigation costs.
ROOT CAUSE ANALYSIS · FAILURE CLUSTERING · PREDICTIVE MAINTENANCE
Stop Fixing the Same Breakdowns — Cluster Root Causes in Oxmaint
Structured failure taxonomy, automated repeat failure detection, corrective action tracking, and recurrence monitoring — everything reliability teams need to eliminate repeat breakdowns permanently.
Frequently Asked Questions
Q1 What is root cause clustering in maintenance management?
Root cause clustering groups repeat breakdown work orders by shared failure mode, component, and asset attributes to identify the single upstream driver causing multiple failures — enabling one corrective action to eliminate many recurrences rather than fixing each breakdown in isolation.
Q2 How does Oxmaint automatically detect repeat failure patterns?
Oxmaint compares incoming work order failure attributes — mode, component, asset class — against historical records within a configurable lookback window. Matches above a defined threshold automatically flag for clustering review, surfacing patterns without manual data analysis.
Q3 Why is a standardized failure taxonomy essential for clustering?
Free-text failure descriptions make it impossible to algorithmically group similar events. Standardized failure modes and component codes ensure that identical failures recorded on different shifts or by different technicians are recognized as the same event type during cluster analysis.
Q4 How do corrective actions get tracked to completion in Oxmaint?
Corrective actions are created as linked work orders with assigned owner, due date, and required completion documentation. Oxmaint's dashboard tracks open corrective actions by age and owner, with escalation alerts when actions approach or breach their due dates.
Q5 How long does it take to see repeat failure reduction after implementing clustering?
Facilities with sufficient historical work order data typically see measurable repeat failure rate reductions within 60–90 days of implementing structured clustering and corrective action tracking. The full impact compounds over 6–12 months as corrective actions for multiple cluster types are completed and verified.
Q6 Can Oxmaint share root cause findings across multiple plant locations?
Yes. Multi-facility Oxmaint deployments allow confirmed root cause records and verified corrective actions to be shared across sites running similar equipment. This prevents each location from independently discovering and solving the same root cause failures at full investigation cost.
ROOT CAUSE CLUSTERING · CMMS · RELIABILITY MANAGEMENT · MANUFACTURING
Build Your Repeat Breakdown Elimination Program in Oxmaint
From failure data standardization to cross-asset clustering and corrective action verification — Oxmaint gives your reliability team the complete toolkit to move from reactive repair cycles to permanent root cause elimination.