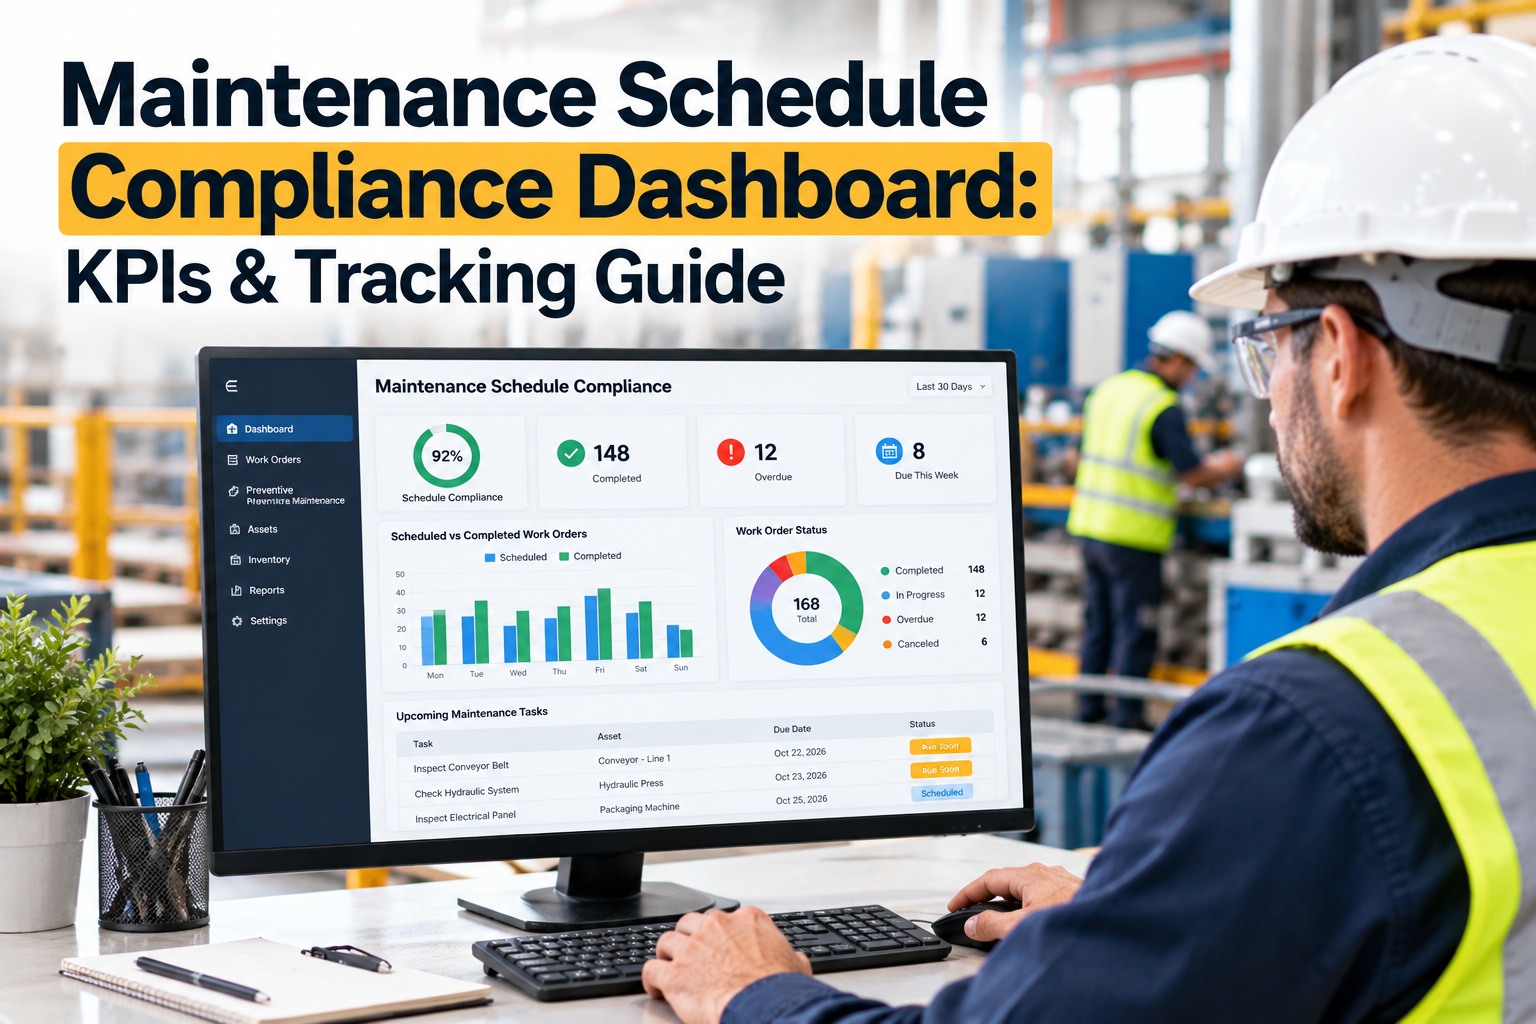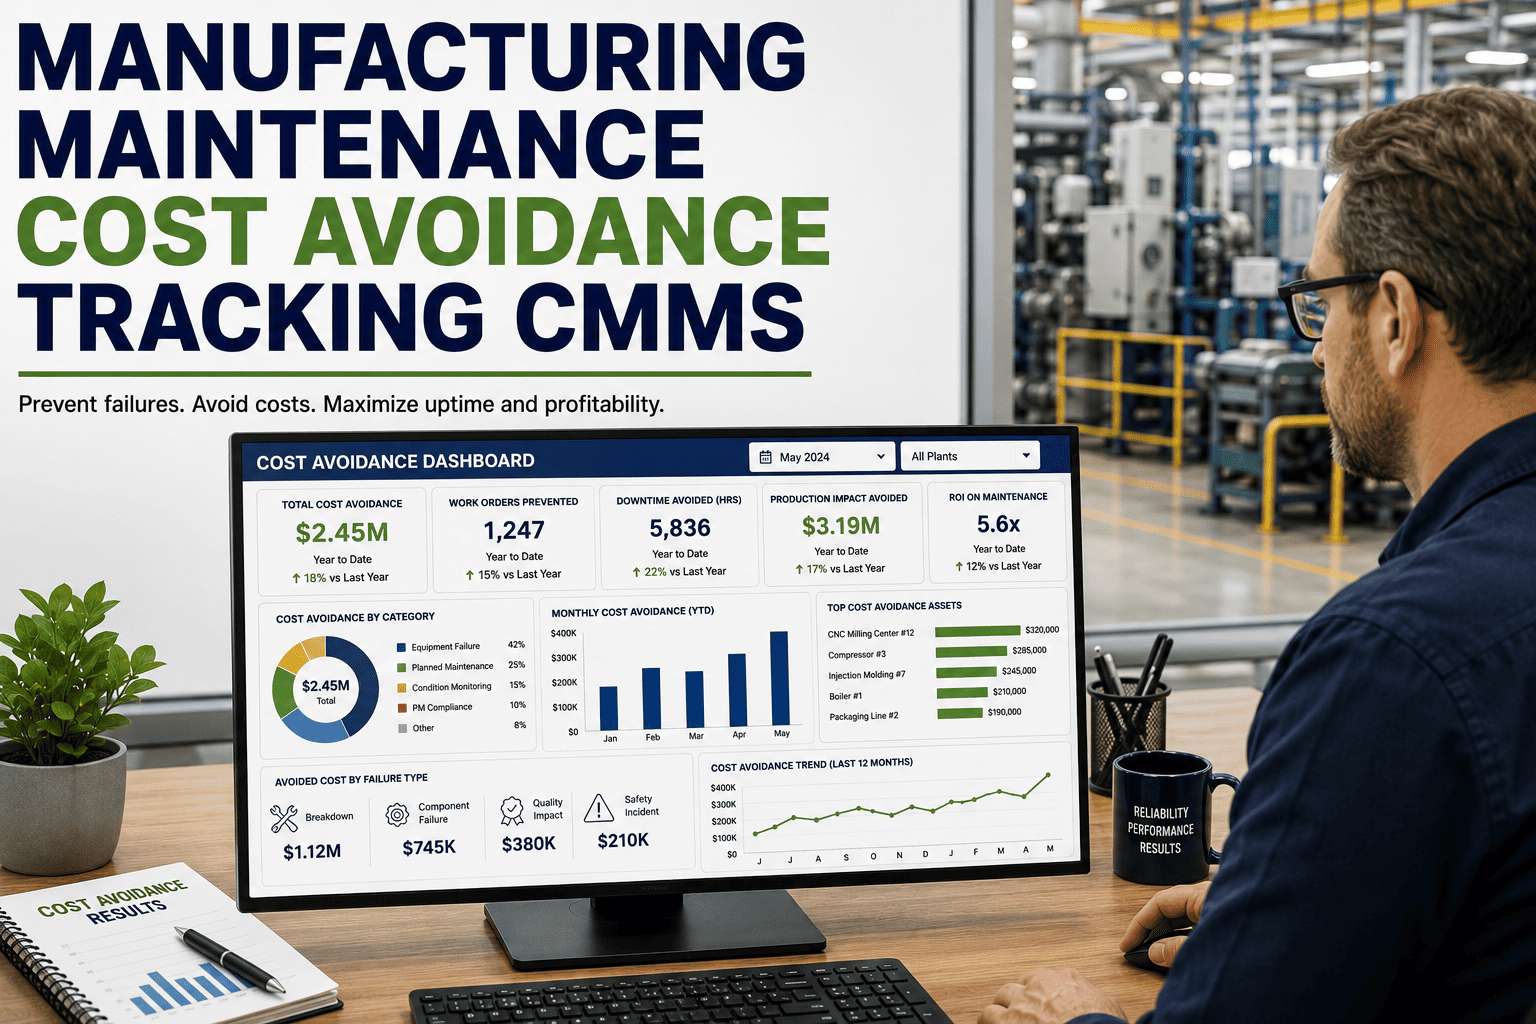
Schedule compliance is the single most reliable leading indicator of maintenance maturity in a manufacturing plant — measure it honestly and you can predict equipment availability, overtime spend, and downtime risk months in advance. Plants that hold above 90% compliance operate proactively: work is planned, kitted, and executed inside the scheduled week without break-ins or emergency reroutes. Plants below 60% are firefighting by default, with planners rerunning the same wrench-turning week after week while backlog balloons and PMs slip silently. This guide unpacks how to measure compliance correctly in a CMMS, why break-in work destroys it, and the planning discipline top-quartile plants use to protect the schedule week after week — so you can stop reacting and start Start Free Trial with a system that actually holds the line.
Are you running a proactive plant — or just fighting fires every week?
Schedule compliance above 90% signals a planned, disciplined maintenance organization. Below 60%, you are in reactive mode — backlog grows, PMs slip, and downtime costs compound weekly. The gap between the two is closeable in 90 days.
What schedule compliance actually measures — and what it predicts
Schedule compliance is the percentage of scheduled maintenance work hours actually completed within the planned week. It is not a productivity metric — it is a predictability metric, and it forecasts reliability better than any lagging indicator.
Why break-in work destroys compliance — and how to contain it
Break-in work is unscheduled work inserted into the weekly schedule after it is frozen. A single break-in displaces two to three planned jobs, because the crew, tools, and parts were committed to the original plan.
One break-in displaces 2–3 planned jobs
When an emergency insert takes a technician off a PM, the PM doesn't just move — it cascades. The kitted parts sit unused, the crane booking lapses, and the PM reschedules into a week that is already 85% loaded. Within two weeks, three PMs are late instead of one.
Break-ins bypass the CMMS — so they are never measured
If break-in work is verbal or scribbled on a whiteboard, it never enters the CMMS as a scheduled event. The compliance metric looks healthy (95%+) while the plant is quietly running on chaos. Top-quartile plants log every break-in as a charged event with a reason code.
Tolerance for break-ins becomes the operating norm
When operations learns the schedule is "flexible," every minor issue becomes an emergency insert. Within a quarter, break-ins exceed 25% of weekly capacity, planning becomes theater, and compliance drops below 70% — the threshold where MTBF starts declining measurably.
A 4-week rollout to move from 60% to 90%+ compliance
Moving a plant from reactive to proactive is not a year-long transformation. With a frozen schedule, capacity loading, and daily compliance tracking, measurable improvement shows in four weeks.
Lock the weekly schedule by Thursday 3 PM
Publish the next week's schedule before the current week ends. No additions after freeze except safety-critical or production-down events — and those require a logged reason code and supervisor sign-off. Target: 100% of work scheduled and kitted by Thursday.
Schedule to 80% of available labor capacity
Leave 20% of crew hours for emergent work and carryover. Plants that load to 95%+ guarantee compliance failure — the first 2-hour emergency blows the week. Track available labor hours against scheduled hours daily in the CMMS dashboard.
Measure compliance every day, not every Friday
Daily compliance checks catch slippage while there is still time to recover. A Monday PM pushed to Wednesday is recoverable; a Monday PM discovered missing on Friday is a permanent loss. Review compliance at the 10 AM morning huddle, not the end-of-week report.
Code every missed job with a root-cause category
Parts not ready, asset not released, labor reassigned, scope underestimated, or break-in displacement. After four weeks of reason-coding, 70% of losses cluster into two or three categories — and those become the next quarter's improvement targets.
A 180-asset plant moved from 58% to 91% compliance in one quarter
A mid-sized food packaging plant with 180 assets, 6 technicians, and a CMMS that nobody trusted spent $42K annually on unplanned downtime. Here is what changed when they enforced schedule discipline.
| Metric | Before (Week 0) | After (Week 12) | Impact |
|---|---|---|---|
| Schedule Compliance | 58% | 91% | +33 pts |
| Break-in Work (% of capacity) | 34% | 8% | −26 pts |
| PMs Completed On Time | 61% | 94% | +33 pts |
| Unplanned Downtime (hrs/month) | 47 hrs | 19 hrs | −60% |
| Backlog (work orders aging >30 days) | 112 | 38 | −66% |
| Annualized Downtime Cost | $42,000 | $17,000 | −$25K/yr |
| Wrench Time (hands-on % of shift) | 28% | 41% | +13 pts |
We didn't buy new tools or add headcount. We froze the schedule on Thursday, tracked compliance every morning, and coded every miss. In 12 weeks we cut downtime by 60% — the planning system was already there, we just stopped ignoring it.
Five CMMS controls that protect the schedule automatically
A CMMS only enforces compliance if it is configured to. These five controls — each a standard feature in modern systems — turn the schedule from a suggestion into a contract.
Schedule Freeze Lock
Block new work orders from being added to the active week after the freeze cutoff. Override requires supervisor approval and auto-logs a reason code. Prevents silent scope creep.
Capacity Load Dashboard
Real-time view of scheduled labor hours vs. available capacity, broken down by crew and shift. Alerts when loading exceeds 85%, preventing the overcommitment that guarantees compliance failure.
Daily Compliance Pulse
Automated daily report showing completed vs. scheduled hours, projected week-end compliance, and any job flagged at risk. Delivered to the morning huddle — not buried in a monthly PDF.
Reason-Code Enforcement
Every missed or deferred job requires a reason code before the work order can close. Forces accountability and builds the data set that reveals systemic planning gaps within 30 days.
Kitted-Parts Verification
Work orders cannot be scheduled until parts are confirmed kitted in the storeroom. Eliminates the #1 compliance killer — technicians assigned to jobs with no parts ready, losing 45+ minutes per occurrence.
Tiered PM Compliance Alert
Auto-escalation when any PM slips beyond its grace window (typically 10% of interval). A 30-day PM flagged at day 33 triggers a notification to the reliability lead — not a forgotten entry in next month's audit.
Stop measuring compliance in a spreadsheet. Start enforcing it in your CMMS.
OxMaint freezes the schedule, tracks daily compliance, and codes every miss — so 90%+ becomes the default, not the exception.
Schedule compliance, answered
The five questions plant managers and maintenance leads ask most often when they first start measuring compliance seriously.
What is a good schedule compliance target for manufacturing maintenance?
Top-quartile plants target 90% or higher. Anything above 85% is considered proactive; 60–85% is transitional with visible planning gaps; below 60% is reactive firefighting. The target should be measured weekly — monthly averages hide the bad weeks that drive downtime spikes. Start by measuring honestly for 4 weeks before setting a target, so you know your real baseline.
How is schedule compliance different from schedule adherence?
Compliance measures whether scheduled work was completed within the planned week. Adherence measures whether work was completed on the planned day and time — a stricter metric. A plant can have 90% weekly compliance but only 65% daily adherence, meaning jobs are getting done but not when planned, which disrupts production handoffs and crane bookings. Track both; adherence is the leading indicator of compliance.
Should break-in work be counted against schedule compliance?
Break-ins should be tracked separately but transparently. If you include break-in hours in the denominator, compliance looks healthy but the schedule is fiction. Best practice: report compliance on the frozen schedule only, then report break-in percentage as a companion metric. Target break-ins below 10% of weekly capacity. If break-ins exceed 20%, the schedule is not a schedule — it is a wish list. Start Free Trial to see how OxMaint isolates break-ins automatically.
How do you calculate PM schedule compliance specifically?
PM compliance = (PMs completed within grace period ÷ PMs scheduled) × 100. The grace period is typically 10% of the PM interval — a 30-day PM must be done by day 33, a 90-day PM by day 99. Counting a PM done six months late as "completed" inflates the metric and hides reliability risk. Use the grace-period method exclusively; it aligns PM compliance with actual asset risk exposure.
How long does it take to move from 60% to 90% schedule compliance?
With a frozen weekly schedule, 80% capacity loading, and daily compliance tracking, measurable improvement shows in 4 weeks and sustained 90%+ is achievable in 12 weeks. The bottleneck is rarely the CMMS — it is cultural tolerance for break-ins and the Thursday freeze discipline. Plants that fail usually fail in week 2, when operations pushes back on the freeze. Hold the line through week 4 and the culture shifts. Book a Demo to map your rollout.
Your schedule is already telling you the truth. Are you listening?
Every missed PM, every break-in, every deferred job is a signal. OxMaint turns those signals into a compliance system that holds — week after week, quarter after quarter.
Free 14-day trial · No credit card