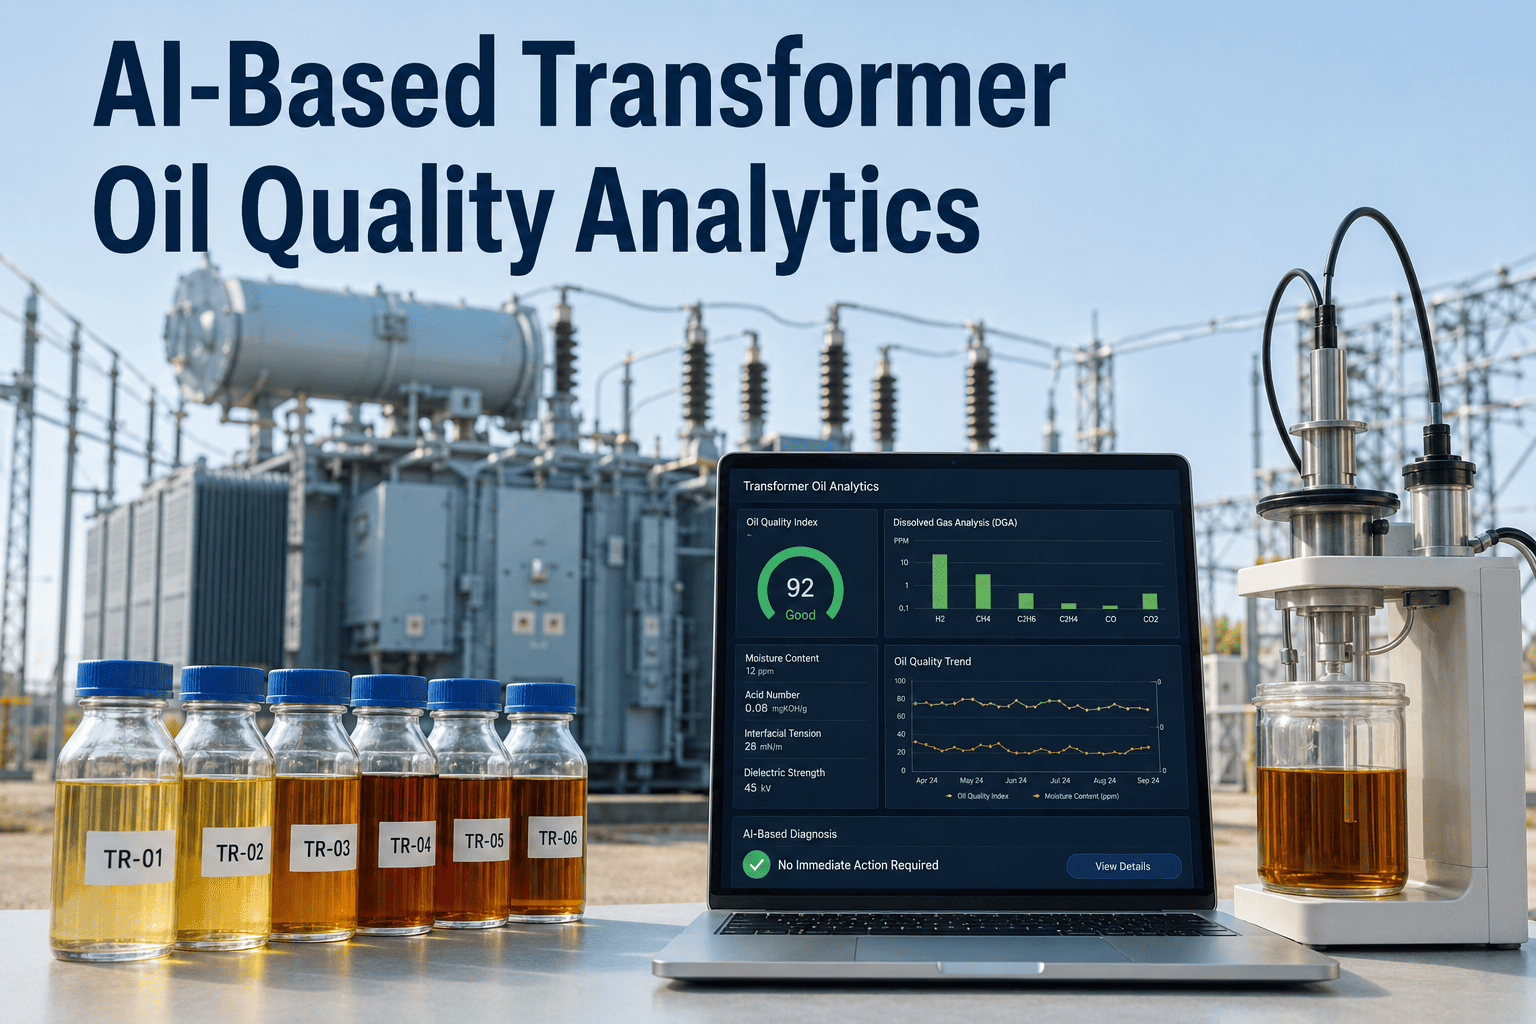
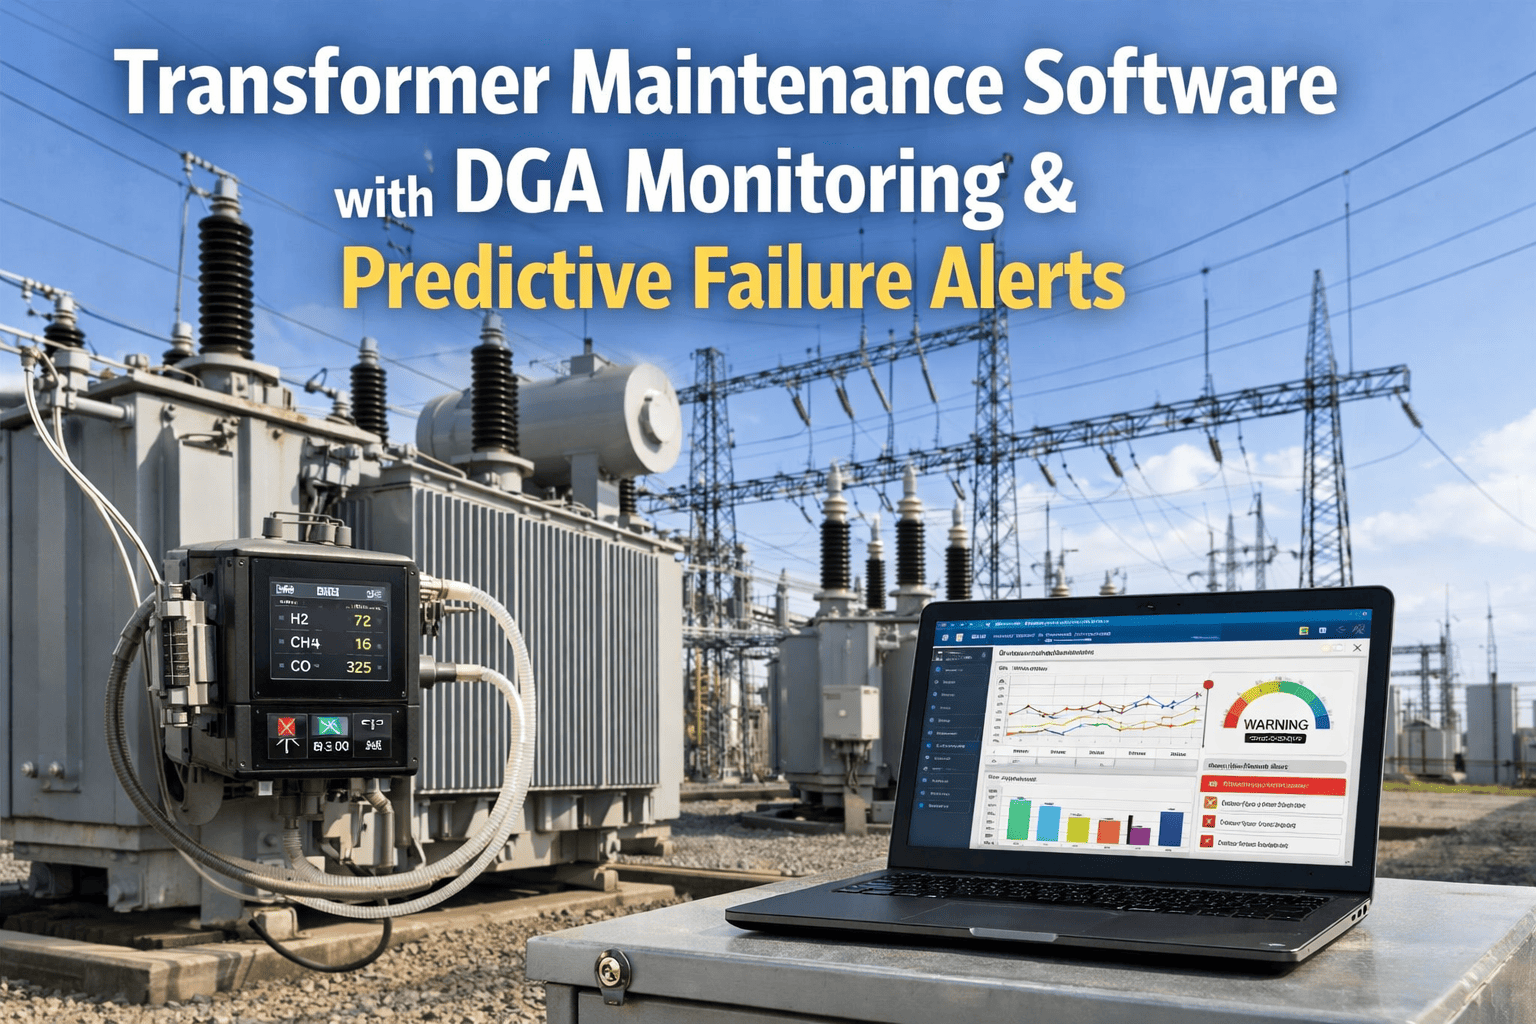
A transformer rarely fails without warning — it fails after months of dissolved gas concentrations climbing quietly inside the oil, invisible to any visual inspection and undetectable without laboratory testing that most utilities still schedule only once or twice a year. By the time a scheduled sample finally catches the problem, the fault that started as a minor hot spot may have already progressed into arcing damage that takes the transformer out of service for weeks. AI-based oil quality analytics closes that blind spot by turning dissolved gas data into a continuously updated early warning system instead of a periodic snapshot. Book a demo to see how continuous DGA analytics catches transformer faults months before a scheduled oil sample would.
OxMaint · Predictive Maintenance · Transformer Systems
Your transformer oil already knows something's wrong. Your sampling schedule just hasn't caught up yet.
AI-based dissolved gas analytics reads the fault signature in your transformer oil continuously, not twice a year — catching thermal and electrical faults while they're still cheap to fix.
The Fault Gases Your Transformer Oil Is Already Producing
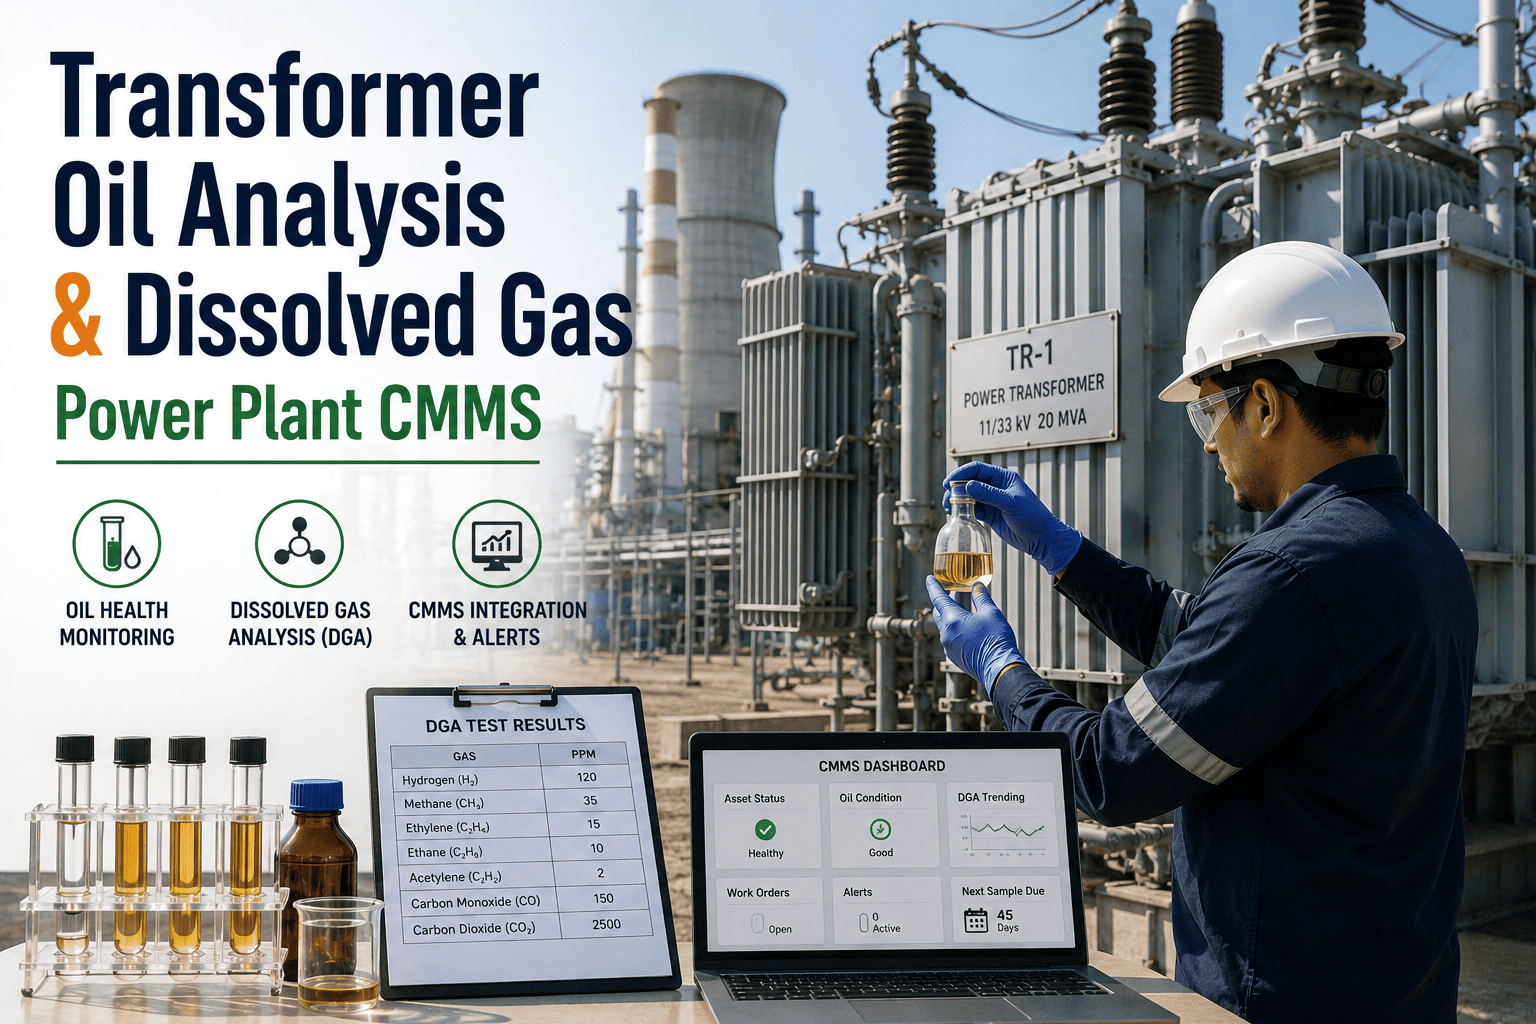
Dissolved gas analysis reads the specific gases released when insulating oil and paper break down under thermal or electrical stress. Each gas points to a different fault mechanism developing inside the tank.
| Dissolved Gas |
Fault Mechanism Indicated |
Typical Progression Speed |
| Hydrogen (H₂) |
Partial discharge or low-energy electrical fault beginning in the insulation system |
Slow to moderate — weeks to months |
| Methane (CH₄) |
Low-temperature thermal fault, often below 300°C, in oil-immersed components |
Slow — often months |
| Ethylene (C₂H₄) |
Higher-temperature thermal fault above 300°C, often winding or lead connection related |
Moderate — several weeks |
| Acetylene (C₂H₂) |
High-energy arcing fault — the most urgent signature in any DGA result |
Fast — days to a few weeks |
| Carbon Monoxide / Dioxide |
Cellulose insulation paper degradation from prolonged thermal stress |
Very slow — accumulates over years |
Scroll right to view full table on mobile
How a Transformer Fault Progresses Without Continuous Monitoring
Most transformer failures follow a predictable progression. The problem is not that the fault is unpredictable — it's that twice-yearly sampling only catches it once it has already reached a costly stage.
Stage 1
Early Hot Spot Formation
A loose connection, circulating current, or localized overload begins generating low levels of hydrogen and methane. At this stage, repair is typically limited to a targeted connection tightening or minor intervention.
Stage 2
Thermal Fault Escalation
Without correction, the hot spot temperature rises, ethylene concentration increases, and surrounding insulation paper begins accelerated aging — the point at which the fault becomes visible on a scheduled DGA sample, if the timing happens to align.
Stage 3
Arcing Onset
Acetylene appears as the fault crosses into arcing territory. At this stage, internal damage is likely already occurring, and the repair scope shifts from a minor intervention to a major internal inspection or rewind.
Stage 4
Catastrophic Failure Risk
Continued arcing can lead to insulation breakdown, tank pressure events, and complete transformer loss — the outcome that continuous DGA monitoring exists specifically to prevent by intervening at Stage 1 or Stage 2.
A twice-yearly oil sample only tells you where the fault stood on the day it was drawn. AI-based continuous analytics tells you where it stands right now, and how fast it's moving.
What AI-Based Oil Quality Analytics Actually Monitors
Beyond the core fault gases, a complete oil quality analytics program tracks a broader set of parameters that together build a far more reliable picture of transformer health.
Gas Concentration Rate of Change
The AI model tracks how fast each gas concentration is rising, not just its absolute value — a slow steady rise and a sudden spike indicate very different urgency levels even at the same concentration.
Gas Ratio Fault Typing
Established ratio methods compare relative gas concentrations to classify the fault type — thermal, low-energy discharge, or high-energy arcing — refining the diagnosis beyond a single-gas alarm.
Moisture and Furan Content
Moisture in oil accelerates insulation aging and reduces dielectric strength, while furan compounds correlate directly with cellulose paper degradation — both tracked as leading indicators of remaining insulation life.
Load and Temperature Correlation
Gas generation rates are cross-referenced against loading and ambient temperature history, distinguishing a genuine developing fault from a temporary reading shift caused by a heavy load period.
How AI Improves on Traditional DGA Interpretation Methods
Manual DGA interpretation has relied on established ratio methods for decades. AI-based analytics doesn't replace these methods — it applies them continuously and cross-checks them against each other automatically.
Duval Triangle and Pentagon Methods
These graphical methods plot relative concentrations of key gases to classify fault type. The AI model applies them automatically on every new data point instead of waiting for an engineer to manually plot the latest lab result.
Rogers and IEC Ratio Methods
Classic ratio-based fault classification is run in parallel with the Duval methods, and disagreements between methods are flagged for engineering review rather than silently resolved by picking one result.
Key Gas Method Cross-Validation
The dominant gas approach is layered on top as a sanity check, so a single anomalous reading doesn't trigger a false alarm without corroboration from at least one other interpretation method.
Historical Fleet Pattern Matching
Beyond standard methods, the AI model compares your transformer's gas trend shape against failure patterns observed across similar transformers in the broader fleet, adding a data-driven confidence layer standard methods can't provide alone.
Frequently Asked Questions — AI-Based Transformer Oil Quality Analytics
OxMaint · Predictive Maintenance · Transformer Systems
Don't wait for the next scheduled sample to find out what your transformer already knows.
Continuous gas trend monitoring. AI fault typing. Moisture and furan tracking. Load-correlated risk alerts — built to catch transformer faults months before they become outages.