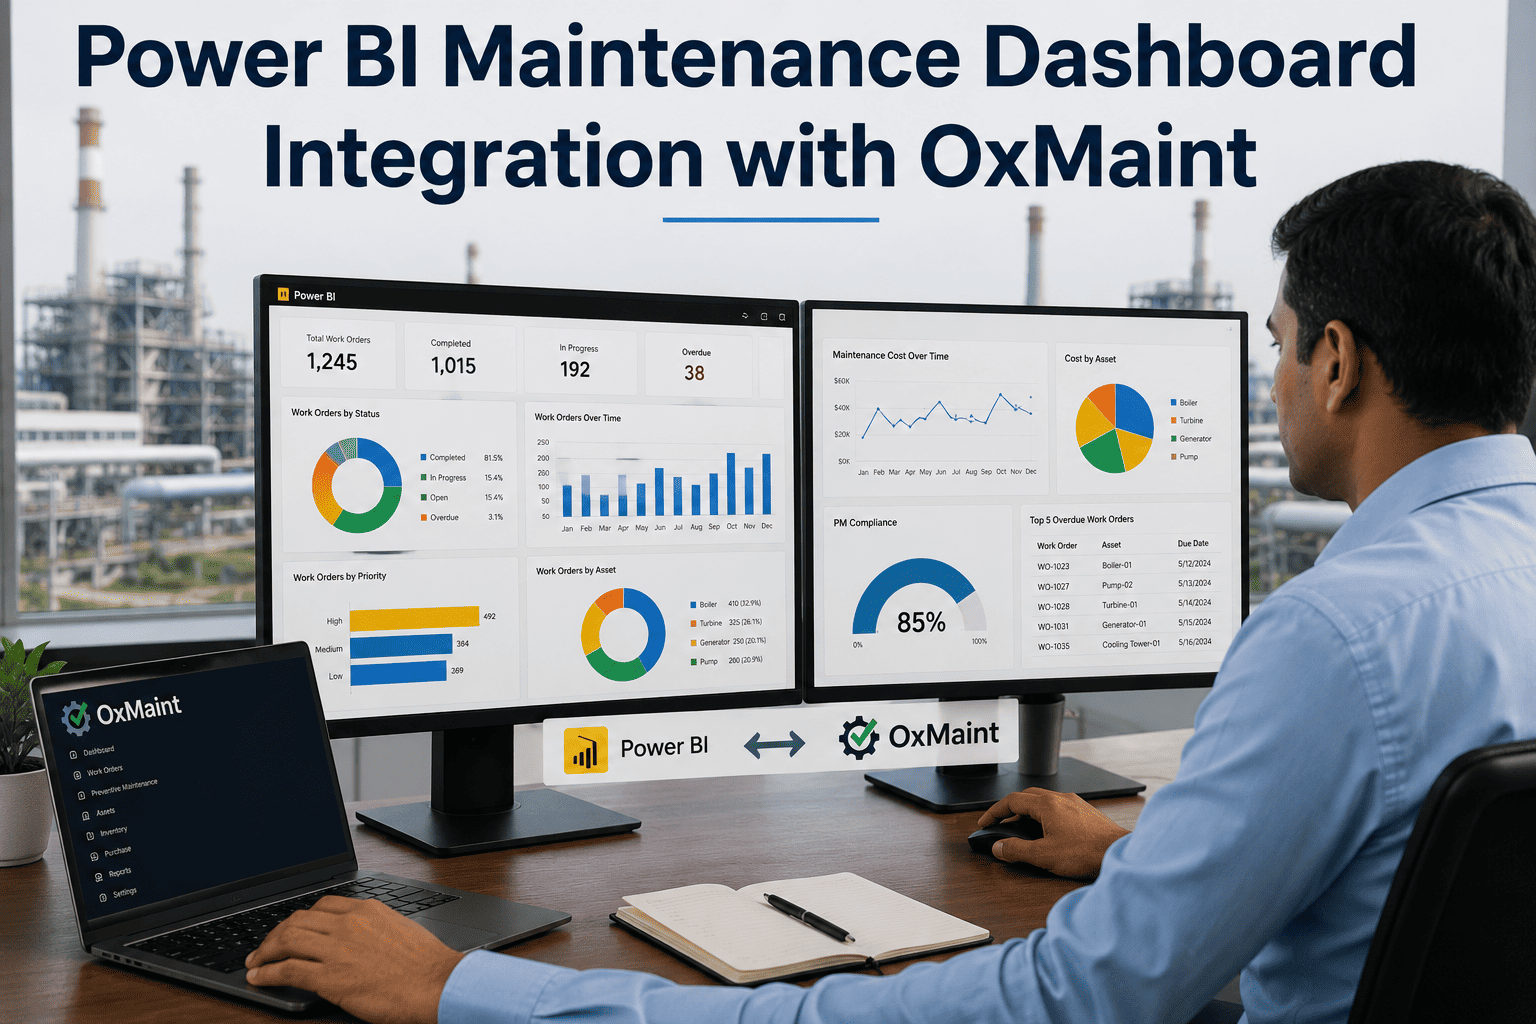
Most plant leaders do not lack maintenance data — they lack maintenance data they can trust on demand. The work orders live in the CMMS, the costs sit in the ERP, runtime is buried in SCADA, and PM compliance hides in a spreadsheet someone updates monthly when they remember. So when a VP asks why costs jumped 18% while reliability fell, the answer takes three days and two engineers to assemble, and it is already weeks out of date. Connecting OxMaint to Power BI ends that. Your CMMS becomes the single source of truth, Power BI becomes the visualization layer, and a connector keeps the picture current — every metric updating as work orders close. This page explains how the OxMaint and Power BI integration is built and what it puts in front of every role.
1 afternoon
Typical time to stand up a working pipeline when the CMMS is structured for it — not the weeks of data engineering teams expect
47%
Of maintenance teams spend more time moving data between systems than actually managing maintenance
Real-time
Dashboards refresh on the schedule you set — hourly for operations, daily for executive views — no CSV exports
Enterprise Integrations · BI Reporting
Stop Reporting Yesterday's Numbers. Put Live Maintenance KPIs in Power BI.
OxMaint exposes work orders, assets, parts, and cost data to Power BI through a read-only SQL connector and REST or GraphQL APIs — no middleware, no manual exports. MTBF, MTTR, PM compliance, and cost metrics refresh automatically as your team closes tickets.
The Five Layers From Work Order to Dashboard
A Power BI maintenance dashboard is not a single connection — it is a stack, and each layer has one job. The data is captured once in OxMaint, exposed cleanly to Power BI, modeled into trustworthy metrics, refreshed on a schedule, and delivered to the right screen. Skip a layer and you get the same problem you started with: good-looking charts built on numbers nobody believes. The stack below is what turns raw work-order activity into a dashboard people actually open twice.
L1
Source of Truth — OxMaint CMMS
Every work order opened and closed, part issued, labor hour logged, asset created, and PM scheduled lives in OxMaint. No parallel spreadsheets, no shadow databases — one authoritative record that technicians write to from mobile in real time.
▼
L2
Connection — SQL, REST & GraphQL
A read-only SQL connector or API exposes the work-order, asset, parts, and cost tables to Power BI. Power BI Desktop adds the source like any other database via ODBC — no custom middleware, no ETL platform, with token-based access controlled in OxMaint admin settings.
▼
L3
Semantic Model — DAX Measures
Tables are joined into a model where MTTR, MTBF, PM compliance, availability, and cost are defined once in DAX and reused everywhere. One definition per metric becomes the canonical source for every report the organization builds going forward.
▼
L4
Refresh — Scheduled & On-Demand
Power BI Service refreshes the dataset on the cadence you choose — hourly for operational dashboards, daily for executive views. The CMMS keeps writing as work orders close; the dashboard reflects the new state at the next refresh window.
▼
L5
Delivery — Every Role, Every Device
Share via Power BI workspaces, embed in Teams, push mobile views to supervisors, or pin executive scorecards to the Power BI app. The same data flows everywhere, governed by one role-level security model so each site sees only its own numbers.
The KPIs Worth Putting on the Wall
A dashboard with 40 widgets is a dashboard nobody opens twice. The discipline is choosing what to surface — and OxMaint computes each of these automatically as work orders close, so they arrive in Power BI already calculated rather than reconstructed from raw rows. Below is the minimum viable set for power plant maintenance, the metrics where every leader from CFO to crew leader can find the number that drives their decision.
MTBF
Mean Time Between Failures
The reliability headline, tracked per asset class. Rising MTBF means PM is working; a declining trend signals degradation before failure. World-class utility turbines run 2,000+ hours.
MTTR
Mean Time To Repair
Speed of recovery, auto-calculated from work-order open and close timestamps. Below 4 hours for critical equipment is world-class; high MTTR usually points to parts or diagnostic delay, not skill.
Availability
Asset Uptime
The metric your generation manager cares about. A turbine above 99% availability is profitable; below 90% it consumes margin every shift. Combines MTBF and MTTR into one percentage.
PM Compliance
Planned vs Scheduled
The leading indicator most tightly correlated with MTBF improvement over 6–12 months. Below 70% means firefighting; above 90% means maintenance is controlled and budgetable.
OEE
Overall Equipment Effectiveness
Availability, performance, and quality in one score. Most plants run 60–70%; world-class is 85%+. Each point at a 200 MW plant maps directly to generation revenue.
Cost / Hour
Cost Per Operating Hour
Normalizes spend against actual runtime. Rising cost per hour even when total spend is flat is an early warning of asset deterioration or PM slippage before failures appear.
Computed Automatically
Every Work Order Closure Is a Live KPI Update
OxMaint calculates MTBF, MTTR, PM compliance, availability, and cost-per-hour from the work orders your technicians close on mobile — then streams them to Power BI on your refresh schedule. Replace the three-day reliability report with a dashboard that is always current.
One Data Core, Four Dashboard Tiers
The fastest way to kill a dashboard rollout is to show everyone the same screen. A technician drowning in fleet-wide cost trends and a VP staring at a single work queue both stop opening the dashboard. OxMaint serves role-based views from one underlying dataset, so each audience sees only the metrics that drive their decisions — governed by the same security model and the same metric definitions.
Technician
Sees: today's work queue and scheduled PMs
A focused task list on mobile — what to do next, which parts are staged, and where. No portfolio noise, just the work in front of them.
Supervisor
Sees: team productivity and backlog
Wrench time, open-versus-completed work orders, and backlog trend for the crew — the operational picture for balancing resources across a shift.
Plant Manager
Sees: site KPIs and reliability trends
MTBF, MTTR, PM compliance, and availability for the plant — the reliability scorecard that exposes which asset class is drifting before it becomes an outage.
VP / Executive
Sees: fleet-wide portfolio trends
One semantic model, one definition per metric, every plant ranked side by side — so capital allocation is driven by benchmarks instead of gut feel.
Why a Connector Beats a CSV Export
Plenty of CMMS platforms can technically feed Power BI — you export a CSV, import it, and hope the numbers hold. The difference between that and a real integration is whether the data is live, governed, and trusted. The comparison below shows what changes when OxMaint connects directly instead of dumping files.
| Dimension | Manual CSV / Spreadsheet | OxMaint Power BI Connector |
| Freshness |
As old as the last export someone remembered to run |
Refreshes automatically on your schedule |
| Metric definitions |
Recalculated differently in every workbook |
Defined once in DAX, reused everywhere |
| Effort |
Recurring manual export, cleanup, and consolidation |
Configured once, then hands-off |
| Trust |
"The real numbers are in someone's tracker" |
One source of truth straight from the CMMS |
| Multi-site |
Six plants report six different ways |
Fleet-wide ranking from one model |
| Resilience |
A missed export is a gap in the record |
Queued with retry; sync errors flagged with timestamps |
"We were producing a monthly reliability report that took two engineers three days to compile from SAP, the historian, and spreadsheets — and the numbers were already weeks old by the time they reached the operations manager. A live dashboard replaced it. Within the first month we caught a deviation trend on Unit 2 that had been building for nine weeks, completely invisible in the monthly report because it was gradual."
— Reliability Lead, Combined-Cycle Generation Plant
Frequently Asked Questions
Q1How does OxMaint actually connect to Power BI — do we need to build a custom pipeline?
No custom pipeline is needed. OxMaint exposes its work-order, asset, parts, and cost tables through a read-only SQL connector and REST and GraphQL API endpoints, and Power BI Desktop adds the source like any other database using the standard ODBC approach. Authentication is token-based and controlled in OxMaint's admin settings, so there is no middleware, no ETL platform, and no thousands of lines of code. Most teams expect weeks of data-engineering work, but when the CMMS is structured for it a working pipeline is configurable in a single afternoon.
Book a demo to see the connection built against sample data.
Q2Which KPIs can the dashboard show, and are they calculated for us?
OxMaint computes the core maintenance metrics automatically as work orders close, so they reach Power BI already calculated rather than reconstructed from raw rows. The standard set includes MTBF and MTTR per asset class, PM compliance, asset availability, OEE, emergency work-order rate, and cost per operating hour. MTTR auto-calculates from work-order open and close timestamps, MTBF rolls up from confirmed failure events, and PM compliance comes from scheduled-versus-completed PMs. You choose which to surface, and a sensible starting point is the big three — PM compliance, MTTR, and planned-to-reactive ratio — adding the rest once your work-order data is clean.
Q3How current is the data, and can different roles see different views?
Power BI Service refreshes the dataset on a cadence you control — hourly for operational dashboards and daily for executive scorecards are common choices. The CMMS keeps writing data as work orders close, and the dashboard reflects the new state at the next refresh window, so there are no manual exports between updates. Role-based views come from the same underlying dataset: a technician sees their work queue, a supervisor sees team productivity, a plant manager sees site reliability KPIs, and a VP sees fleet-wide trends. One data core, one set of metric definitions, governed by a single role-level security model.
Q4Can we combine data from multiple plants into one fleet dashboard?
Yes, and this is where the integration pays off most. When six plants each report KPIs their own way, fleet headquarters cannot benchmark and capital allocation becomes guesswork. With OxMaint feeding Power BI, a single semantic model defines each metric once and every site is ranked side by side in one view, refreshed automatically. Role-level security still ensures each plant team sees only its own detailed data while leadership sees the consolidated portfolio. That shift from six inconsistent reports to one governed model is what makes fleet-wide reliability and cost benchmarking possible.
Start a free trial to model it against your sites.
Q5What happens to the data if the integration connection drops temporarily?
Nothing is lost. OxMaint queues all outbound data during a connection interruption and retries delivery with exponential backoff, so once the link restores the queued events replay in sequence — no work order, cost record, or sensor alert disappears. An integration health dashboard flags any sync errors with timestamps, so your team can see exactly what was affected and when rather than guessing whether a refresh succeeded. This resilience is a core difference between a real connector and a scheduled CSV dump, where a single missed export leaves a permanent gap in the record. Your dashboards stay trustworthy even when the network is not.
Enterprise Integrations · BI Reporting
Turn Your Work Orders Into Live Power BI Dashboards
Connect OxMaint to Power BI and give every role — technician to VP — a dashboard that updates as the work happens. See the connector and a sample KPI model running live.