Most condition monitoring programs do not fail because the technology is wrong — they fail because the rollout skips the criticality audit, chases every asset at once, and ends up with sensor data that nobody trusts, reviews, or acts on. Building a condition monitoring program the right way at a power plant means five honest decisions made in the right order: which assets deserve continuous coverage, which monitoring technique matches which failure mode, how the data gets from the sensor to a work order, who owns the alert response, and how you prove ROI to the CFO within the first 120 days. Get those five decisions right and your program pays for itself before year one closes — get them wrong and you join the 60 percent of programs that plateau at 30 to 40 percent of their potential value. This guide walks you through the exact sequence, with Oxmaint CMMS condition monitoring templates built in so nothing gets lost between the sensor and the work order.
The Stakes
Why Most Power Plants Already Have Sensors — And Still Can't Prevent Forced Outages
Almost every modern power plant is already collecting condition data. SCADA historians store vibration trends, DCS logs bearing temperatures, insurance surveys capture infrared images, and oil labs return sample reports. The data exists. What's missing is the connective tissue that turns signals into scheduled, tracked, accountable maintenance actions. That gap is where forced outages happen.
$100K+
Lost generation revenue per hour of unplanned forced outage on a mid-size thermal unit
70-75%
Reduction in equipment breakdowns achievable with a properly implemented CBM program
12-18 mo
Typical payback period on a well-planned condition monitoring program
10:1 to 30:1
ROI range reported by organizations with mature CM programs and disciplined execution
The Framework
The Five-Phase Rollout That Separates Successful Programs From Stalled Ones
A condition monitoring program is not a software purchase — it is a phased organizational change effort that happens over 6 to 12 months. The sequence below is derived from IAEA implementation guidance, Bently Nevada's nine-step playbook, and real deployment data across power generation sites. Skip a phase and the program stalls; follow it in order and the program compounds.
Weeks 1-3
Criticality Audit and Asset Classification
Rank every rotating and electrical asset on a 4-tier criticality scale. Category A assets — boilers, main turbines, generators, feedwater pumps, GTs — get continuous online monitoring. Category B gets walk-around portable data collection. Category C runs on calendar PM. Category D is run-to-failure. This single decision determines 80 percent of program ROI.
Deliverable: Ranked asset register with criticality tier
Weeks 4-6
Failure Mode Mapping and Technique Selection
For each Category A asset, list the 3 to 5 most likely failure modes from FMEA or historical records. Then match each failure mode to the detection technique that catches it earliest — vibration for bearing wear, thermography for electrical degradation, oil analysis for gearbox wear, ultrasound for leaks and arcing, partial discharge for winding insulation. One asset often needs two or three techniques running in parallel.
Deliverable: Failure mode to technique mapping matrix
Weeks 7-12
Baseline Data Capture and Threshold Definition
Before any alert can mean anything, every monitored point needs a known-good baseline — vibration signature at full load, normal bearing temperature profile, expected oil viscosity range, typical IR value. Baselines are captured over 4 to 8 weeks of varied operating conditions. Alert thresholds are then set at ISO standard warning and alarm levels, not at factory defaults.
Deliverable: Documented baselines and threshold registers per asset
Weeks 13-20
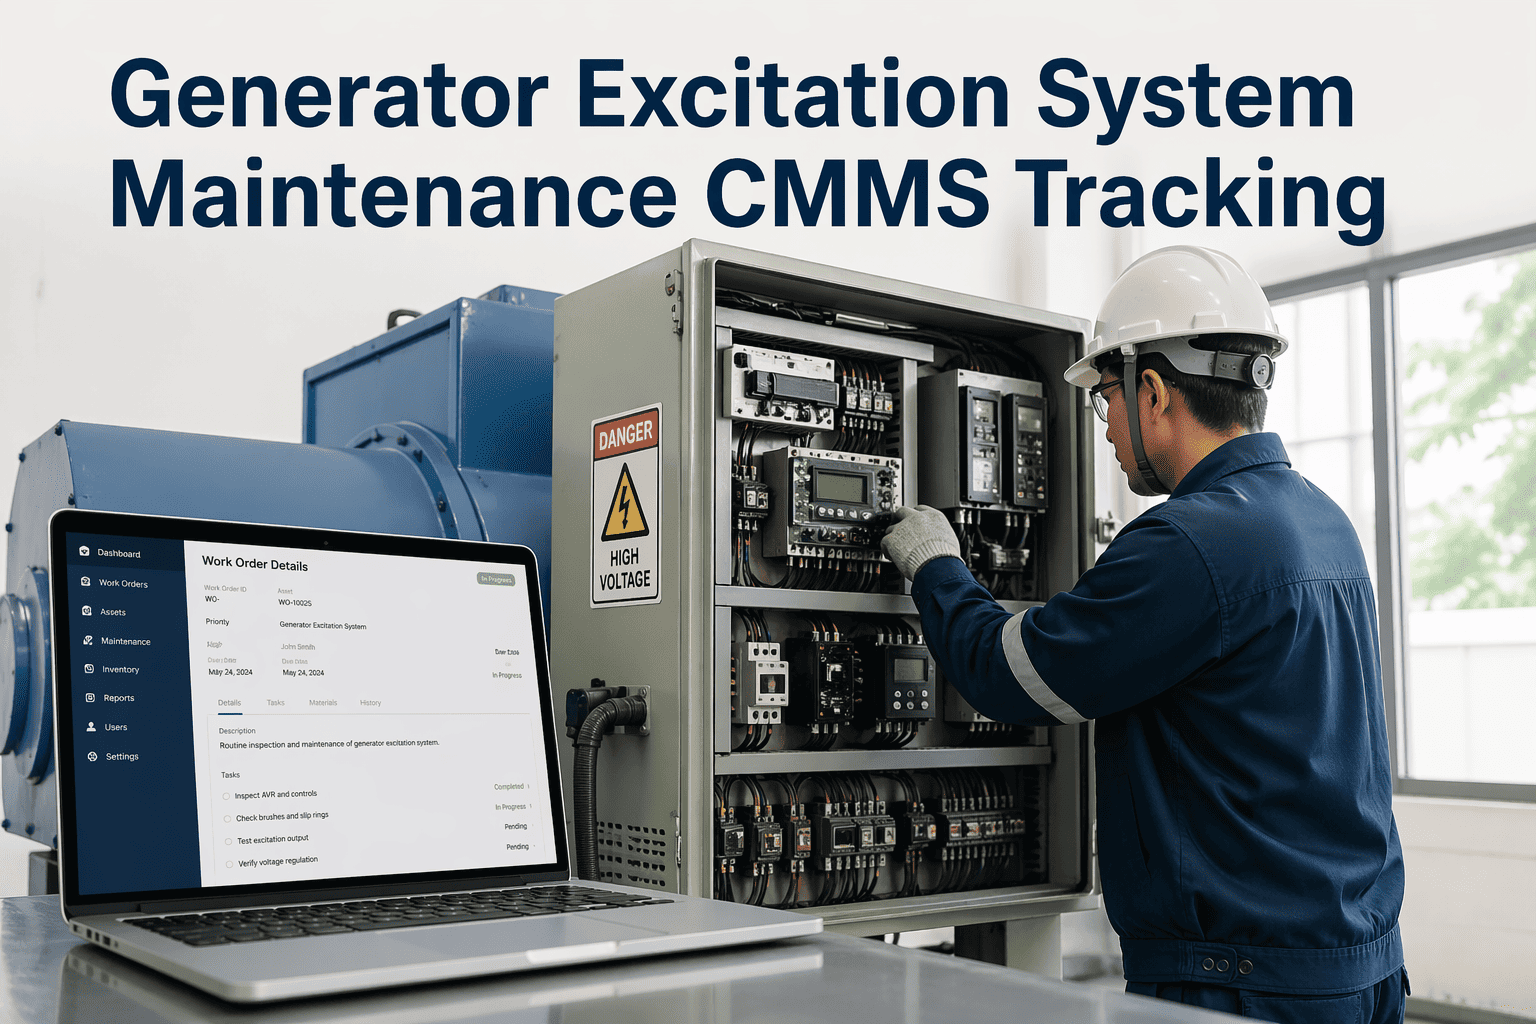
CMMS Integration and Alert Response Protocol
Every threshold breach must auto-generate a CMMS work order with the asset ID, the exceeded parameter, the responsible craft discipline, and the response window — otherwise alerts sit in email inboxes and nothing happens. The alert response protocol, agreed between operations and maintenance before go-live, is the single biggest predictor of whether the program delivers value. Oxmaint supports auto-routing from sensor input to assigned work order in under 60 seconds.
Deliverable: CMMS rules, routing logic, response RACI
Weeks 21+
Interception Documentation and ROI Reporting
Every predicted failure that was caught and fixed before it caused downtime is logged as a formal interception event — with the estimated avoided outage cost attached. Within 120 days, most plants have 3 to 6 documented interceptions, which gives finance auditable evidence of program value and justifies expansion into Category B assets and additional monitoring techniques.
Deliverable: Interception register, ROI dashboard, expansion plan
Accelerate Your Rollout
Build Your Condition Monitoring Program Without Starting From a Blank Page
Oxmaint CMMS ships with power plant asset hierarchies, pre-built monitoring work order templates, ISO-aligned vibration thresholds, and interception tracking — so your team skips 60 percent of the setup work and goes from kick-off to first documented save in under 120 days.
Asset Criticality
The Criticality Pyramid: Where to Put Your Sensor Budget First
Not every asset deserves continuous online monitoring. Budget and bandwidth make that impossible, and the economics do not support it. The criticality pyramid is the single most useful visualization for explaining to plant leadership why the sensor budget goes where it goes. Assets at the top get continuous monitoring; assets at the bottom get route-based or calendar PM; the middle gets a mix based on ROI math done during phase one.
Main turbine, generator, boiler feedwater pumps, ID/FD fans, GT compressor, step-up transformer
Continuous online monitoring
~15% of assets
Condensate pumps, cooling water pumps, circulating fans, medium-voltage motors, auxiliary transformers
Monthly route-based portable collection
~30% of assets
Service water pumps, HVAC blowers, lighting transformers, small compressed air units
Quarterly inspection plus calendar PM
~40% of assets
Redundant utility fans, spare motors, low-consequence isolated equipment
Run to failure, replace on breakdown
~15% of assets
The Category A band captures roughly 15 percent of assets but accounts for over 80 percent of outage risk — which is why it earns the lion's share of sensor capex. Oxmaint's asset register supports native criticality tagging and lets reliability engineers filter work orders, alerts, and trends by tier so the Category A fleet is always visible as a managed cohort.
Technique Selection
Matching Monitoring Techniques to Failure Modes
No single technique catches every failure mode. Vibration dominates rotating equipment diagnostics, thermography owns electrical infrastructure, oil analysis reveals what is happening inside lubricated assemblies, ultrasound hears what other techniques miss, and partial discharge tracks winding insulation aging. The matrix below shows which technique detects which failure mode across the Category A power plant asset fleet.
| Asset / Failure Mode |
Vibration |
Thermography |
Oil Analysis |
Ultrasound |
Partial Discharge |
| Feedwater pump bearing wear |
Primary |
Supporting |
Supporting |
- |
- |
| Turbine shaft misalignment |
Primary |
- |
Supporting |
- |
- |
| Generator winding insulation |
- |
Supporting |
- |
- |
Primary |
| MCC connection hotspots |
- |
Primary |
- |
Supporting |
- |
| Gearbox wear particles |
Supporting |
- |
Primary |
- |
- |
| Steam trap leakage |
- |
Supporting |
- |
Primary |
- |
| Transformer oil degradation |
- |
Supporting |
Primary |
- |
Supporting |
| Switchgear arcing fault |
- |
Supporting |
- |
Primary |
Supporting |
Data Flow
From Sensor Reading to Closed Work Order — The Data Pipeline That Makes or Breaks the Program
The single biggest predictor of whether a condition monitoring program creates value is not the sensor quality — it is whether a threshold breach reliably, automatically, and quickly becomes a tracked maintenance action. Programs that stop at "alert on a dashboard" rarely deliver ROI. Programs that close the loop from reading to work order to interception log deliver 10:1 returns or better.
1
Sensor Capture
Online sensor or route-based collector records vibration, temperature, pressure, or spectral data against the asset tag.
›
2
Threshold Check
Reading is compared against the asset's ISO or custom alert and alarm threshold. Warning and alarm levels trigger different routing.
›
3
CMMS Auto-WO
Work order auto-generates with asset ID, measured value, threshold exceeded, responsible craft, and target response window.
›
4
Craft Response
Assigned technician inspects, confirms or rejects the finding, performs corrective action, and closes the work order with findings recorded.
›
5
Interception Log
Confirmed early catches are logged as interceptions with estimated avoided cost — feeding the ROI dashboard the CFO reviews quarterly.
This five-step pipeline is the operating system of a real condition monitoring program. Skip step three and alerts pile up in email; skip step five and finance never sees the program's value. Book a walkthrough to see how Oxmaint wires the full pipeline against your existing historian and SCADA data.
Common Failure Points
Where Condition Monitoring Programs Actually Break Down
The most instructive way to build a strong program is to study the ways real programs fail. Across power plant deployments, five failure modes account for almost every stalled or underperforming rollout. Designing around these upfront is more useful than benchmarking against ideal cases.
Scope Creep on Day One
Teams try to instrument the entire plant in the first phase. Budget runs out, installation stretches across months, nothing goes live in time, and leadership loses patience. Fix: start with the 3 most failure-consequential Category A assets only.
No Baseline Before Alerts
Sensors go live using factory default thresholds, which generate dozens of false alerts in the first week. Technicians learn to ignore the system and the program dies of alert fatigue. Fix: run 4 to 8 weeks of baseline capture before any alert is acted on.
Dirty Historical Data
CMMS failure codes are inconsistent or missing. Anomaly detection models cannot distinguish a bearing fault from an impeller imbalance. Fix: invest 2 to 3 weeks in cleaning and standardizing CMMS failure codes before APM go-live — accuracy improves 40 percent.
No Written Alert Response
When an alarm fires, nobody is clearly on the hook to respond inside a defined window. Alerts sit. By the time they are reviewed, the failure has already occurred. Fix: write a response RACI and target time for every alert severity before go-live.
Undocumented Interceptions
Early catches happen but are not formally logged with avoided cost estimates. When finance reviews the program at year-end, there is no auditable evidence of value — and the budget gets cut. Fix: log every interception as a CMMS event with estimated avoided outage cost.
Technique Mismatch
A single technique is applied to assets whose dominant failure modes need something else. Vibration sensors on a transformer catch nothing useful; thermography on a gearbox misses wear. Fix: use the failure-mode-to-technique matrix before buying any sensor.
Success Metrics
The KPIs That Prove the Program Is Working
Within the first 120 days, leadership will ask: "Is this program working?" The answer has to be in numbers, not narratives. These five KPIs, tracked monthly in CMMS, give both the maintenance team and plant leadership a clear, defensible view of program performance from week one.
Alerts per month
Total threshold breaches across all monitored assets — tracks system sensitivity and baseline accuracy
True positive rate
Share of alerts that were confirmed real findings on inspection — target above 70% after baseline tuning
Response time to alert
Median hours from threshold breach to technician inspection — target under 24 hours for Category A assets
Interceptions per quarter
Confirmed early catches logged in CMMS with avoided cost — the program's direct ROI evidence
Forced outage rate
EFOR before and after program launch — trending over 6 to 12 months tells the real story
Maintenance cost ratio
Reactive vs planned maintenance cost split — mature CBM programs shift to 70%+ planned work
Frequently Asked Questions
Condition Monitoring Program Setup: Common Questions Answered
How long does a typical condition monitoring program take to go live?
A focused rollout covering 3 to 5 Category A assets typically takes 16 to 20 weeks from kickoff to first documented interception. Full plant coverage across Categories A and B takes 9 to 12 months.
Oxmaint's pre-built power plant templates shave 4 to 6 weeks off the total timeline.
Do we need to buy new sensors everywhere before we start?
No. Most plants already have enough SCADA historian and DCS data to start on Category A assets with zero new sensor spend. New wireless sensors get added selectively for monitoring points that existing systems do not cover — typically only 20 to 30 percent of target assets need retrofits.
What is the minimum team size to run a condition monitoring program?
At minimum: one reliability engineer as program owner, two trained analysts for vibration and thermography, and clear links into the existing planning and scheduling team. Starter programs at small plants have been run with one dedicated analyst plus CMMS integration.
Book a scoping call to right-size your team.
How do we calculate ROI on a CM program before committing budget?
Multiply your plant's average forced outage hours per year by your generation revenue per hour, then assume the program prevents 30 to 40 percent of those in year one. That is typically 5 to 15 times the annual program cost. A single avoided forced outage usually covers the full year one budget.
What is the difference between condition-based and predictive maintenance?
CBM triggers maintenance when a measured parameter crosses a threshold. Predictive maintenance uses ML models on historical data to forecast when failure will occur before any threshold is crossed. CBM is the data foundation; predictive is the intelligence layer built on top. Most plants start with CBM and graduate to predictive over 12 to 24 months.
Should alerts bypass the CMMS and go straight to technicians via text or email?
No — that is the single most common structural mistake. Alerts must generate a CMMS work order first, then optionally notify via channel. Without a work order, there is no tracking, no response time measurement, no interception log, and no auditable program.
Start With The Right Foundation
Turn Sensor Data Into Scheduled, Tracked, Accountable Maintenance
Oxmaint CMMS gives your reliability team the asset hierarchy, threshold-triggered work orders, interception logging, and ROI dashboard that a condition monitoring program needs to deliver value from phase one. Pre-built power plant templates, criticality-based routing, and operating-hour triggers work out of the box — no months of configuration before your first save.