Power plant operators investing in predictive maintenance technology face a consistent question from finance teams and plant directors: what is the measurable return? Answering that question requires more than vendor claims — it requires a structured model that accounts for your plant's specific failure history, downtime costs, maintenance labour spend, and generation losses. This AI Maintenance ROI Calculator provides a transparent, parameter-driven framework that facility managers and reliability engineers can use to build a defensible business case for predictive maintenance investment — using their own plant data, not industry averages. Book a demo to see how OxMaint's Analytics platform tracks actual maintenance savings in real-time so your ROI calculation becomes a live reporting dashboard, not a one-time estimate.
Analytics & Reporting · Power Generation · Cost Optimization
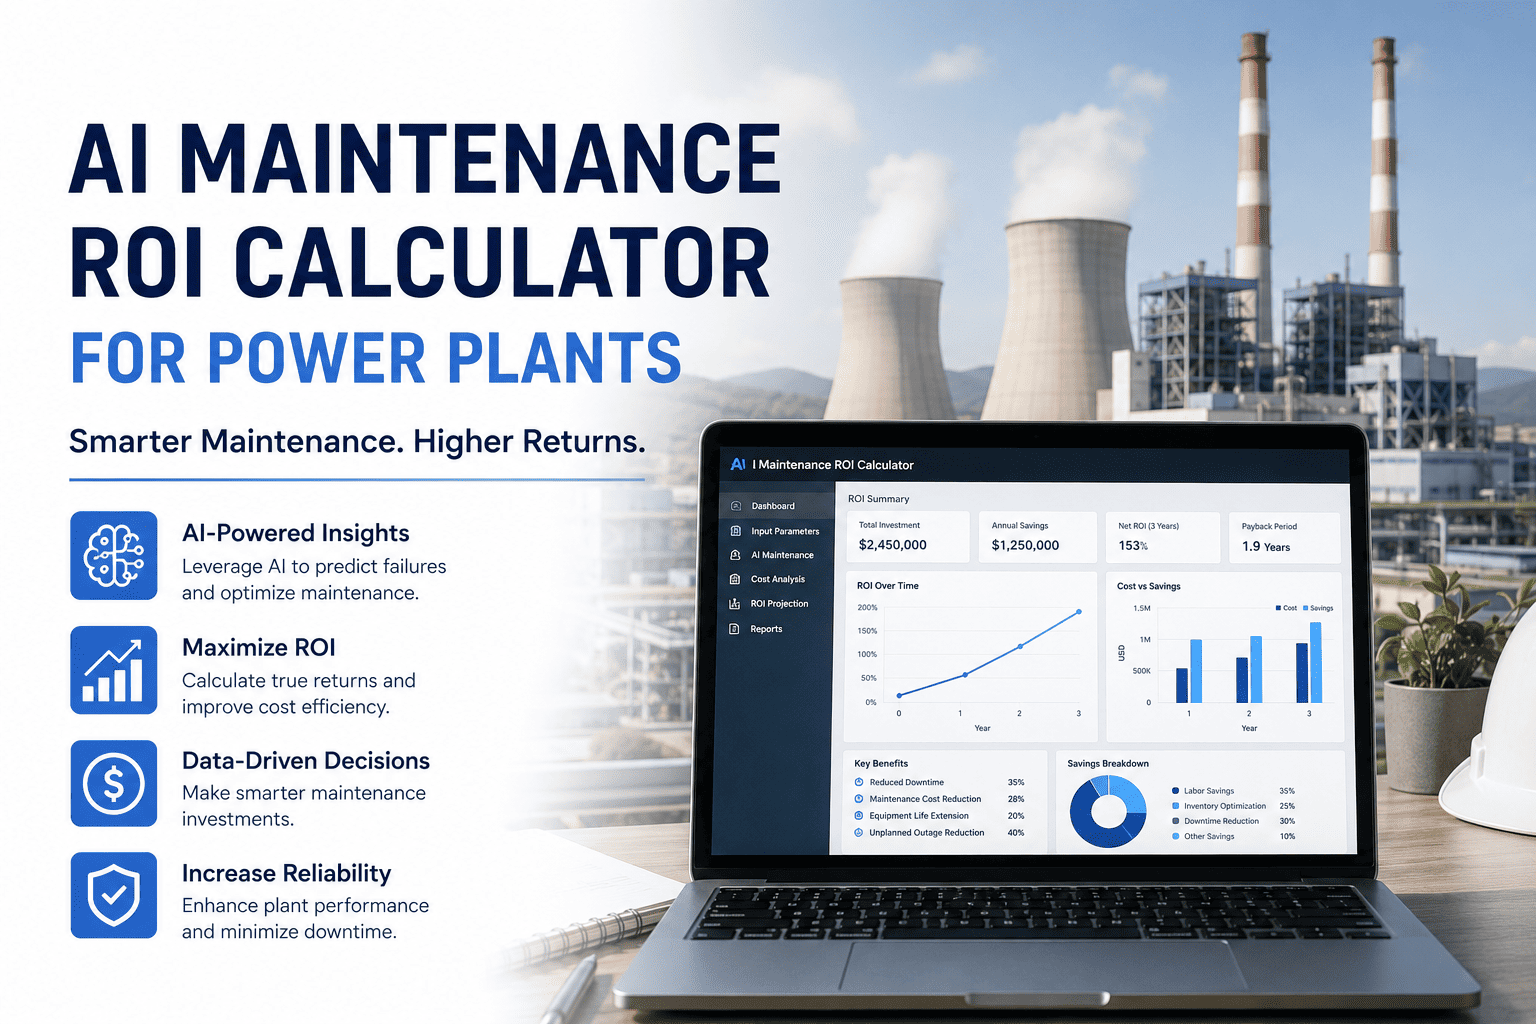
AI Maintenance ROI Calculator for Power Plants
A structured framework for calculating predictive maintenance ROI, downtime cost reduction, and total cost savings — built for reliability engineers and plant directors who need a defensible number, not a marketing estimate.
$260K–$1.5M
Average annual savings per plant unit from predictive vs reactive maintenance
18–24 months
Typical payback period for a full predictive monitoring deployment
35–45%
Reduction in maintenance labour costs achievable through AI-optimized scheduling
3–8×
Return on investment ratio reported by utility operators in year 2 and beyond
The Framework
The Five Cost Categories That Determine Your Maintenance ROI
Most ROI models for predictive maintenance focus only on equipment repair savings. A complete calculation requires five cost categories — each of which changes measurably when you move from reactive to predictive. Missing even one category understates your actual ROI by 30–60%.
01
Unplanned Downtime Cost
Lost generation revenue per hour × hours of unplanned downtime annually. This is typically the largest ROI driver. A single turbine trip at a $50/MWh power price on a 200 MW unit costs $10,000 per hour of lost generation.
Lost MW × Power Price × Downtime Hours = Annual Downtime Cost
02
Emergency Repair Premium
Emergency maintenance typically costs 3–5× the same repair done on a planned basis. Factor in weekend/night labour rates, expedited parts freight, contractor premium fees, and crane hire at short notice.
Planned Repair Cost × 3.5 (average emergency multiplier) = Emergency Cost
03
Preventive Over-Maintenance
Schedule-based maintenance replaces parts at fixed intervals regardless of actual condition. Predictive monitoring extends intervals on healthy assets — reducing unnecessary part replacements, labour, and outage time by 20–40%.
Annual PM Spend × Interval Extension % = Avoidable PM Cost
04
Regulatory & Compliance Exposure
Unplanned failures triggering environmental limit breaches, grid supply obligations, or safety incidents carry regulatory cost that most ROI models ignore. These range from formal notices to contractual penalties and can exceed $100K per event.
Risk-adjusted annual compliance exposure × failure probability reduction
05
Asset Life Extension Value
Equipment maintained at optimal condition lasts longer. Each year of extended asset life defers capital replacement spend. For a major rotating machine worth $2–5M, extending life by 2 years has significant NPV impact.
Asset replacement cost ÷ extended life years = Annual capital deferral value
OxMaint's Analytics platform captures actual maintenance cost data across all five categories — turning your ROI calculator into a live tracking dashboard your finance team can use month-over-month.
Calculator
Step-by-Step ROI Calculation: Input Your Plant Data
Use this structured calculator framework with your plant's actual figures. Each input line includes benchmark ranges for reference so you can validate your numbers against industry norms.
Section A — Downtime Cost Inputs
Installed generation capacity (MW)
Your value here
Benchmark: 50–2,000 MW per unit
Average power price received ($/MWh)
Your value here
Benchmark: $25–$120/MWh depending on market
Unplanned downtime hours annually (last 3-year average)
Your value here
Benchmark: 80–400 hours/year for reactive-maintained plants
Estimated annual unplanned downtime revenue loss
= MW × $/MWh × Downtime Hours
Section B — Maintenance Cost Inputs
Total annual maintenance budget ($)
Your value here
Benchmark: $8–$22/kW installed capacity per year
Estimated emergency/reactive maintenance share (%)
Your value here
Benchmark: 35–55% for reactive-heavy operations
Emergency cost multiplier over planned cost
3.5× (industry average)
Benchmark: 3× to 5× depending on remoteness and parts availability
Emergency maintenance premium cost annually
= Budget × EM% × (Multiplier – 1)
Section C — Predictive Investment Inputs
Estimated platform and sensor deployment cost ($)
Your value here
OxMaint: contact for site-specific quote
Annual software subscription cost ($)
Your value here
Benchmark: $0.5–$3/kW annually for full-platform solutions
Total Year 1 investment
= Deployment + Annual Subscription
Benchmark Data
Industry ROI Benchmarks by Plant Type
These benchmarks are drawn from published utility sector studies, EPRI research, and operational data from predictive maintenance deployments across power generation asset classes.
| Plant Type |
Avg. Downtime Reduction |
Maintenance Cost Savings |
Typical Payback Period |
Year 3 ROI Range |
| Combined Cycle Gas |
38–52% |
28–40% |
14–20 months |
4–7× investment |
| Coal-Fired Thermal |
30–45% |
22–35% |
18–26 months |
3–5× investment |
| Nuclear (Auxiliary Systems) |
25–38% |
18–28% |
20–30 months |
3–6× investment |
| Hydro Generation |
35–50% |
25–38% |
16–22 months |
4–7× investment |
| Wind Farm (On/Offshore) |
40–60% |
30–45% |
12–18 months |
5–9× investment |
| Solar + Battery Storage |
30–45% |
20–32% |
15–22 months |
3–6× investment |
Building the Case
How to Present the Maintenance ROI Case to Leadership
A technically sound ROI calculation loses in budget conversations when it is presented without context. The structure below is designed for presentation to plant directors, CFOs, and utility executives who will challenge the assumptions before approving spend.
Step 1
Lead with a Specific Failure Event
Name the most costly unplanned failure from the last 24 months. Calculate its total cost including downtime revenue, emergency repair, and regulatory exposure. This is your anchor — it makes the abstract concrete.
Step 2
Show the Conservative Case Only
Use the lower bound of industry benchmark ranges. A 30% downtime reduction claim is far more credible in a board presentation than 50%. Conservative numbers build trust and still show compelling returns.
Step 3
Break Down Payback in Quarters
Show Q1–Q8 savings against investment. Most predictive maintenance systems pay back a significant portion of deployment cost in the first 6–9 months through a single avoided failure event.
Step 4
Include a Risk-Adjusted Scenario
Present three scenarios: base case (30% downtime reduction), optimistic (50%), and what happens if you do nothing and last year's failure event repeats. The "do nothing" cost is often the most persuasive number in the room.
FAQs
Frequently Asked Questions
How accurate is an ROI calculation before we have real plant data in the system?
Pre-deployment estimates are directional, not precise. They are useful for budget approval but should be refined once you have 6 months of operational data. OxMaint's analytics platform automatically tracks actual savings against the baseline so your ROI estimate becomes a real tracked metric.
Start a free trial to begin baseline data collection.
Which cost category typically delivers the largest ROI for power plants?
For most thermal and gas plants, unplanned downtime revenue loss is the dominant driver — often representing 60–75% of total ROI. For plants with lower generation value, avoided emergency repair premiums become proportionally more significant. Calculate both before deciding which to lead with in your business case.
Does the ROI model account for the cost of false positive alerts from AI systems?
It should. False positive alerts that send technicians to inspect healthy equipment have a labour cost. A well-calibrated AI monitoring system targets below 10% false positive rate. Factor in roughly 2–4 hours per false positive investigation when modelling net alert response cost.
Book a demo to see OxMaint's alert accuracy benchmarks.
How should we handle years where no major failures occur — does ROI look weak?
Yes, and this is a known challenge in presenting predictive maintenance ROI. The solution is to track near-miss events — anomalies detected and resolved before failure — and assign a probability-weighted cost to each. This makes the value of prevention visible even in failure-free years.
Can OxMaint provide reference ROI data from existing power plant customers?
Your Next Avoided Failure Event Pays for the Entire Platform
OxMaint's Analytics and Monitoring platform tracks maintenance savings in real-time — turning your ROI estimate into a live dashboard your leadership team can see every month. Stop estimating. Start measuring.