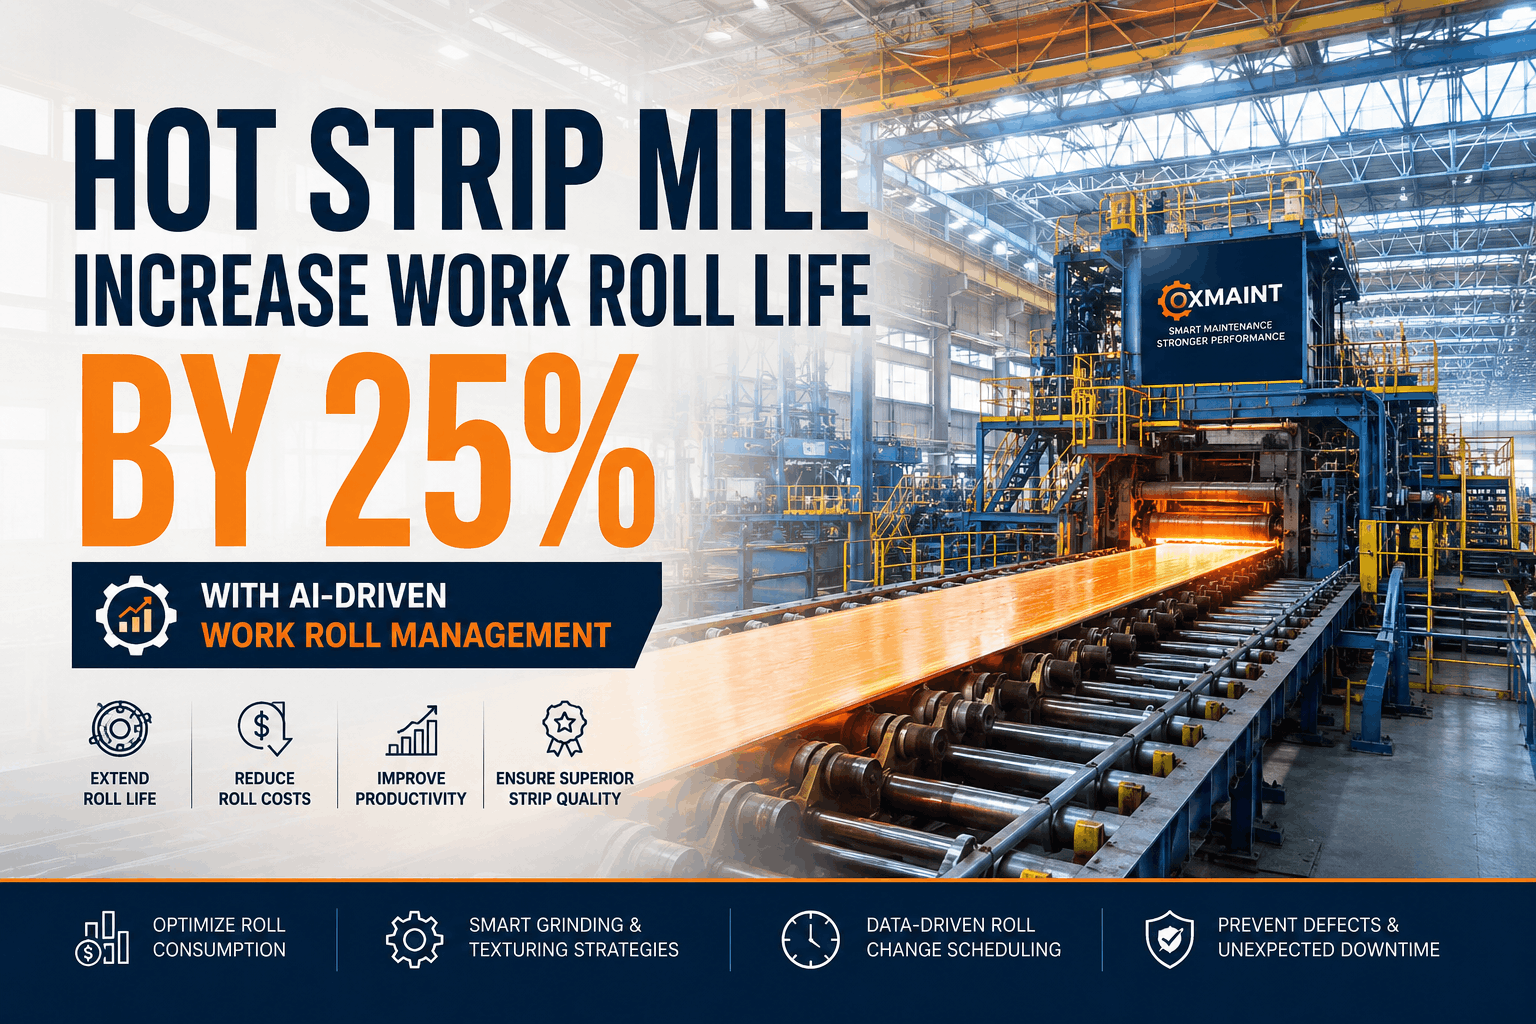
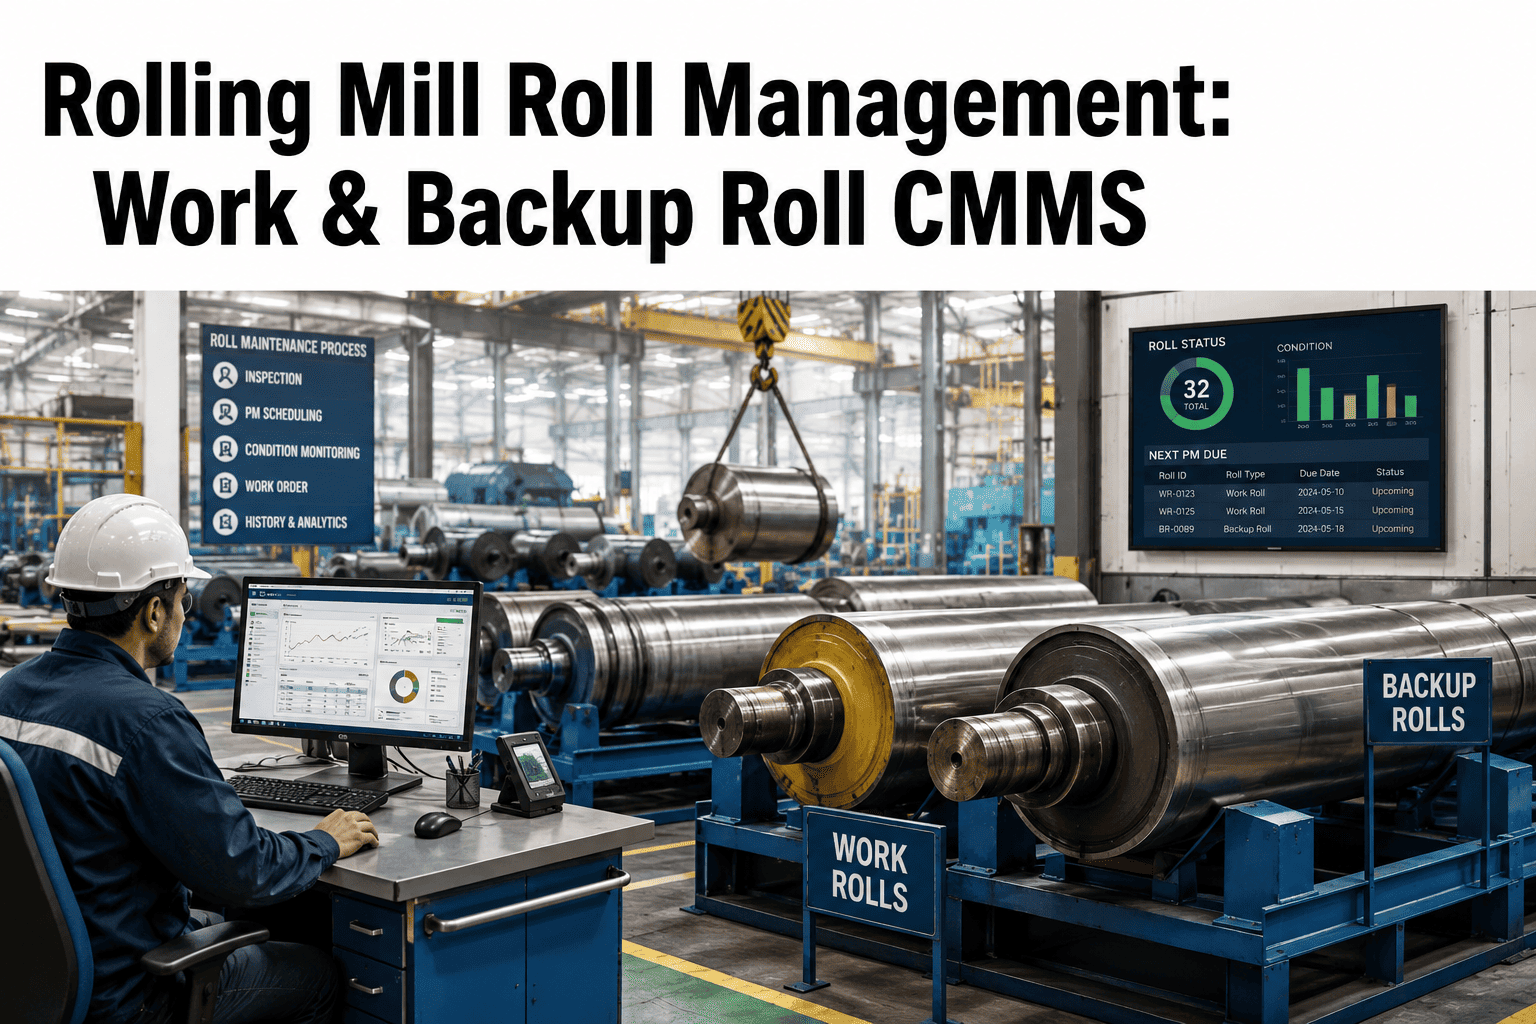
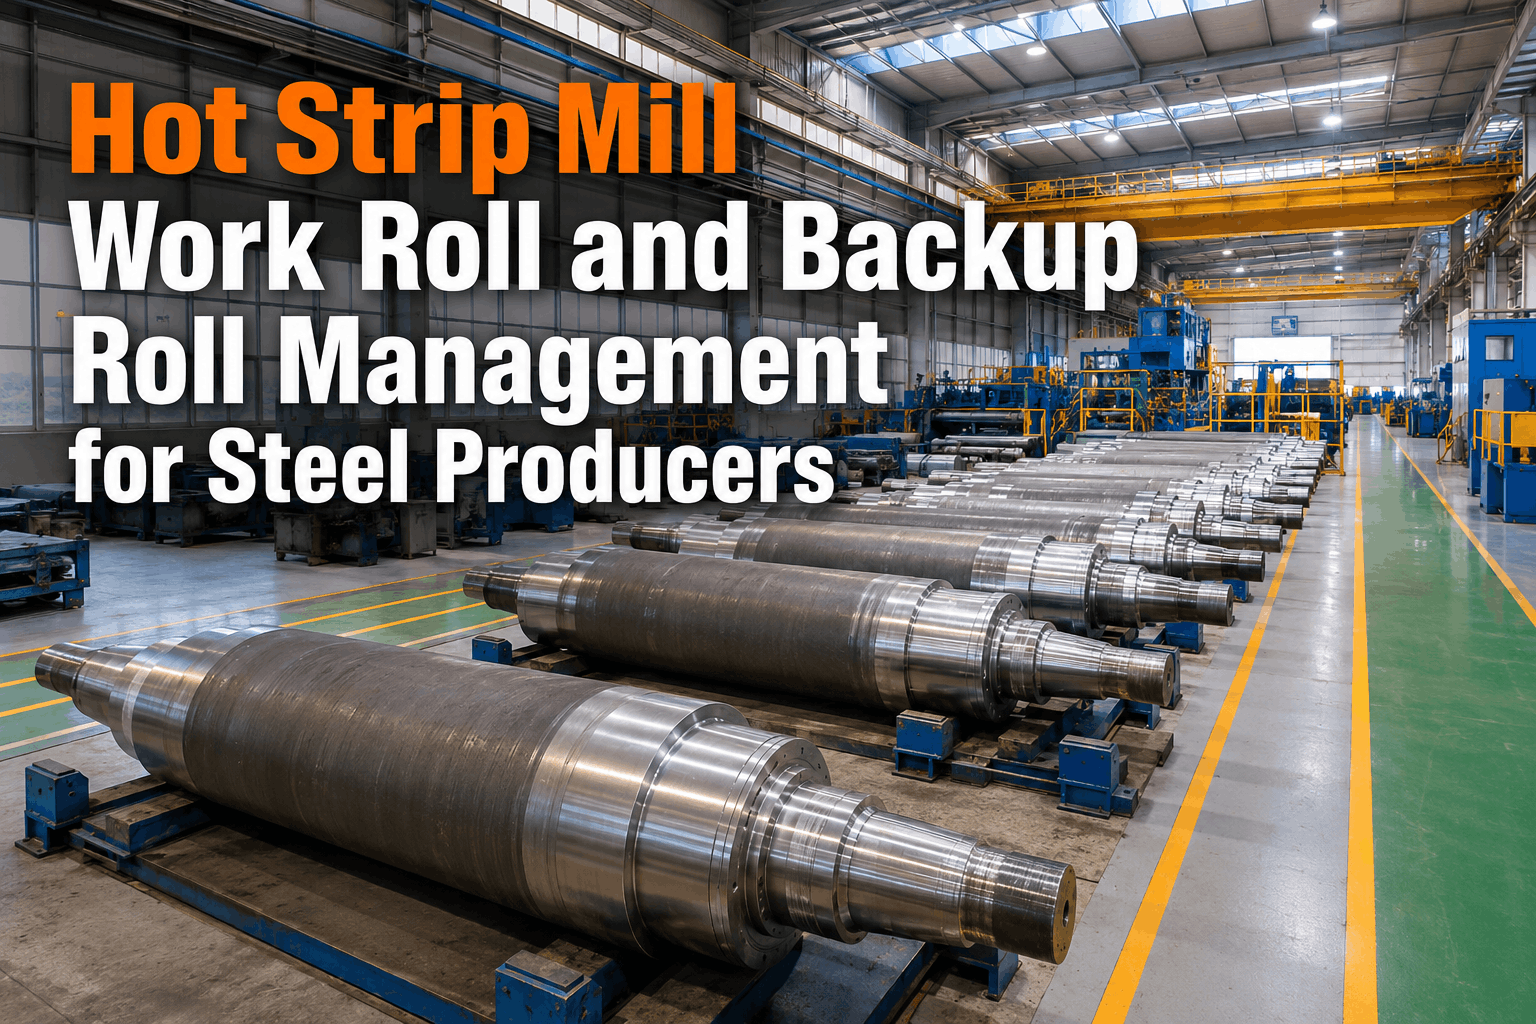
Hot Strip Mill Work Roll Management: Strategies to Increase Roll Life by 25%
By Alex Jordan on June 26, 2026
Work roll consumption is among the highest operating costs at hot strip mills — a major integrated U.S. facility spends $5–12 million annually replacing rolls that degrade through thermal fatigue, mechanical wear, and surface defects during continuous contact with hot steel. Yet 40–50% of this cost is unnecessary waste driven by fixed replacement schedules applied uniformly to rolls operating under vastly different conditions across multiple mill stands. World-class mills in North America extend work roll life 20–35% through condition-based monitoring, optimized cooling strategies, planned groove wear management, and predictive roll change scheduling — converting reactive roll replacements (unplanned downtime, elevated costs) into scheduled work completed during planned maintenance windows. The technology infrastructure supporting advanced roll management — automated roll wear tracking, thermal image analysis, surface defect detection, and finite element stress analysis — enables mills to forecast roll failure windows weeks in advance, optimize replacement scheduling, and redirect $1–3 million annually from unnecessary roll consumption into productive capacity increases.
Maintenance Strategy · Technical Guide · 2026
Hot Strip Mill Work Roll Management: Strategies to Increase Roll Life by 25%
Optimize work roll life through condition-based wear monitoring, thermal management, and predictive replacement scheduling — reduce roll consumption costs $1–$3M annually while maintaining strip quality and extending campaign life 20–35%.
$5–12MAnnual work roll replacement cost at integrated U.S. mill
20–35%Potential life extension through condition-based management
$1–3MAnnual cost reduction opportunity from optimized scheduling
4–8 weeksAdvance warning from predictive roll wear monitoring
The Economics of Roll Wear: Fixed Schedules vs. Condition-Based Replacement
Traditional roll management applies fixed replacement cycles across all mill stands — every 300–400 tons of material per work roll, regardless of actual wear progression. This approach creates two problems: Some rolls are replaced prematurely (15–25% remaining usable life discarded), wasting raw material and capital; other rolls are pushed to edge-of-failure conditions where surface defects trigger quality issues or catastrophic failure mid-campaign. Condition-based roll management monitors wear rate, thermal fatigue signatures, and surface defect progression stand-by-stand, enabling replacement cycles to vary from 250–600 tons depending on actual degradation rates. A stand rolling consistently at moderate load and temperature extends to 550 tons; a stand processing tougher grades or running at higher draft requires cycle shortening to 280 tons. The data-driven approach reduces average roll consumption 18–28% while simultaneously reducing unplanned roll changes (quality failures, catastrophic defects) by 40–60%.
Five Critical Variables Controlling Work Roll Life in Hot Strip Mills
Rolling Draft & Load
Impact: Each 1% increase in draft reduces roll life 3–6%
Critical factor
High draft stands (F6–F7 in typical finishing mills) consume rolls 2–3× faster than low-draft roughing stands. Monitoring delivered load per stand guides rolling speed optimization, balancing quality with roll consumption and enabling dynamic cycle adjustment.
Thermal Fatigue & Cycling
Impact: 50–100°C temperature cycling per pass initiates surface cracking
Major wear mode
Contact with ~1000°C hot steel followed by cooling water spray creates rapid thermal cycling. Optimized cooling systems (spray pattern, timing) reduce thermal gradient 30–40%, significantly extending roll life. Surface fire crack network initiates ~200–300 tons into campaign; monitoring crack propagation forecasts end-of-life.
Surface Defects & Spalling
Impact: Copper inclusion or hard spot triggers spall growth; life cuts to 20% remaining
Quality-critical factor
Surface inspection (automated vision systems) detects spalls 1–2 mm diameter in finishing stand rolls, triggering immediate removal before progressive spall growth marks product surface. Early defect detection saves $50K–$300K in quality losses per incident.
Groove Wear Pattern
Impact: Non-uniform groove wear indicates setup or coolant distribution issues
Wear tracking key
Automated groove wear measurement (laser or capacitive probe) shows wear uniformity. Groove center wear 20–30% exceeding edge wear signals misaligned roll adjustment, uneven metal flow, or coolant pattern degradation — conditions that shorten roll life 15–25%. Early correction enables roll recovery.
Roll Material & Metallurgy
Impact: High-CR (chromium) rolls outlast standard steel 40–60%; costs 2.5–3× base price
Economic decision
Finishing stand rolls see high thermal cycling and contact stress; high-CR material justifies premium through extended life. Roughing stand rolls operate lower stress; standard forged steel offers better economics. Material selection by stand type optimizes lifecycle cost per ton of strip produced.
Condition-Based Roll Monitoring Architecture: Data Collection to Replacement Triggering
Monitoring Method
Limited Visibility
Full Predictive Framework
Groove wear tracking
Manual measurement every 2–3 weeks using pit gauges; inaccurate, labor-intensive, inconsistent between operators
Automated laser/capacitive probe system measures groove profile continuously; data feeds CMMS, trends tracked, wear rate forecasted daily
Surface defect detection
Visual inspection by technician walking mill; subjective, misses early-stage spalls <2 mm
Automated vision system (edge detection, thermal imaging) monitors every roll surface continuously; detects spalls 1–2 mm; alerts within minutes
Thermal monitoring
Occasional IR gun measurement by technician; one or two points per stand; low confidence in trending
Thermal imaging system captures roll surface temperature across width, every roll; anomalies flagged automatically; thermal fatigue progression tracked
Cycle life forecasting
Fixed 300–400 ton schedule applied uniformly; some rolls discarded with 20–30% life remaining
Machine learning forecasts remaining campaign life based on wear rate trend, thermal signature, and historical data; cycles optimized 250–600 tons per stand
Maintenance scheduling
Roll changes reactive — quality issue emerges, roll removed emergency mid-campaign
Predictive triggering — forecasted end-of-life scheduled 2–4 weeks in advance for planned replacement during maintenance window
Cooling System Optimization: 30–40% Thermal Fatigue Reduction
Roll cooling strategy is the highest-leverage control point for thermal fatigue life. Most mills apply full-pressure water spray across the roll width immediately after steel pass, creating rapid 50–100°C temperature cycling that initiates surface fire cracks after ~150–200 tons of throughput. Optimized cooling applies spray targeting to high-stress zones (center 60% of roll width, where most contact occurs) while maintaining cooler spray pressure in lower-stress edge zones. Spray timing is adjusted — cooling begins 0.2–0.4 seconds after pass exit, allowing initial surface cooling before rapid quench. Pattern optimization reduces temperature differential 30–40%, measurably extending roll life 15–25% while maintaining metallurgical property stability. Real-time thermal image feedback allows dynamic adjustment as mill conditions change (material grade, rolling speed, ambient temperature), optimizing each campaign.
Laser probe system measures groove cross-section 8–10 points per roll width, stores data in CMMS, calculates wear rate (mm/ton). Trends visible within 50–100 tons of operation; remaining life forecast generated automatically by comparing current wear rate to historical data for same grade/stand combination.
Vision System Monitoring
Real-Time Defect Detection
Surface scan captures every roll pass; edge detection identifies spalls 1–2 mm
High-speed camera (10K fps) or thermal imaging captures roll surface as it rotates. Software applies edge detection and variance analysis to identify surface breaks, copper inclusions, and early spalls. Defect flagged within 2–3 minutes of occurrence; technician receives alert with location and severity classification; roll removal scheduled for next opportunity.
Thermal Image Analysis
Temperature Mapping
Infrared camera captures roll surface temperature across width
Thermal camera records surface temperature as roll exits last cooling zone. Temperature distribution shows cooling effectiveness; anomalies (hot spots >5°C above baseline) indicate thermal cycling imbalance or cooling distribution degradation. Automated alerts trigger cooling system maintenance before thermal fatigue accelerates.
Model trained on historical roll performance (wear rate, thermal fatigue, surface degradation) for each stand/grade combination. Current wear rate, thermal signature, and defect trends fed into model; probability distribution forecasts end-of-life within ±50 tons accuracy. Enables scheduling roll changes 2–4 weeks in advance rather than reactive replacement.
"
We implemented automated groove wear tracking and thermal monitoring on our finishing mills in Q1 2024. By analyzing wear rate trends and forecasting remaining life per stand, we optimized our roll replacement cycles — some extended to 520 tons (previously 380 tons), others shortened to 280 tons where thermal stress was higher. Over the first 12 months, we reduced total roll consumption 26% while actually improving product quality through earlier defect detection. That 26% reduction on a $8M annual roll budget is $2.1M savings — and we've prevented 3 catastrophic mid-campaign roll failures that would have cost $500K+ each in downtime and quality losses.
Rolling Mill Superintendent — Hot Strip Mill, Indiana, USA
Frequently Asked Questions
What is the relationship between rolling draft and work roll life?
Each 1% increase in rolling draft reduces work roll life 3–6% through increased contact stress and thermal cycling severity. A finishing stand operating at 25% draft consumes rolls 2–3× faster than a stand at 10% draft, all else equal. Draft optimization (within product quality constraints) is the single highest-leverage control for extending roll life.
How does thermal cycling initiate surface fire cracks in work rolls?
Contact with ~1000°C hot steel followed by 50–100°C cooling creates rapid thermal stress. Surface layers expand/contract unevenly, initiating micro-cracks at ~200–300 tons throughput. Optimized cooling (reduced temperature gradient) delays crack initiation 50–100 additional tons, directly extending roll life 15–25%.
What is the cost benefit of high-chromium roll material vs. standard forged steel?
High-CR rolls cost 2.5–3× base price but last 40–60% longer, improving lifecycle economics on high-stress stands (finishing mills, high-draft roughing) where extended life justifies premium. Standard steel rolls remain economical on lower-stress applications (backup rolls, low-draft processing). Selection by stand criticality optimizes total cost per ton produced.
How can automated wear monitoring improve roll consumption accuracy compared to manual measurement?
Automated laser probes measure groove profile 8–10 points per width, every 4 hours, with ±0.1 mm accuracy. Manual pit gauges are taken 1–2 times per week, operator-dependent, ±0.5 mm accuracy. Automated systems detect wear trends within 50–100 tons; manual systems require 300+ tons before trend is clear, delaying corrective action 2–3 weeks.
What does non-uniform groove wear indicate and how should it be corrected?
Groove center wear 20–30% exceeding edge wear indicates roll misalignment, uneven coolant distribution, or misaligned metal entry. Correction requires re-centering rolls (±0.5 mm adjustment) and inspecting coolant spray pattern. Early correction restores uniform wear and recovers 50–100 additional tons of roll life.
How does spall detection speed impact roll changeover costs and product quality?
How does spall detection speed impact roll changeover costs and product quality?
Visual inspection detects spalls 3–5 mm (late stage); automated vision detects 1–2 mm (early stage). Removing roll at 1–2 mm spall costs ~$30K; at 3–5 mm, rolling marked product through mill costs $50K–$300K in quality losses and customer claims. Automated early detection saves $20K–$270K per incident through prevention of marked strip production.
What is the minimum improvement in roll life that justifies investment in condition monitoring system?
A system costing $150K–$250K annually justifies itself with 8–12% improvement in roll life at a $5M+ annual roll budget (>$400K savings). Most mills see 18–28% improvement within 12 months, generating $900K–$1.4M annual value. Payback period typically 2–4 months, with multi-year benefits accumulating.
Extend Your Work Roll Life by 20–35% Today.
Oxmaint integrates automated wear tracking, thermal monitoring, and predictive cycle forecasting into your CMMS — reduce roll consumption costs $1–$3M annually while maintaining strip quality and extending campaign life.