Discrete manufacturing—producing individual, countable units like machined parts, assembled products, or packaged goods—presents unique OEE challenges that continuous process industries don't face. Frequent changeovers, variable cycle times across different products, complex scheduling, and make-to-order flexibility all impact how you measure and improve Overall Equipment Effectiveness. Modern OEE systems designed for discrete manufacturing account for these complexities to give you accurate, actionable metrics.
The 85% "world-class" OEE benchmark originated specifically in discrete manufacturing (Japanese automotive in the 1970s), yet most discrete manufacturers today average only 60%. This guide explains how to properly apply OEE in discrete environments, addresses the unique challenges you'll face, and provides strategies to close that performance gap.
Discrete vs. Continuous: Key Differences
Discrete Manufacturing
- Individual, countable units (parts, products)
- Output measured in pieces/units
- Frequent product changeovers
- Variable cycle times per product
- Make-to-order common
- Assembly, machining, fabrication
Continuous Manufacturing
- Continuous flow, non-countable output
- Output measured in volume/weight/length
- Minimal changeovers (runs 24/7)
- Consistent cycle/throughput rate
- Make-to-stock typical
- Chemicals, paper, steel, oil refining
OEE Formula for Discrete Manufacturing
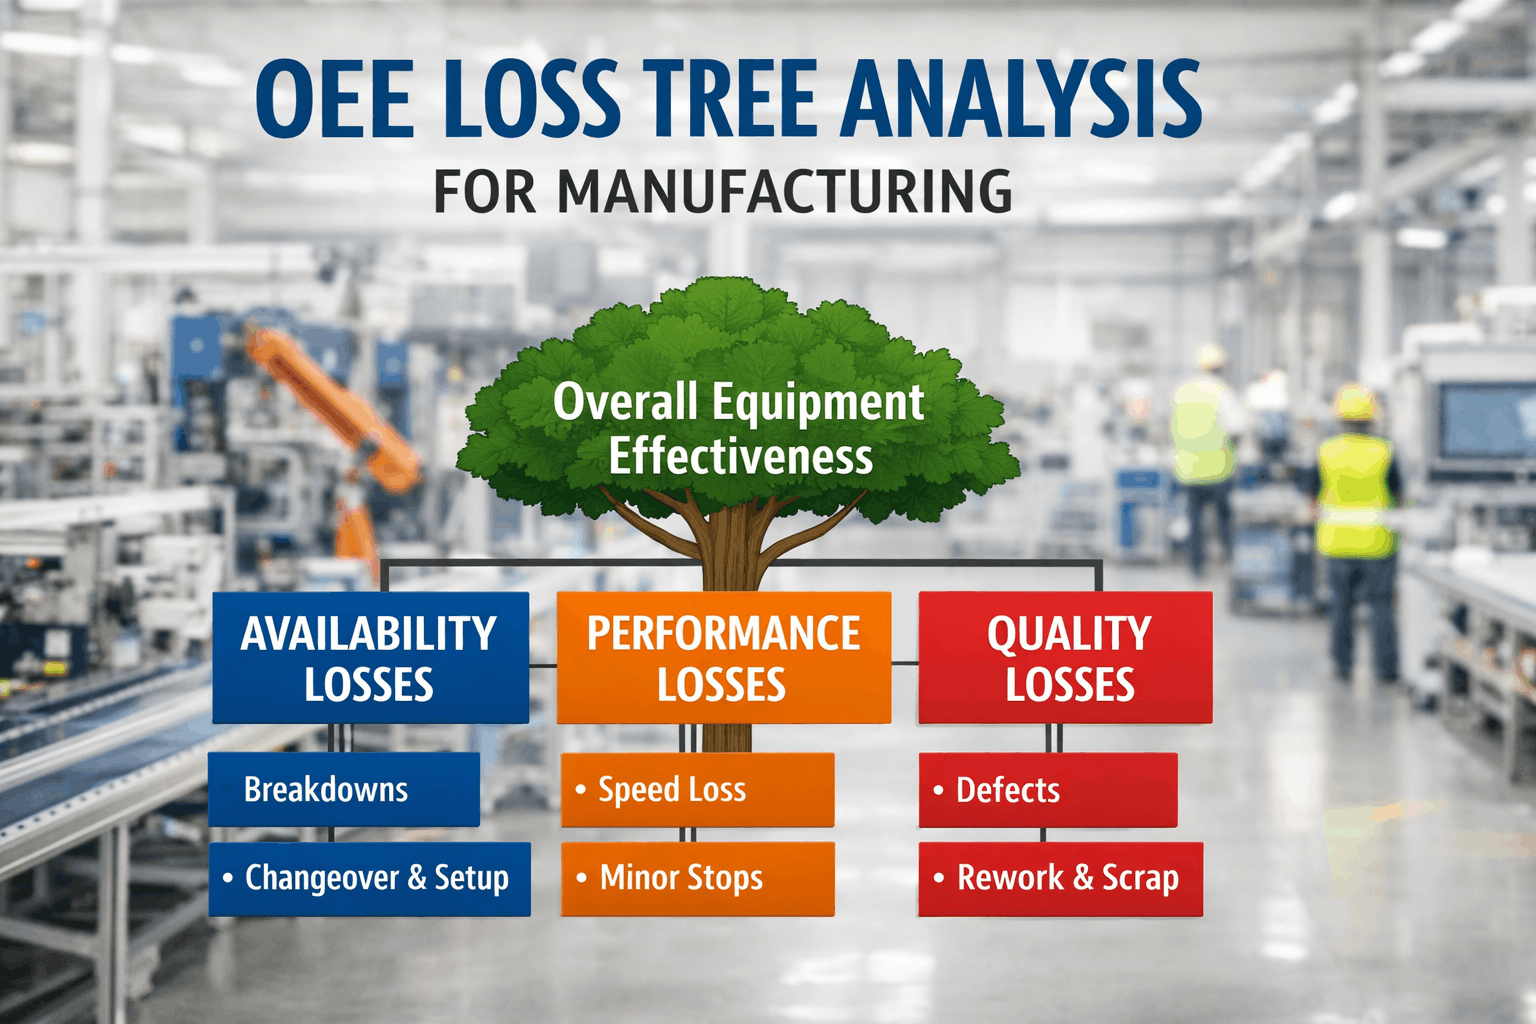
The standard OEE formula applies directly to discrete manufacturing, with each component measured in terms of units produced and cycle time per unit.
Availability
Run Time ÷ Planned Production Time
Did the machine run when scheduled? Accounts for downtime from breakdowns, changeovers, setups, and material shortages.
Performance
(Ideal Cycle Time × Total Count) ÷ Run Time
Did it run at full speed? Accounts for slow cycles, minor stops, and anything that causes production below maximum rate.
Quality
Good Count ÷ Total Count
Were all parts good? Accounts for scrap, rework, and any units that don't pass first-time quality inspection.
OEE Built for Discrete Manufacturing
Oxmaint handles the complexities of discrete manufacturing—multiple products, variable cycle times, frequent changeovers—with automated tracking that gives you accurate OEE by product, line, and shift.
Unique Challenges in Discrete Manufacturing
Discrete manufacturing introduces complexities that make OEE measurement and improvement more challenging than in continuous operations. Understanding these challenges helps you implement OEE correctly. Talk to our specialists about solving these challenges in your operation.
Multiple Products, Multiple Cycle Times
A CNC machine might run 50 different part numbers, each with a different ideal cycle time. Using a single cycle time for all products makes Performance calculations meaningless.
Frequent Changeovers
High-mix/low-volume operations may change over 10+ times per shift. Each changeover consumes time that shows as Availability loss, even though changeovers are necessary for the business model.
First-Piece Inspection Rejects
After changeover, first pieces often require adjustment before achieving quality specifications. These expected startup rejects shouldn't be treated the same as in-process quality failures.
Operator-Dependent Operations
Manual operations like assembly, inspection, or material handling introduce human variability. Cycle times vary between operators, and "ideal" cycle time may be unclear.
Job Shop Scheduling
Make-to-order job shops may run different jobs on the same machine throughout the day, making it hard to define "planned production time" and track OEE consistently.
Multi-Station Production Lines
Assembly lines with multiple stations create complexity—which station's OEE matters? A downstream bottleneck starves upstream stations; upstream problems block downstream.
OEE Benchmarks for Discrete Manufacturing
Understanding where your OEE stands relative to industry benchmarks helps you set realistic targets and identify improvement potential. Oxmaint provides industry-specific benchmarking to show exactly where you stand.
By Discrete Industry Sector
Why Discrete Manufacturing Averages 60%
Research shows discrete manufacturing typically achieves 55-65% OEE—well below the 85% "world-class" target. The primary loss factors are:
Calculating OEE: Discrete Manufacturing Example
Let's walk through a complete OEE calculation for a typical discrete manufacturing scenario—a CNC machining cell running multiple part numbers.
Scenario: CNC Machining Cell - 8 Hour Shift
Shift Data
Downtime Events
Production Data
Interpretation
This machining cell achieved 66.2% OEE—typical for discrete manufacturing. The biggest opportunity is Availability (83.3%), with 75 minutes of downtime. Changeovers alone consumed 45 minutes. SMED implementation could potentially recover 20-30 minutes of productive time, pushing OEE above 70%.
OEE Improvement Strategies for Discrete Manufacturing
Improving OEE in discrete environments requires addressing the specific loss patterns common to this manufacturing type. Schedule a consultation to develop a customized improvement plan.
Reduce Changeover Time (SMED)
Single Minute Exchange of Die (SMED) systematically reduces changeover time by converting internal setup (machine stopped) to external setup (while running).
Implement Preventive Maintenance
Unplanned downtime is the #1 loss factor. Shift from reactive to preventive maintenance, scheduling maintenance during non-production time.
Standardize Operator Methods
Different operators achieve different cycle times. Identify best practices from top performers and standardize across all operators through training.
Optimize Production Scheduling
Smart scheduling groups similar products to minimize changeovers. Sequence jobs to reduce setup complexity between consecutive runs.
Real-Time OEE Visibility
You can't improve what you can't see. Real-time OEE tracking makes losses visible immediately so operators and supervisors can respond quickly.
Improve First-Pass Quality
Every defect consumes time and resources. Implement error-proofing (poka-yoke) and process controls to prevent defects rather than detect them.
Start Improving Your Discrete Manufacturing OEE
Oxmaint provides real-time OEE tracking designed for discrete manufacturing—handling multiple products, variable cycle times, and frequent changeovers automatically.
Frequently Asked Questions
How do I handle multiple products with different cycle times?
Track ideal cycle time by product/part number. When calculating Performance, use the specific cycle time for whatever was running during that period. For shift or daily OEE, weight Performance by the time spent on each product. Example: if you ran Part A (2 min cycle) for 3 hours and Part B (1.5 min cycle) for 5 hours, calculate Performance separately for each and weight by run time.
Should changeover time count against OEE?
Yes—changeover time is an Availability loss. While changeovers are necessary, they represent time that could theoretically be used for production. Tracking changeover time in OEE creates visibility and motivation to reduce it through SMED. However, set realistic Availability targets that account for expected changeover frequency—a high-mix cell will never match a dedicated line's Availability.
How do I calculate OEE for an assembly line with multiple stations?
Calculate line-level OEE based on finished units coming off the end of the line. This reflects true output regardless of which station caused any losses. Additionally, track station-level OEE to identify constraints. Focus improvement efforts on the bottleneck station—improving non-bottlenecks won't increase line output. The line can never exceed the OEE of its constraint.
What's a realistic OEE target for a high-mix job shop?
High-mix/low-volume operations typically achieve 55-70% OEE due to frequent changeovers. Don't chase 85% if your business model requires flexibility. Instead, focus on improving from your baseline—if you're at 55%, target 62% in year one. Also track metrics beyond OEE: on-time delivery, lead time, and setup time reduction may be more relevant for job shop competitiveness than raw OEE.
How do I determine ideal cycle time for a new product?
For new products, use the designed/engineered cycle time initially. After 2-4 weeks of production, analyze actual cycle time data and update to the best demonstrated cycle time (fastest consistently achieved). Some teams add a 5-10% margin to best demonstrated time. The key is consistency—document how you set ideal cycle time and apply the same method across all products.