A steel plant can spend heavily on maintenance and still lose money to downtime, because the two costs hide in different reports. Repair invoices sit in one system, lost production in another, and nobody sees the full picture. Reliability cost analysis puts them side by side so you can see which assets, failure types and habits cost the most. This guide shows how to measure it with Oxmaint maintenance management software.
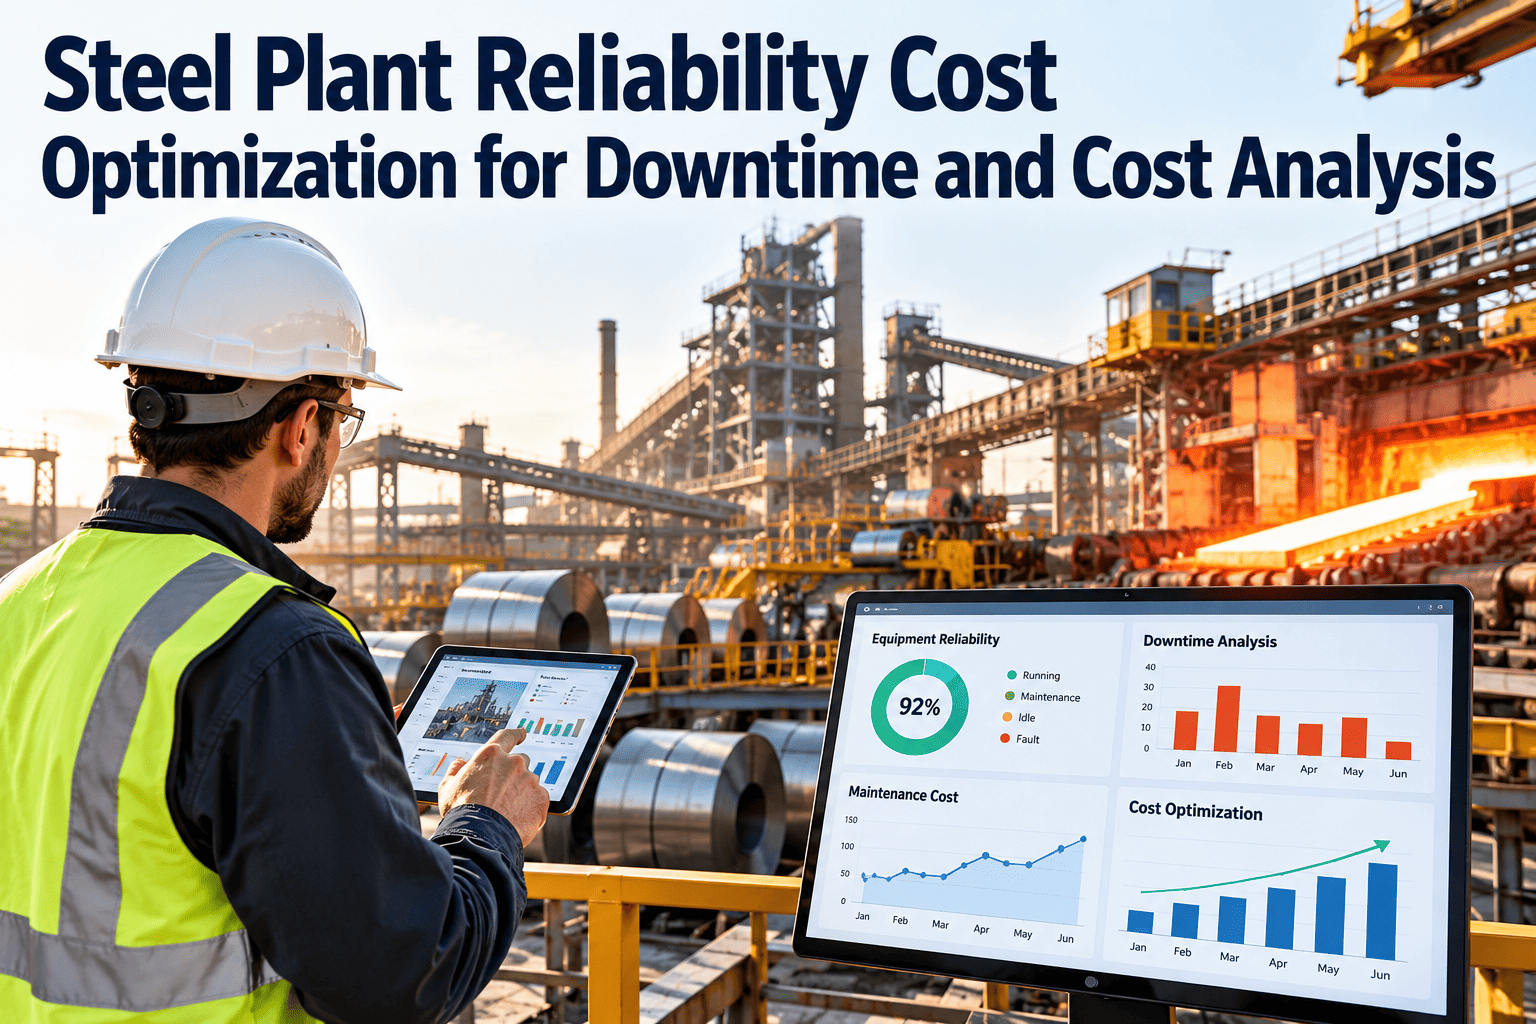
Steel Plant Reliability Cost Optimization for Downtime and Cost Analysis
Measure what each stoppage really costs, find the assets that drain budget and decide where reliability spending pays back first.
Why Maintenance Cost Alone Misleads
A low maintenance budget can look like success while reactive failures quietly consume the plant's capacity. A high budget can be healthy if it prevents expensive stops. The right question is total cost, not spend.
- Maintenance labor hours
- Parts and contractor invoices
- Budget versus actual by cost center
- Downtime hours by asset and cause
- Production and quality impact
- Cost per failure and per failure mode
Building the Cost of One Stoppage
Start with a repeatable formula that production, finance and maintenance accept. The exact inputs belong to your plant.
Agree on the cost per lost hour
- Decide whether the bottleneck is the caster, the mill or a downstream process.
- Use contribution margin or lost throughput value, as agreed with finance.
- Separate stops that lose output from stops absorbed by buffers or spare capacity.
- Document the method so numbers stay consistent between reports.
The Reliability Metrics That Matter
Metrics only help when everyone calculates them the same way. Define each one once and apply it by asset class.
| Metric | Meaning | How to read it |
|---|---|---|
| MTBF | Mean time between failures: operating time divided by number of failures | Rising MTBF suggests growing reliability |
| MTTR | Mean time to repair: total repair time divided by number of repairs | High MTTR points to parts, skills or planning gaps |
| Availability | Share of scheduled time the asset can run | Combines failure frequency and repair duration |
| Planned maintenance percentage | Planned work hours as a share of total | Higher planned share usually means fewer emergencies |
| Schedule compliance | Planned work completed as scheduled | Low values expose weak planning or access |
| Backlog | Open work measured in weeks of crew capacity | Growing backlog signals unaddressed risk |
| Maintenance cost per ton | Maintenance spend divided by output | Useful for trends and comparison across periods |
A Dashboard Layout That Supports Decisions
Good dashboards answer questions. Arrange views from plant level down to the single asset.
Finding the Bad Actors
A small group of assets usually causes a disproportionate share of lost time. A Pareto analysis exposes them.
See Downtime and Cost in One View
Connect work orders, asset history and downtime records so reliability decisions rest on plant data.
Where Steel Plant Reliability Money Leaks
Planned Versus Reactive: The Cost Comparison to Make
Compare the same asset class under both conditions using your own records. Do not rely on generic rules of thumb.
| Cost element | Planned repair | Reactive repair |
|---|---|---|
| Labor | Scheduled hours, right skills assigned | Overtime, mixed crews, rushed assignments |
| Parts | Ordered and staged in advance | Expedited freight or substitutes |
| Production | Aligned to a planned window | Lost output during an unplanned stop |
| Quality | Controlled shutdown and restart | Scrap and rework risk at restart |
| Safety | Prepared lockout and job plan | Higher exposure under time pressure |
Data Quality Checklist Before Trusting Any KPI
- Every asset has a unique ID and a place in the hierarchy.
- Downtime events record start, end, cause and whether production was lost.
- Work orders use a standard failure code list, not free text only.
- Labor hours and parts are logged against the correct work order.
- Closed work includes a short cause and corrective action note.
- Production and finance agree on the cost per lost hour.
A Reporting Rhythm That Drives Action
How Oxmaint Supports Reliability and Cost Analysis
- Work orders capturing labor, parts, failure cause and corrective action.
- Asset management linking cost and history to each machine.
- Preventive maintenance scheduling to move work from reactive to planned.
- Inventory tracking so repair delays from missing parts are visible.
- Reports and dashboards for backlog, compliance and asset performance.
- Mobile workflows that record data at the point of work.
Frequently Asked Questions
Know What Reliability Really Costs Your Plant
Give maintenance and finance a shared view of downtime, repair spend and the assets worth fixing first.