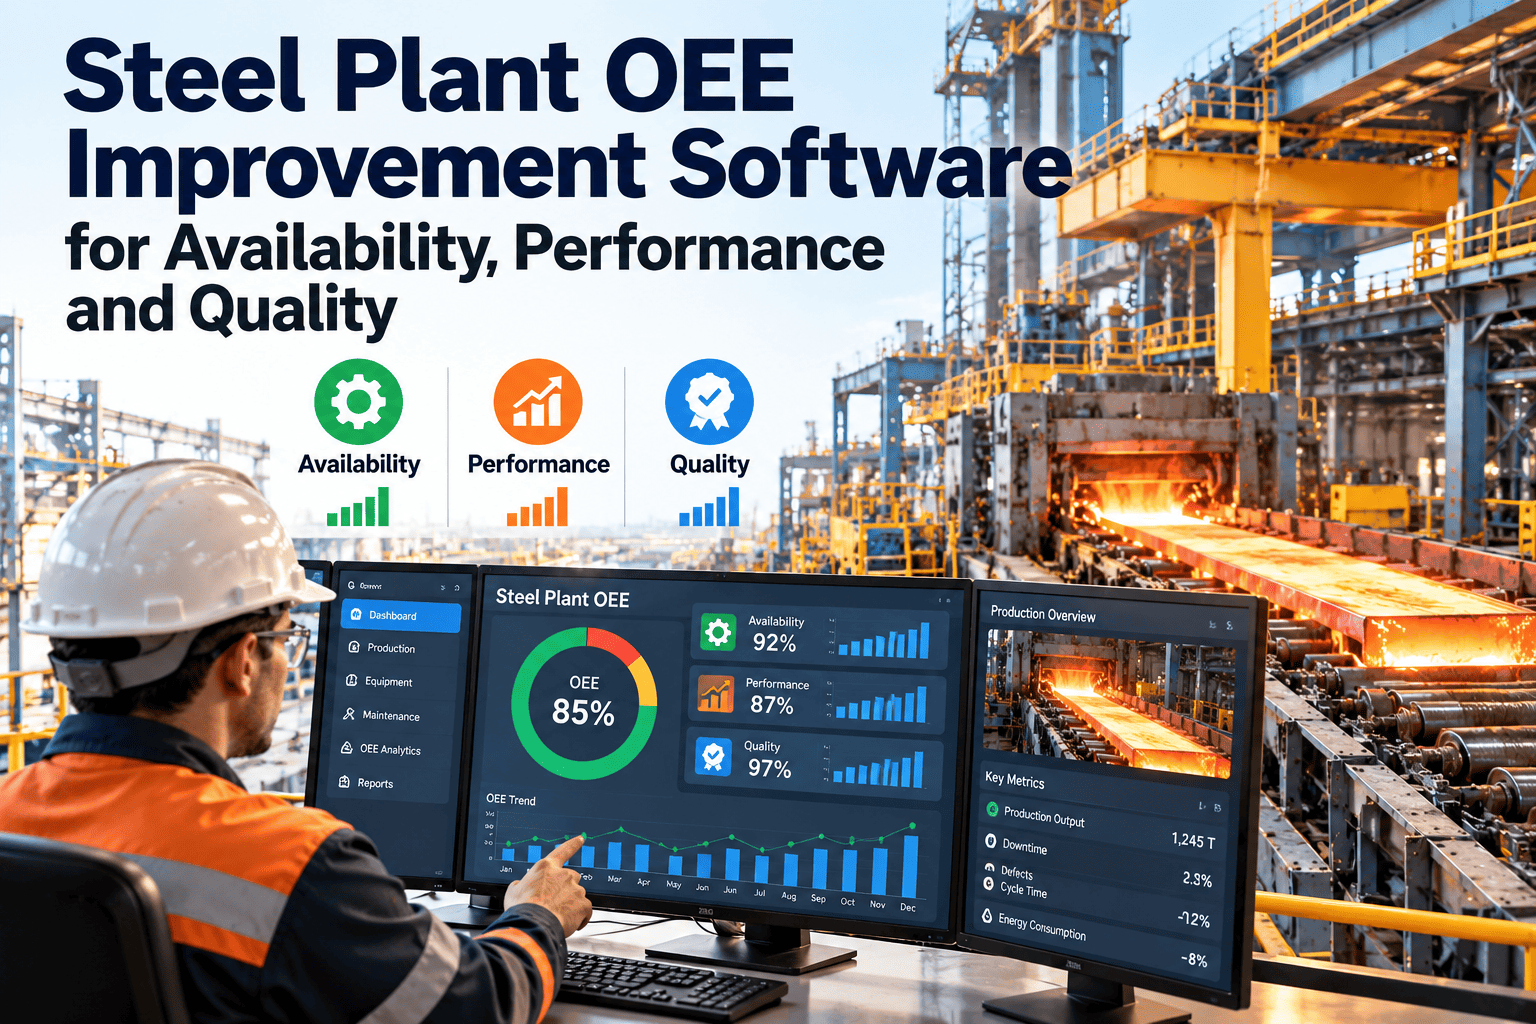
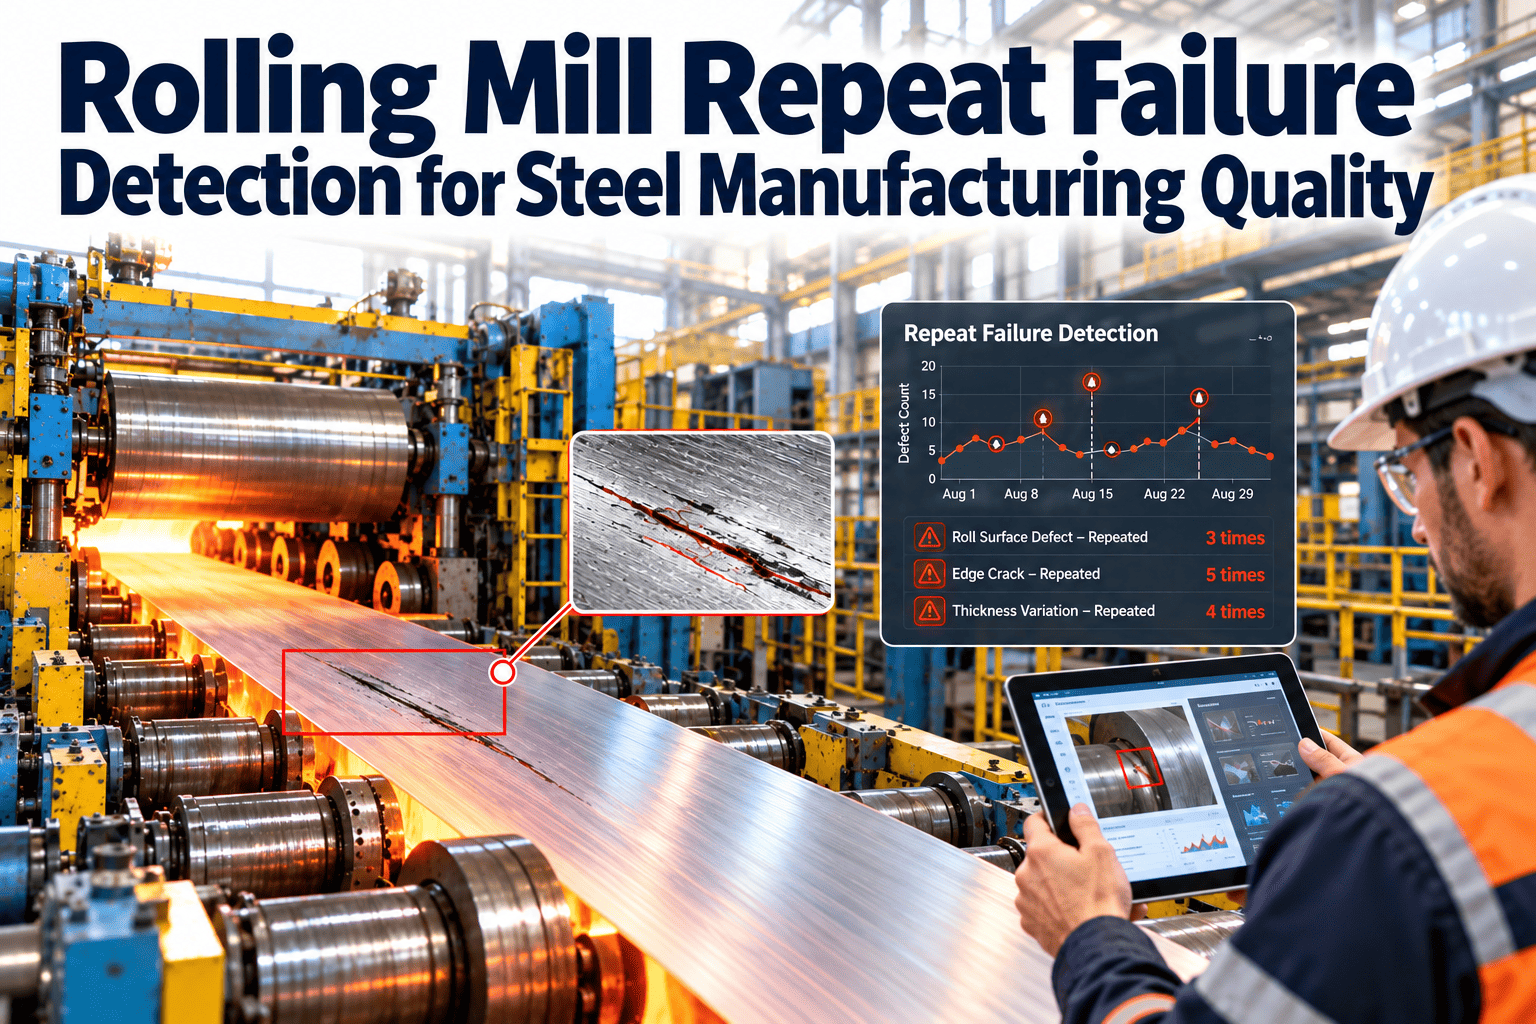
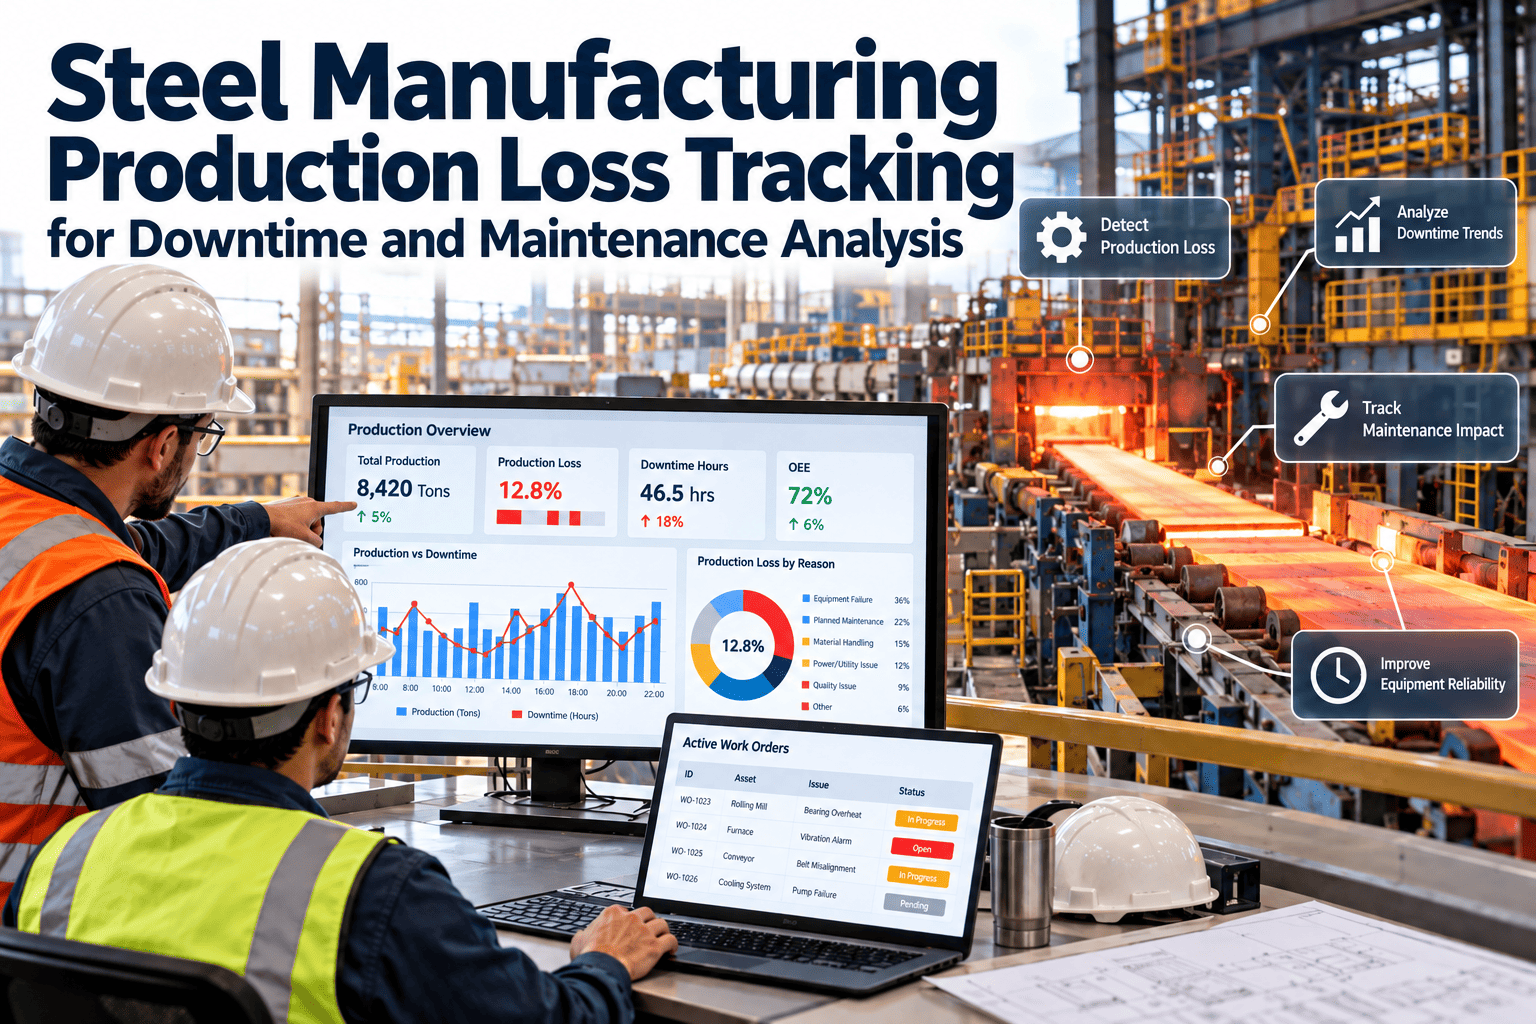
Your equipment ran all shift with zero downtime and produced only good parts—yet you only achieved 75% of expected output. What happened? The answer lies in Performance, one of the three pillars of Overall Equipment Effectiveness (OEE). Performance captures speed losses that silently erode productivity: the machine that runs but runs slowly, the brief stops that don't get recorded, the cycle times that creep above standard. Modern OEE tracking systems expose these hidden losses so you can recover lost capacity.
While Availability and Quality losses are often visible—machines stop, defects pile up—Performance losses hide in plain sight. This guide explains exactly what the Performance KPI measures, how to calculate it correctly, what causes Performance losses, and how to systematically improve this often-overlooked metric.
OEE: The Three Pillars
Availability
Did it run?
Downtime lossesPerformance
Did it run fast?
Speed lossesQuality
Was it good?
Defect lossesOEE
True Productivity
What Performance Actually Measures
Performance measures speed efficiency—the ratio of actual production speed to the theoretical maximum speed. It answers a simple question: when the equipment was running, how fast did it run compared to how fast it could run?
Performance Calculation Example
Let's walk through a complete Performance calculation. Talk to our OEE experts about implementing automated calculations in your operation.
Scenario: Packaging Line Shift Analysis
Calculate Net Run Time (time at ideal speed)
Calculate Performance
Interpretation
The line produced at 86.7% of its theoretical maximum speed. Put another way: if it had run at ideal speed for all 435 minutes of run time, it would have produced 13,050 units instead of 11,310—a difference of 1,740 units lost to speed losses.
Track Performance Losses Automatically
Oxmaint captures cycle times automatically, calculates Performance in real-time, and identifies exactly where speed losses occur.
The Two Types of Performance Losses
Performance losses fall into two categories, both part of the Six Big Losses framework. Understanding the difference helps you target improvement efforts correctly.
Slow Cycles (Reduced Speed)
Equipment runs continuously but at less than maximum speed. The cycle time is longer than ideal, but the machine doesn't stop.
Common Causes
- Machine wear or poor maintenance
- Substandard raw materials
- Operator running below rated speed
- Environmental conditions (temperature, humidity)
- Process parameters not optimized
- Equipment not designed for current product
Small Stops (Minor Stoppages)
Brief stoppages—typically under 5 minutes—that interrupt production but aren't tracked as downtime. They accumulate silently.
Common Causes
- Misfeeds and jams
- Sensor blockages or misalignment
- Product changeover adjustments
- Cleaning between batches
- Operator attention diverted
- Upstream/downstream starving/blocking
Why Small Stops Matter More Than You Think
These brief stops often go unrecorded because they're "too short to log." But they accumulate. A machine with 20 small stops of 2 minutes each loses more production time than a single 30-minute breakdown—yet only the breakdown gets attention.
Setting the Right Ideal Cycle Time
Performance calculations are only meaningful if Ideal Cycle Time is set correctly. Set it too high, and Performance artificially inflates (or exceeds 100%). Set it too low, and you'll never achieve target Performance. Oxmaint helps you establish accurate cycle time baselines.
Nameplate/Design Speed
Use the manufacturer's rated speed or the equipment's design specification.
Best Demonstrated
Use the fastest cycle time actually achieved in production (often called "best of best").
Engineered Standard
Use time studies or engineering analysis to determine realistic optimal cycle time.
Best Demonstrated + Margin
Take best demonstrated time and add 10-20% margin to account for normal variation.
If your Performance consistently exceeds 100%, your Ideal Cycle Time is set too high (too slow). This masks true speed potential and misleads improvement efforts. Recalibrate to the actual maximum demonstrated speed.
Performance Benchmarks
What's a "good" Performance score? Context matters, but these benchmarks provide a reference point.
Note: These benchmarks assume Ideal Cycle Time is correctly set. A 95% Performance with an inflated cycle time is not actually world class. Also, different industries have different norms—continuous process industries often achieve higher Performance than discrete manufacturing.
Strategies to Improve Performance
Once you've identified Performance as your constraint, these strategies target the root causes of speed losses. Schedule a consultation to develop a tailored improvement plan.
Optimize Equipment Settings
Review and optimize process parameters—speeds, feeds, temperatures, pressures. Small adjustments often yield significant cycle time improvements.
Improve Maintenance Practices
Worn components slow cycles. Implement preventive maintenance focused on speed-critical components—bearings, belts, sensors, actuators.
Standardize Operator Methods
Different operators often achieve different speeds. Identify best practices and standardize through training and work instructions.
Address Material Quality
Substandard materials force reduced speeds. Work with suppliers to tighten specifications or adjust parameters for material variation.
Eliminate Small Stops
Attack the causes of minor stoppages—misfeeds, jams, sensor issues. These often require simple fixes once identified.
Real-Time Visibility
You can't improve what you can't see. Real-time cycle time monitoring makes Performance losses visible immediately.
Performance vs. Other OEE Factors
Understanding how Performance interacts with Availability and Quality helps you prioritize improvement efforts.
Where to Focus First?
Many companies neglect Performance because it's less visible than Availability or Quality. But consider: a 5% Performance improvement on equipment that runs 90% Availability means 4.5% more output—equivalent to adding capacity without adding equipment or extending hours.
See Performance in Real-Time
Oxmaint's OEE platform tracks Performance automatically, identifies speed losses, and helps you recover hidden capacity.
Common Performance Measurement Mistakes
Even experienced teams make these errors when measuring Performance. Avoiding them ensures your data drives real improvement.
Using Good Count Instead of Total Count
Performance should measure speed, not quality. Using Good Count double-penalizes for defects (once in Performance, again in Quality). Always use Total Count—all units produced, including defects.
Incorrect Ideal Cycle Time
Setting Ideal Cycle Time too high (slow) inflates Performance scores artificially. Setting it too low makes targets unachievable. Use demonstrable, verifiable speeds.
Not Accounting for Product Mix
Different products have different cycle times. Using a single Ideal Cycle Time for all products distorts Performance. Weight by actual product mix or calculate separately.
Ignoring Small Stops
If your system only tracks stops over 5 minutes, small stops silently erode Performance. Implement automatic cycle time tracking to capture all losses.
Confusing Run Time with Planned Production Time
Performance uses Run Time (after subtracting downtime), not Planned Production Time. Using the wrong denominator corrupts the calculation.
Frequently Asked Questions
Why is my Performance over 100%?
Performance exceeding 100% means your Ideal Cycle Time is set too high (too slow). The equipment is actually capable of running faster than your standard. This masks true potential and misleads improvement efforts. Recalibrate Ideal Cycle Time to the actual fastest demonstrated speed, then Performance will accurately reflect losses.
How do I track small stops that last only seconds?
Automatic cycle time tracking is essential. Measure actual cycle time for every unit—when individual cycles take longer than ideal, you're capturing small stops indirectly. Many OEE systems also use sensors to detect when equipment isn't cycling, even for brief periods. The key is automated data collection; manual logging can't capture these short events.
Should I use different Ideal Cycle Times for different products?
Yes, absolutely. Different products typically have different optimal cycle times based on complexity, size, material, etc. Using a single cycle time for all products distorts Performance calculations. Most OEE systems allow you to define cycle time by product/SKU, then weight Performance calculations based on actual product mix during the period.
How does Performance relate to the Six Big Losses?
Performance captures two of the Six Big Losses: Reduced Speed (slow cycles) and Small Stops (minor stoppages). Availability captures Equipment Failure and Setup/Adjustment. Quality captures Startup Rejects and Production Rejects. Together, the three OEE factors account for all six losses—that's why OEE is such a comprehensive metric.
What's more important to improve: Performance or Availability?
It depends on your current state. Check which factor is dragging OEE down most. If Availability is 95% but Performance is 75%, focus on Performance—there's more to gain. Also consider visibility: Availability losses are obvious (equipment stops), while Performance losses hide. Many plants achieve quick wins by finally measuring and addressing previously invisible speed losses.