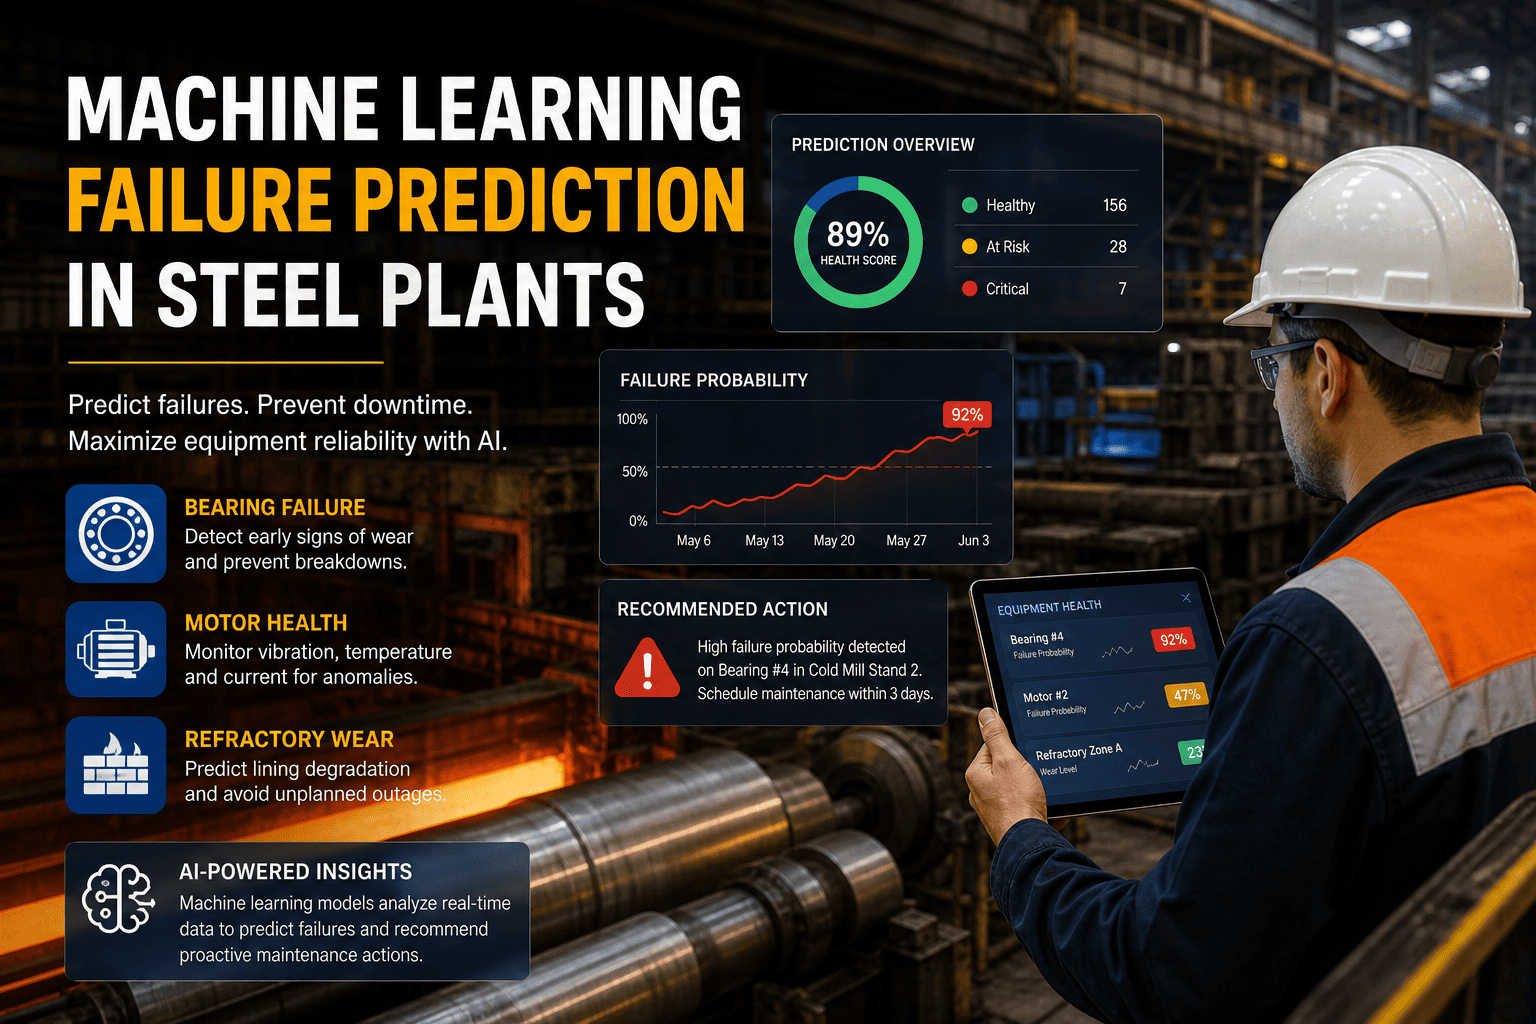
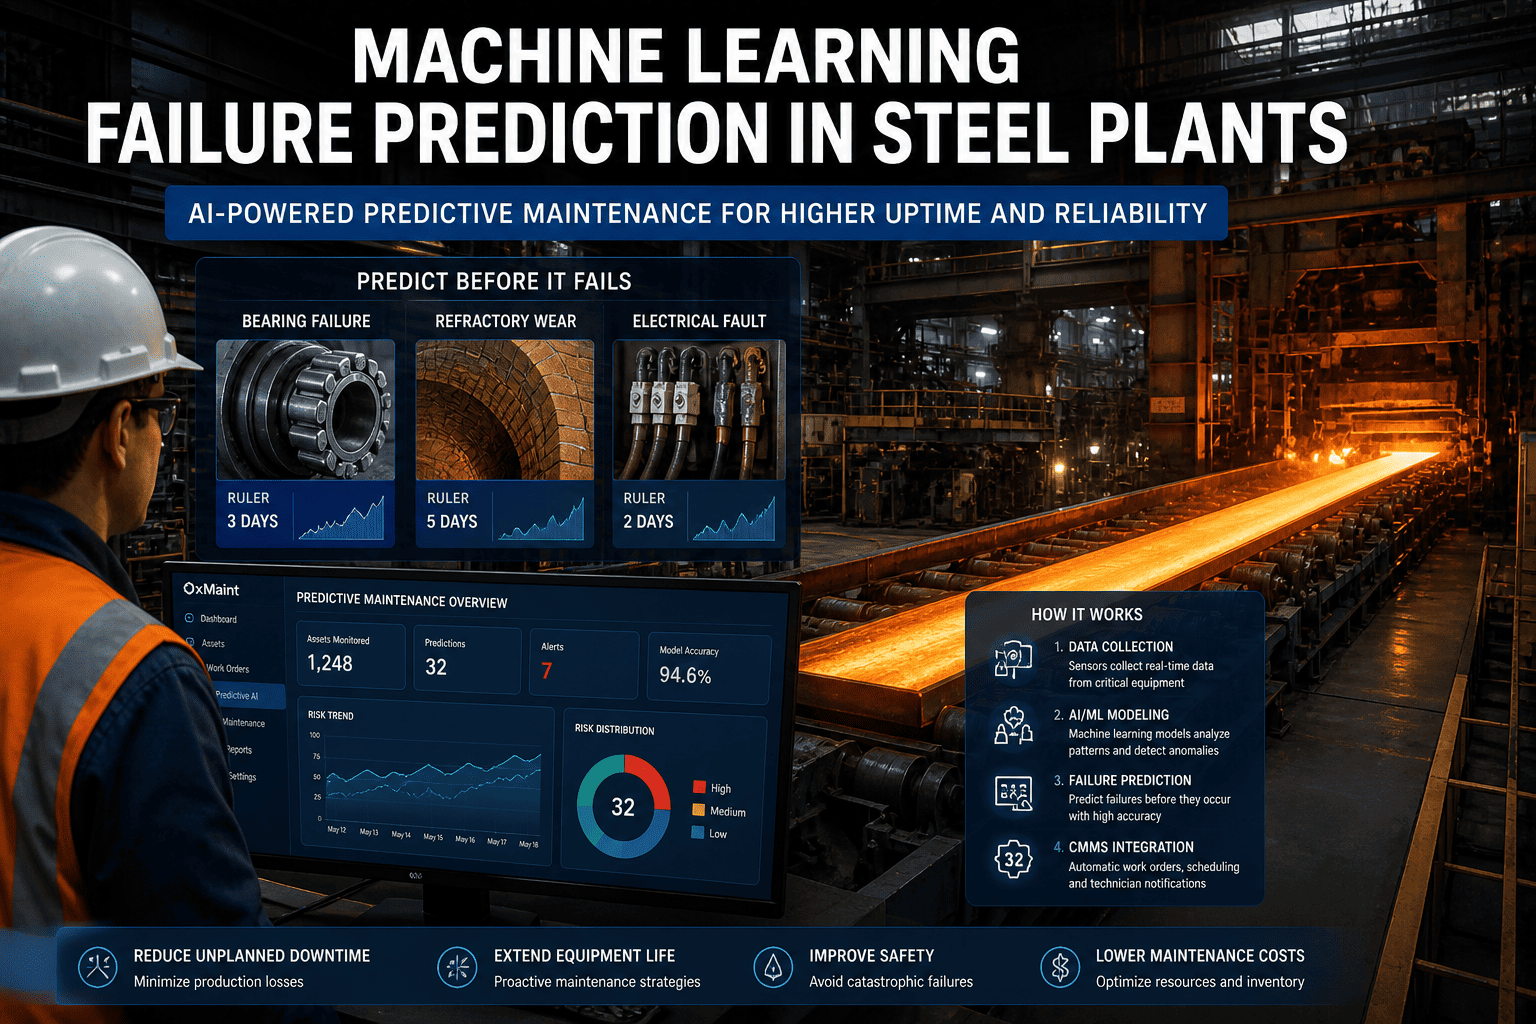
Somewhere in your steel mill right now, a bearing is dying. Not dramatically — not yet. It's not making noise. It's not running hot enough to trigger an alarm. It's not vibrating hard enough for a technician walking past to feel anything wrong. But buried in the vibration spectrum, a frequency component at 3.7× shaft speed has increased 340% over the past 11 days. A current signature analysis on the same motor shows a 0.4-amp asymmetry between phases that wasn't there three weeks ago. Oil analysis from last Tuesday found a 6× increase in iron particle count at the 10-micron size range. Any one of these signals alone is ambiguous. Together, they tell an unmistakable story: the outer race of that bearing has a developing spall defect, and at the current progression rate, it will seize in 28–35 days. No human being — no matter how experienced — can hold all three data streams in their head simultaneously, correlate the timing of the changes, separate the signal from the operational noise, and calculate a remaining useful life estimate. A machine learning model trained on thousands of bearing failure progressions can do it in milliseconds, and it just did. Work order generated. Parts ordered. Maintenance scheduled for day 22 — eight days before predicted failure, during a planned production pause. Total cost of the planned replacement: $3,200 in parts and 4 hours of labor. Total cost if the bearing had seized undetected during a rolling campaign: $180,000 in emergency repair, collateral damage to the gearbox, and 14 hours of unplanned downtime at $150,000/hour — $2.28 million. That's not a hypothetical. That's what machine learning does, every day, in steel mills that have implemented it. And it's what's not happening in the mills that haven't.
Without ML
Day 1: Defect begins. No signal detectable by humans.
Day 14: Vibration rises. Still within "normal" alarm band.
Day 25: Bearing starts running warm. Operator notes it during rounds.
Day 29: Vibration alarm triggers. Maintenance investigates.
Day 30: Bearing seizes during night shift. Gearbox damaged. Line down 14 hours.
Total cost: $2.28M
vs
With ML
Day 1: Defect begins. ML baseline shifts detected.
Day 4: Multi-signal correlation confirms bearing outer race defect.
Day 5: Work order generated. Parts ordered. RUL estimate: 28–35 days.
Day 22: Planned replacement during scheduled pause. 4 hours.
Day 30: Production running normally. Nobody noticed anything happened.
Total cost: $3,200
What Machine Learning Actually Does (and What It Doesn't)
Let's kill the buzzwords. Machine learning for equipment failure prediction isn't artificial general intelligence. It's not magic. It's not a black box that mysteriously "knows" things. It's pattern recognition at a scale and speed that humans can't match — and in a steel mill generating millions of sensor data points per day, that scale advantage is the difference between catching failures and missing them. Here's what's actually happening inside the system that OxMaint integrates into your maintenance workflow.
What ML does
Learns what "normal" looks like for each specific piece of equipment in its specific operating context — not a textbook definition, but this motor, on this gearbox, running this product mix, at this ambient temperature, at this age.
What it doesn't do
Apply generic thresholds from an equipment manual. "Vibration above 7mm/s = alarm" catches catastrophic failure. ML catches the shift from 2.1 to 2.8mm/s that predicts it 30 days earlier.
What ML does
Correlates multiple data streams simultaneously — vibration + current + temperature + oil analysis + process load + ambient conditions — to separate real degradation signals from normal operational variation.
What it doesn't do
Require exotic sensors or new instrumentation. Most steel mills already generate 80% of the data ML needs through existing BMS, PLC, drive, and process control systems. The gap is analysis, not data.
What ML does
Estimates remaining useful life (RUL) — not just "something is wrong" but "this component will likely fail in 25–35 days at current degradation rate," giving maintenance teams time to plan, order parts, and schedule.
What it doesn't do
Predict with certainty. ML gives probability ranges, not guarantees. A prediction of "failure in 25–35 days with 85% confidence" is enormously more useful than no prediction at all — but it's a forecast, not a fact.
Your Equipment Is Already Telling You What's About to Fail. ML Just Translates.
OxMaint connects machine learning failure prediction directly to your maintenance workflow — from sensor signal to diagnosis to work order to parts procurement to scheduled repair. No separate analytics platform. No manual interpretation. Signal in, work order out.
Five Failure Stories ML Would Have Caught
These aren't hypotheticals. These are the kinds of failures that happen at steel mills every month — and the specific signals that ML uses to catch them weeks before they become emergencies. For each one, the cost of catching it early versus letting it fail tells you everything about the ROI of predictive maintenance. Plants already using AI-integrated CMMS platforms like OxMaint catch these before the damage starts.
Signal 1 — Vibration: 2nd harmonic of gear mesh frequency increased 180% over 3 weeks. Invisible in overall vibration level — only visible in frequency-domain analysis.
Signal 2 — Oil debris: Online particle counter showed progressive increase in ferrous particles >25μm — consistent with gear tooth pitting propagation.
Signal 3 — Temperature: Gearbox bearing temperature 4°C above ML-predicted value for current load and ambient conditions. Small deviation, big meaning.
ML diagnosis:
Intermediate shaft gear tooth pitting — progressing toward tooth fracture
Planned repair cost:
$85,000 (gear replacement during scheduled outage)
Undetected failure cost:
$2.4M (catastrophic gearbox failure + collateral damage + 3-day unplanned outage)
Signal 1 — Current signature: Motor current spectrum developed a sideband pattern at line frequency ± pole-pass frequency, indicating developing rotor bar cracks.
Signal 2 — Torque ripple: VFD-reported torque showed increasing oscillation amplitude at low speed — consistent with rotor asymmetry from broken bars.
Signal 3 — Temperature: Stator winding temperature 6°C above predicted — rotor defect causing uneven magnetic field and additional stator heating.
ML diagnosis:
2–3 cracked rotor bars — progressing toward rotor lamination damage
Planned repair cost:
$28,000 (motor swap during caster sequence break)
Undetected failure cost:
$1.8M (motor burnout mid-cast → caster breakout → 18-hour recovery)
Signal 1 — Pressure: Hydraulic system pressure at tilting initiation required 8% more than ML-predicted for the same vessel weight and tilt angle — suggesting internal pump bypass.
Signal 2 — Flow rate: Case drain flow on the main pump increased 35% over baseline — classic signature of piston shoe or swashplate wear.
Signal 3 — Cycle time: BOF tilting cycle time increased 1.2 seconds — imperceptible to operators, clear in the data.
ML diagnosis:
Main hydraulic pump approaching catastrophic wear limit — tilting failure risk within 3–4 weeks
Planned repair cost:
$45,000 (pump rebuild during planned converter reline)
Undetected failure cost:
$3.6M (BOF unable to tap → heat lost → downstream cascade + emergency pump replacement)
Signal 1 — Vibration: Axial vibration component on the thrust bearing increased 220% at a specific once-per-revolution frequency — suggesting thrust pad deterioration.
Signal 2 — Bearing temp: Thrust bearing temperature 3°C above ML model prediction at equivalent load. Oil film thinning from pad wear.
Signal 3 — Axial position: Proximity probe showed 18μm axial position shift over 4 weeks — rotor moving toward the stationary labyrinth seals.
ML diagnosis:
Thrust bearing pad wear — rotor axial migration toward rub contact in 5–6 weeks
Planned repair cost:
$120,000 (bearing replacement during planned compressor swap to standby)
Undetected failure cost:
$5.8M (compressor wreck → BF gas flaring → production curtailment for weeks)
Signal 1 — Drive current: Turret slewing motor current increased 12% at constant rotation speed — increased friction from bearing race defect.
Signal 2 — Acoustic emission: High-frequency acoustic signatures during rotation matched trained patterns for ball-path spalling in large slewing bearings.
Signal 3 — Position error: Turret positioning repeatability degraded from ±2mm to ±6mm — mechanical looseness from bearing clearance increase.
ML diagnosis:
Slewing bearing raceway spalling — progressive failure toward seizure or catastrophic looseness
Planned repair cost:
$220,000 (bearing replacement during planned caster maintenance)
Undetected failure cost:
$4.1M (turret seizure mid-sequence → caster shutdown → ladle safety incident risk)
Five failures. Five early detections. Combined planned repair cost: $498,000. Combined undetected failure cost: $15.98M. That's the difference ML makes — a 32:1 return on the failures it catches.
From Sensor to Work Order: How the Pipeline Works
The magic isn't in any single step — it's in the automation of the entire chain. Data flows from sensors through models to decisions to actions without a human needing to stare at a dashboard waiting for something to change color.
1
Data Ingestion
Vibration, temperature, current, pressure, oil analysis, process parameters, and environmental conditions — collected from existing PLCs, drives, BMS, and IoT sensors at 1-second to 15-minute intervals depending on criticality. Most steel mills already have 70–80% of this data; the rest requires low-cost sensor additions at $200–$800 per monitoring point.
2
Baseline Learning
ML models learn what "normal" looks like for each equipment — not from a textbook, but from 4–12 weeks of operating data on that specific machine in its specific context. The model captures the relationship between operating conditions (load, speed, ambient) and equipment responses (vibration, temperature, current). After training, any deviation from this learned normal is detectable.
3
Anomaly Detection
When actual equipment behavior deviates from the learned baseline, the system flags the anomaly — quantifying the deviation across all monitored parameters simultaneously. Not "vibration is high" but "vibration at 3.7× shaft speed is 340% above baseline while current asymmetry is 0.4A and oil particle count is 6× normal." The multi-parameter view is what separates real degradation from operational noise.
4
Failure Mode Classification
The anomaly pattern is matched against a library of known failure signatures — trained from historical failure data and physics-based models. The system doesn't just say "something is wrong." It says "this pattern is consistent with bearing outer race defect" or "this pattern indicates developing gear tooth pitting." That specificity tells the maintenance team what part to order and what repair to plan.
5
Remaining Useful Life Estimation
Based on the degradation trajectory — how fast the anomaly is growing — the model estimates when the component will reach functional failure. Not a single date, but a probability distribution: "80% probability of failure between day 25 and day 35." This window enables maintenance scheduling: plan the repair for day 20, order parts now, coordinate with production planning.
6
Automated Work Order & Parts Procurement
The CMMS generates a work order with: diagnosed failure mode, affected equipment and component, estimated remaining life, recommended repair action, required parts (with current inventory status and procurement lead time), and suggested scheduling window. If the required part isn't in stock, a purchase requisition generates simultaneously. From sensor anomaly to parts on order — automated, no human interpretation bottleneck.
See how this pipeline works live in an OxMaint demo.
The Implementation Reality: What It Takes to Get Here
ML-based failure prediction doesn't require rebuilding your plant's instrumentation from scratch. It requires connecting what you already have, filling a few gaps, and giving the models time to learn. Here's the honest timeline — not a vendor sales pitch, but what actually happens when steel plants deploy this through OxMaint.
Months 1–2
Connect & Collect
Connect existing data sources (PLCs, drives, BMS, historians). Identify gaps — typically 20–30% of critical equipment lacks sufficient monitoring. Install low-cost IoT sensors where needed. Begin data collection for ML training. Most plants see the first "quick win" value here: simply centralizing data from disconnected systems reveals equipment running outside normal parameters that nobody was watching.
Months 2–4
Baseline & First Detections
ML models trained on initial data establish equipment baselines. Anomaly detection begins for the highest-criticality equipment (main drives, critical pumps, process-critical motors). Expect false positives at 10–20% initially — the models are learning. Each confirmed or rejected alert improves the model. First real failure detections typically appear in months 3–4, proving value to skeptical maintenance teams.
Months 4–8
Diagnose & Predict
With enough operational data (including confirmed failure events), the models move from anomaly detection to failure classification and RUL estimation. False positive rates drop below 8%. Work order automation activates — ML alerts generate CMMS work orders directly. Coverage expands from critical equipment to secondary assets. This is where the ROI curve steepens dramatically.
Months 8–12+
Optimize & Scale
Models continuously refine as they ingest more data and more confirmed outcomes. Coverage extends to rolling mills, casting equipment, utilities, and auxiliary systems. Maintenance scheduling becomes proactively planned around predicted failure windows rather than reactively driven by breakdowns. Calendar-based PM intervals begin adjusting based on actual equipment condition data — extending intervals on healthy equipment and shortening them on degrading equipment.
Month 1: Connect Your Data. Month 4: Catch Your First Failure. Month 12: Transform Your Maintenance.
OxMaint integrates ML failure prediction with your complete maintenance operation — work orders, parts inventory, scheduling, and crew assignment. From sensor signal to completed repair, one platform manages the entire predictive maintenance workflow.
ROI: What 30 Days of Warning Is Actually Worth
$9.2M
Prevented Catastrophic Failures & Avoided Downtime
8–15 major failures prevented annually, each avoiding $200K–$3M+ in emergency repair, collateral damage, and production loss
$3.8M
Optimized Maintenance Scheduling
Condition-based timing replaces calendar PM — extending intervals on healthy equipment, shortening on degrading, reducing total maintenance labor 15–25%
$2.4M
Eliminated Collateral Damage
Catching bearing failures before they damage gearboxes, motor failures before they damage drives, pump failures before they contaminate systems
$1.6M
Parts & Procurement Optimization
Planned procurement eliminates emergency expediting premiums (30–200% above standard pricing) and air freight costs
What the Maintenance Manager Said After Year One
"
I was the biggest skeptic on the plant management team when we piloted ML-based predictive maintenance. Twenty-two years of steel mill maintenance — I'd seen plenty of technology promises that didn't survive first contact with reality. Here's what actually happened.
We started with 30 critical assets across the hot strip mill and caster: main drive motors, gearboxes, hydraulic systems, and cooling water pumps. Three months in, the system flagged a developing inner race defect on our finishing mill F4 stand main drive bearing. Vibration was 3.1mm/s overall — well below our 7mm/s alarm threshold. But the ML model showed that a specific frequency component had increased 280% over two weeks, correlating with a temperature deviation of 2.5°C above prediction. My senior vibration analyst looked at the data and said, "I wouldn't have caught this for another month. It's buried in the noise."
We scheduled the replacement during a planned roll change — 6 hours of production time we were going to use anyway. The old bearing had a visible spall defect on the outer race, confirmed by the bearing manufacturer as 3–5 weeks from catastrophic failure. The emergency replacement on that bearing — if it had seized during a rolling campaign — would have been a 36-hour outage at $180K/hour: $6.5 million. The planned replacement cost $12,000.
After that, I stopped being a skeptic. After 12 months, the system had flagged 11 developing failures across the 30 monitored assets. Nine were confirmed and repaired before failure. Two were false positives that cost us nothing except inspection time. Our unplanned downtime on the monitored assets dropped 64%. The maintenance team's biggest complaint? "Why aren't we monitoring everything yet?"
Start with 20–30 critical assets — prove value fast, expand based on results
Accept initial false positives — each one teaches the model, and accuracy improves rapidly
When ML catches its first real failure, let the skeptics examine the data — evidence converts faster than arguments
The biggest ROI isn't the failures you catch — it's the collateral damage you prevent by catching them early
Every minute, your steel mill equipment generates data that contains the early warning signals of the next failure. The question is whether that data gets analyzed by ML models that can detect a bearing defect 30 days before it seizes — or whether it sits in a historian database until somebody asks "what happened?" after the line is already down. The technology exists. The ROI is proven. The only variable is whether you deploy it before or after the next $2M failure that didn't have to happen. Explore how OxMaint's predictive maintenance platform integrates machine learning into your daily maintenance workflow, or book a demo to see the sensor-to-work-order pipeline running on live steel mill data.
The Next Failure Is Already Starting. The Data Already Shows It. The Question Is Whether You're Watching.
OxMaint brings machine learning failure prediction into your maintenance operation — not as a separate analytics dashboard, but as an integrated part of every work order, every parts order, and every scheduling decision. From sensor anomaly to completed repair, one platform.
Frequently Asked Questions
How much historical failure data does ML need to start working?
Less than you'd think. Anomaly detection (identifying deviations from normal) needs only 4–12 weeks of normal operating data — no failure examples required. Failure classification and RUL estimation improve with historical failure data but can start with physics-based models and manufacturer failure libraries, then refine as your plant generates its own confirmed failure events.
What about false positives? Won't maintenance teams lose trust?
Initial false positive rates of 10–20% drop below 8% within 4–6 months as models learn from feedback. The key: every alert should be easy to confirm or reject with one click. Rejected alerts train the model. Within 6 months, most maintenance teams trust the ML alerts more than their own alarm systems because the ML catches things the alarms miss.
Does this replace vibration analysts and condition monitoring technicians?
No — it multiplies their effectiveness. Instead of manually analyzing thousands of data points hoping to spot anomalies, they focus on the 5–10 ML-flagged alerts that need expert judgment. The analyst goes from "searching for problems" to "confirming and acting on identified problems." Most plants redeploy saved analysis time to expanding monitoring coverage.
What's the minimum sensor investment for a steel mill to get started?
Most mills already have 70–80% of the needed data in PLCs, drives, and historians. Typical gap-filling for 30 critical assets costs $50K–$150K in additional sensors (wireless vibration, CT clamps, temperature probes). The first-year platform and integration cost is $200K–$500K. Payback typically occurs within the first prevented major failure — often by month 3–4.
Can ML predict failures on older equipment without modern instrumentation?
Yes, with added sensors. Older equipment often has simpler failure modes (bearing wear, insulation degradation, belt deterioration) that are easier for ML to detect than complex modern system failures. A $200 wireless vibration sensor on a 1980s motor provides enough data for effective bearing and imbalance prediction. The equipment's age doesn't limit ML — only the absence of data does.