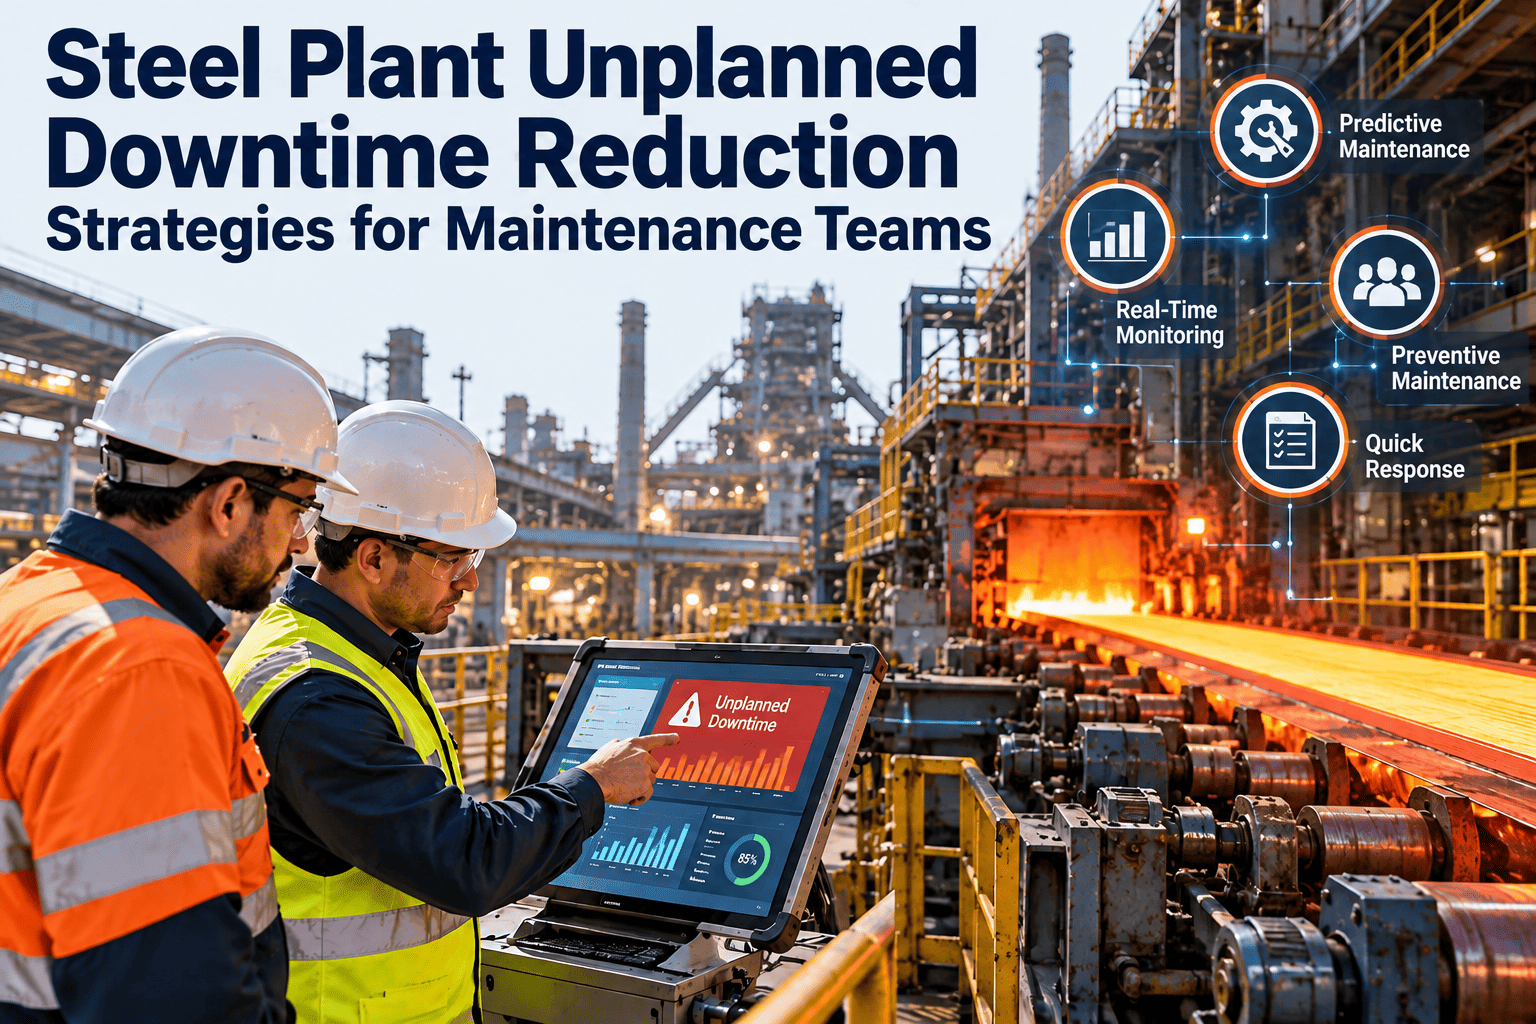
At 2:47 AM on a Tuesday, a hydraulic pump on the hot strip mill's automatic gauge control fails. The mill stops. Within six minutes, the run-out table is holding steel that's cooling below rollable temperature — three slabs that are now scrap. Within twenty minutes, the caster is forced to reduce speed because the slab yard buffer is full and the mill can't accept material. Within forty-five minutes, the BOF is holding a heat that can't be cast, tying up the vessel and delaying the next charge. Within two hours, the blast furnace is banking because there's nowhere to send hot metal. One hydraulic pump. One failure. Four hours to diagnose, source a seal kit, and restore the system. Total production loss: not the four hours of mill downtime — that's the number everyone reports — but the twelve hours of cascading disruption across the entire integrated plant as each upstream process backed up, slowed down, restarted out of sequence, and worked through the queue of delayed material. The direct cost of that hydraulic pump failure wasn't the $340 seal kit. It wasn't even the $15,000 in maintenance labor. It was $1.2 million in lost production, scrapped material, energy waste, and schedule disruption. And it was preventable. The pump had been showing elevated temperature readings for three weeks. A vibration route two months earlier flagged a bearing defect at the incipient stage. The CMMS had a PM work order for hydraulic system inspection that was 11 days overdue because nobody prioritized it. This is what unplanned downtime actually looks like in a steel plant — not a single equipment failure but a cascade of consequences that multiplies the cost of every lost minute by factors of 10 to 100.
What Unplanned Downtime Actually Costs a Steel Plant
$50K–$200K
per hour
Hot Strip Mill
$80K–$300K
per hour
Continuous Caster
$100K–$500K
per hour
Blast Furnace (unplanned bank)
Typical integrated mill: 200–600 hours of unplanned downtime per year
$25M–$80M annual cost of unplanned stops
The Anatomy of a Cascade: How One Failure Becomes a Plant-Wide Crisis
Steel plants are tightly coupled systems — every process feeds the next with minimal buffer. A failure at any point doesn't just stop that process; it propagates upstream and downstream at a rate determined by buffer capacity and process interdependency. Understanding the cascade mechanics is essential for prioritizing where to invest in prevention. Facilities that sign up to track equipment failures and cascading impacts in a centralized CMMS can quantify the true cost of each failure event — not just the repair, but the full cascade.
T+0
Equipment Failure
The component fails. The process stops. The clock starts.
Direct repair cost only
T+5 min
Immediate Process Impact
Material in-process at the failed equipment is compromised. Hot steel cools below spec. Chemistry drifts. Product in the line becomes scrap or downgrade.
+ Scrap & downgrade cost
T+15 min
Downstream Starvation
Processes after the failure point run out of material. Run-out table clears. Finishing line empties. Shipping schedule gaps open.
+ Downstream idle cost
T+30 min
Upstream Backup
Buffers between the failure point and upstream processes fill. The caster slows. The BOF holds heats. The blast furnace reduces wind rate. Each upstream process degrades independently — energy is wasted maintaining temperature on material going nowhere.
+ Upstream slowdown & energy waste
T+2 hr
Full Plant Impact
The entire integrated chain is disrupted. Scheduling across all processes is broken. Recovery will take 2–3× the actual repair duration as each process restarts, re-synchronizes, and works through the backlog of delayed material.
+ Recovery time (2–3× repair time)
T+8 hr
Total Impact Zone
A 4-hour repair becomes 8–12 hours of production impact. The true cost is 5–15× the direct repair cost. Customer shipments are delayed. Overtime is authorized across multiple departments. The root cause investigation begins — usually discovering that the failure was detectable weeks or months earlier.
Total: 5–15× direct repair cost
The Top 8 Causes of Unplanned Downtime in Steel Plants
Unplanned downtime isn't random. The same categories of failure cause 80–90% of unplanned stops at every integrated steel mill. The specifics vary by plant age, equipment vintage, and maintenance maturity — but the pattern is remarkably consistent.
1
Bearing Failures — Conveyors, Rollers, Drives
18–25% of all unplanned stops
The single largest category. Thousands of bearings operating in heat, dust, water, and shock conditions. Failure modes: lubricant degradation, contamination, fatigue spalling, brinelling from impact loads. Most bearing failures are detectable 3–6 months in advance through vibration monitoring — but only 35–45% of steel plant bearings are on a monitoring program.
CMMS solution: Vibration route management, lubrication PM scheduling, bearing life tracking by asset, automatic work order generation from condition monitoring alerts
2
Hydraulic System Failures
12–18% of all unplanned stops
AGC systems, roll bending, segment clamping, descaling headers, and hundreds of other hydraulic actuators. Failure modes: seal degradation, contamination-induced valve failure, pump wear, hose burst, and accumulator precharge loss. Oil contamination is the root cause of 70–80% of hydraulic failures — and is directly preventable through filtration and oil analysis programs.
CMMS solution: Oil sampling schedules, filter change tracking, hose replacement by age/cycle count, hydraulic pressure trending linked to PM triggers
3
Electrical & Drive System Failures
10–15% of all unplanned stops
Main mill drives, caster drives, conveyor motors, and power distribution. Failure modes: insulation breakdown from heat and contamination, VFD component failure, motor bearing failure, cable degradation, and protection relay trips. Catastrophic motor failures on critical drives create the longest unplanned stops — 24–72 hours if the spare isn't available.
CMMS solution: Motor insulation test scheduling, drive component PM, critical spare management with min/max levels, electrical thermography routes
4
Refractory Failures
8–12% of all unplanned stops
BOF lining, ladle lining, tundish lining, EAF panels, and reheating furnace walls. Failure modes: erosion from slag attack, thermal spalling, joint failure, and breakouts from refractory penetration. Refractory failures at the BOF or ladle level create safety-critical situations and the longest recovery times — 8–48 hours depending on severity.
CMMS solution: Heat count tracking per lining, remaining thickness monitoring schedules, refractory inspection records linked to replacement planning
5
Cooling Water System Failures
6–10% of all unplanned stops
Caster mold cooling, spray cooling, roll cooling, and furnace cooling circuits. Failure modes: nozzle plugging, pipe scaling, pump failure, heat exchanger fouling, and cooling tower degradation. Water system failures at the caster are emergency-level events — loss of mold cooling can cause breakouts within minutes.
CMMS solution: Water quality testing schedules, nozzle inspection routes, pump PM programs, cooling tower maintenance, flow rate trending with alarm thresholds
6
Roll & Guide Failures
5–9% of all unplanned stops
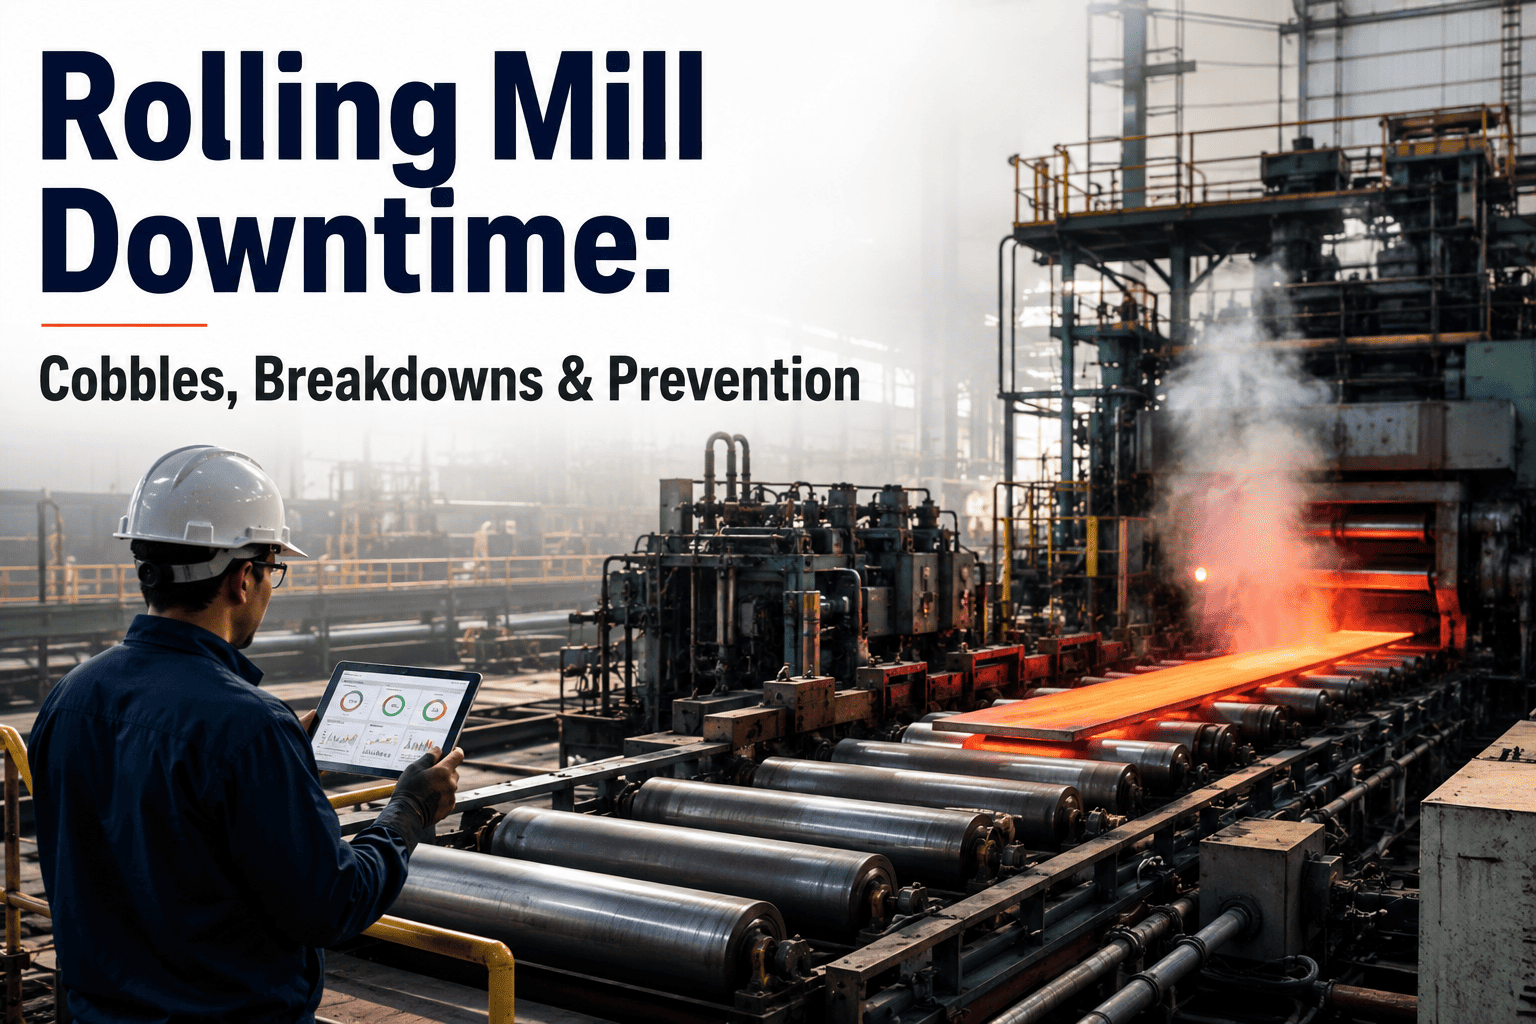
Work rolls, backup rolls, segment rolls, and entry/exit guides across the rolling mill. Failure modes: thermal fatigue cracking, spalling, bearing seizure, and guide wear causing strip mistrack or cobbles. A cobble in the hot strip mill requires 1–4 hours to clear and can damage multiple stands and interstand equipment.
CMMS solution: Roll campaign tracking (tons rolled, surface condition), guide wear measurement scheduling, roll shop grinding/inspection records, roll inventory management
7
Instrumentation & Sensor Failures
4–7% of all unplanned stops
Level sensors, temperature probes, flow meters, position encoders, and quality measurement systems. The failure itself may not stop production — but the process control system's response to a failed sensor can. A mold level sensor failure triggers automatic caster speed reduction or stop. A gauge measurement failure forces the mill into manual mode with reduced capability.
CMMS solution: Sensor calibration scheduling, redundant sensor PM staggering, sensor lifespan tracking by environment severity, spare sensor management
8
Material Handling & Crane Failures
3–6% of all unplanned stops
Hot metal cranes, scrap handling, slab/coil transport, and ladle handling. Failure modes: hoist motor/gearbox failure, bridge/trolley drive breakdown, brake failure, and crane electrical/control issues. Crane failures at the BOF or caster create complete process stops because there's no alternate path for material flow.
CMMS solution: Crane inspection schedules (OSHA + enhanced), hoist rope replacement tracking, brake inspection/adjustment PM, gearbox oil analysis programs
Every Hour of Unplanned Downtime Has a Six-Figure Price Tag. Most of Them Are Preventable.
OxMaint gives your maintenance team the tools to prevent failures before they cascade — PM scheduling that doesn't slip, condition monitoring alerts that generate automatic work orders, spare parts management that ensures the right part is available when you need it, and failure tracking that reveals the patterns behind repeat events.
How a CMMS Prevents Unplanned Downtime: The Five Defense Layers
A properly deployed CMMS doesn't just schedule PMs — it creates a multi-layered defense system where each layer catches failures that slip through the one above it. The goal is not zero maintenance — it's zero surprises.
Defense Layer 1
Preventive Maintenance Execution
Eliminates 40–50% of unplanned failures
The foundation. Calendar-based and usage-based PM tasks scheduled, assigned, and tracked to completion. The CMMS ensures nothing is overdue, nothing is skipped, and every task is documented. PM compliance above 90% is the single most impactful metric for reducing unplanned downtime. Most steel plants run at 65–80% PM compliance without a CMMS — leaving 20–35% of critical maintenance undone or late.
Auto-scheduling from equipment master data
Mobile work order completion with checklists
Overdue PM escalation alerts to supervisors
PM compliance dashboards by area and crew
Defense Layer 2
Condition-Based Maintenance Integration
Catches 25–35% of failures that PMs miss
Vibration, thermal, ultrasonic, and oil analysis data fed into the CMMS creates automatic work orders when equipment condition deteriorates beyond acceptable thresholds. The CMMS closes the gap between "we detected a problem" and "we fixed it" — which in plants without integration can be weeks or months of reports sitting in email inboxes.
Condition monitoring alert → auto work order
Severity-based priority assignment
Automatic parts reservation from BOM
Trend history linked to asset record
Defense Layer 3
Failure Pattern Analysis
Identifies 15–20% of recurring failures for elimination
Every failure recorded in the CMMS builds a searchable database of what failed, where, when, why, how long it took to fix, and what it cost. Pattern analysis reveals chronic problems hiding behind different symptoms — the same root cause producing failures across multiple assets that nobody connected because the work orders went to different crews.
Failure code standardization across the plant
Pareto analysis by equipment, area, and failure mode
MTBF/MTTR trending with statistical alerts
Root cause analysis workflow with corrective action tracking
Defense Layer 4
Spare Parts & Materials Readiness
Reduces repair duration 30–50% when failures do occur
When an unplanned failure happens despite prevention layers 1–3, repair speed determines the production impact. The CMMS maintains equipment-to-BOM linkages, tracks critical spare inventory with automatic reorder, and ensures that when a work order is created, the parts needed are identified, reserved, and staged before the wrench turns.
Equipment BOM with linked spare parts
Min/max inventory with auto-reorder triggers
Kitting and staging for planned outages
Vendor lead time tracking for critical spares
Defense Layer 5
Outage & Shutdown Optimization
Recovers 10–20% of planned outage time for additional work
Planned outages are the controlled alternative to unplanned downtime. The CMMS batches corrective work orders, condition-based interventions, and PM tasks into optimized outage packages — maximizing the maintenance accomplished during each planned stop and reducing the frequency and duration of planned outages by improving their efficiency.
Outage work list aggregation from multiple sources
Task sequencing and resource leveling
Critical path scheduling with milestone tracking
Post-outage review with scope completion metrics
Before & After: Steel Plant Maintenance With a CMMS
ROI: CMMS Implementation for Steel Plant Downtime Reduction
$8.5M
Unplanned Downtime Reduction
25–40% reduction in unplanned hours × $100K–$200K/hour average cascade cost across the integrated plant
$3.2M
Maintenance Labor Efficiency
Wrench time improved from 28–35% to 45–55% through better planning, scheduling, parts readiness, and reduced emergency response
$1.8M
Spare Parts Inventory Optimization
15–25% inventory reduction while improving critical parts availability from 82% to 96% through usage-based min/max
$1.2M
Planned Outage Optimization
Outage duration reduced 15–25% through better planning, resource coordination, and scope management
$800K
Regulatory & Safety Compliance
Documented PM completion eliminates compliance gaps, reduces audit findings, and provides defense in incident investigations
Expert Perspective: What CMMS Success Actually Looks Like in Steel
"
I've implemented CMMS systems at three steel plants. The technology is the easy part — the transformation is cultural. At our first plant, we installed the software, loaded the equipment list, and set up the PM schedules. Within six months, the system was becoming a graveyard of overdue work orders because we hadn't changed how the maintenance organization operated. Here's what actually works. First, start with PM compliance as the only KPI for the first 90 days. Don't try to optimize scheduling, track costs, or run analytics. Just get PM completion above 90%. This one metric, relentlessly pursued, drives the cultural change that makes everything else possible. When PMs actually get done on time, failures drop. When failures drop, there's less emergency work. When there's less emergency work, there's more time for PMs. The flywheel starts turning. Second, connect the CMMS to condition monitoring from day one. The biggest quick win in any steel plant is turning vibration and thermal alerts into automatic work orders with the right priority, the right parts, and the right procedures. Before the CMMS, our vibration analyst emailed reports that sat in inboxes for weeks. After integration, a bearing alert goes from detection to planned work order in minutes — and the planner sees it in tomorrow's schedule, not next month's review meeting. Third, track every unplanned event with the real cost — not just the repair hours, but the production lost. When the maintenance team can show that a $500 PM prevented a $500,000 cascading failure, the budget conversation changes permanently.
Start with PM compliance as the sole KPI for 90 days — get above 90% before optimizing anything else
Connect condition monitoring alerts to auto-generated work orders — close the detection-to-action gap
Track full cascade costs — a $500 PM that prevents a $500K failure changes the budget conversation forever
The technology is easy — the culture change is hard. Pursue PM compliance relentlessly and the flywheel starts
Unplanned downtime is the single largest controllable cost in steel plant operations — and the majority of it is preventable with disciplined maintenance management. A CMMS doesn't eliminate equipment failures, but it eliminates surprises by ensuring that every PM gets done, every condition alert becomes a work order, every failure builds the knowledge base, and every repair has the parts it needs. If you're ready to start reducing the $25M–$80M annual cost of unplanned downtime, book a free demo to see how steel plant maintenance management works on the OxMaint platform.
Stop Reacting. Start Preventing. Every Unplanned Hour Has a Six-Figure Cost.
OxMaint is built for heavy industry — mobile work orders in the mill, PM scheduling that scales to 50,000+ assets, condition monitoring integration, spare parts management, and failure analytics that reveal where your downtime dollars actually go.
Frequently Asked Questions
How quickly can a CMMS reduce unplanned downtime in a steel plant?
The timeline follows a predictable curve based on implementation maturity. In months 1–3, the primary impact comes from PM compliance improvement — simply getting overdue maintenance tasks completed on schedule eliminates the most obvious failure risks. Plants typically see a 10–15% reduction in unplanned events during this phase. In months 3–6, condition monitoring integration begins generating automatic work orders from existing monitoring programs, closing the detection-to-action gap that allows known problems to become failures. This adds another 10–15% reduction. In months 6–12, failure pattern analysis from accumulated CMMS data identifies chronic problems and drives root cause elimination — the maintenance team isn't just preventing individual failures but eliminating failure modes entirely. This contributes another 5–10% reduction. The cumulative effect after 12 months is typically 25–40% fewer unplanned downtime hours. After 24 months, with mature data analytics and optimized PM intervals based on actual equipment behavior rather than manufacturer defaults, the best-performing plants achieve 40–55% reduction. The key accelerator is data quality — plants that enforce disciplined failure coding and repair documentation from day one reach maturity faster because their analytics have better input data.
What's the biggest challenge in implementing a CMMS at a steel plant?
The single biggest challenge is getting maintenance technicians to use the system consistently. Steel plant maintenance culture has historically been hands-on, experience-driven, and skeptical of computer systems. Technicians who have been fixing equipment for 20+ years see the CMMS as administrative overhead that takes them away from "real work." The solution is three-fold. First, make the system genuinely useful to the technician — not just to management. Mobile work orders that show the procedure, the parts list, and the equipment history are a tool that helps the tech do their job better, not a bureaucratic reporting requirement. When a mechanic opens a work order and sees "last time this pump failed, it was the shaft seal — here's the procedure and the seal is in bin A-14," the system sells itself. Second, keep data entry minimal and mobile-friendly. Every tap beyond what's necessary reduces adoption. Completion confirmation, failure code selection, and meter readings should take under 60 seconds on a phone. Third, demonstrate value back to the floor. When PM compliance data shows that Area 3 had zero unplanned stops last month while Area 4 (with lower compliance) had four, the connection between CMMS discipline and fewer midnight callouts becomes visceral for the maintenance crew.
How does a CMMS handle the scale of a steel plant — tens of thousands of assets?
Steel plant CMMS implementations require a structured asset hierarchy that organizes 15,000–50,000+ maintainable assets into a navigable, manageable structure. The hierarchy typically follows: Plant → Area (Ironmaking, Steelmaking, Casting, Rolling, Finishing) → System (Hot Strip Mill, Continuous Caster #1) → Equipment (Roughing Stand, F1 Stand, Run-Out Table Section 3) → Component (Drive Motor, Gearbox, Work Roll Bearing). PM schedules, failure tracking, and cost recording happen at the equipment and component levels, while reporting rolls up through the hierarchy for management visibility. The implementation approach for this scale is phased: start with the 500–1,000 most critical assets (typically defined as equipment whose failure stops a major process), build the PM programs for those assets, prove the system works, then expand area by area. Trying to load all 50,000 assets simultaneously is the most common implementation failure — it takes 12–18 months and the system delivers no value until everything is loaded. The phased approach delivers value in months, builds organizational capability progressively, and creates internal champions who drive expansion based on proven results.
What KPIs should a steel plant track in the CMMS to measure downtime reduction?
The essential KPIs form a hierarchy from leading indicators (predictive of future performance) to lagging indicators (measuring outcomes). Leading indicators include PM compliance rate (target: 92%+ on-time completion), PM schedule adherence (planned vs actual completion dates), planned vs unplanned work ratio (target: 80%+ planned), and work order backlog (total pending corrective work orders by priority and age). Operational indicators include Mean Time Between Failures (MTBF) by critical equipment — trending upward indicates improving reliability; Mean Time To Repair (MTTR) — trending downward indicates improving response capability; equipment availability by process area; and wrench time (percentage of maintenance hours spent on actual repair versus waiting, traveling, and searching for parts). Outcome indicators include total unplanned downtime hours per month by area, unplanned downtime cost (including cascade impact), maintenance cost per ton of production, and spare parts inventory turns. The critical discipline is measuring cascade cost — not just the repair time at the failed equipment but the total production impact across the integrated plant. Without this metric, a $500 bearing repair looks trivial when it actually prevented a $200K cascade. With it, every PM and condition-based intervention is valued at its true prevention worth.
How does a CMMS integrate with existing condition monitoring and automation systems?
Modern CMMS platforms integrate with condition monitoring and plant automation through several pathways. Direct API integration connects the CMMS to vibration monitoring platforms (SKF, Emerson, Pruftechnik), thermal imaging systems, and oil analysis laboratories. When a monitoring system flags a condition alert above the configured threshold, the API call creates a work order in the CMMS automatically — with the alert details, severity level, recommended action, and linked spare parts populated from the equipment BOM. OPC connectivity allows the CMMS to receive operational data from the plant's DCS/SCADA systems — equipment running hours, cycle counts, process parameters, and alarm events. This enables usage-based PM triggering (schedule a PM after 5,000 operating hours rather than every 6 months) and provides operational context for failure analysis. For plants with older monitoring systems that lack API capability, file-based integration (automated CSV/XML file transfer) or middleware platforms bridge the gap. The integration priority should be: first, vibration monitoring to CMMS (highest failure prevention value); second, oil analysis lab results to CMMS; third, operational data from DCS for usage-based PM triggering; fourth, thermal imaging route results. Each integration incrementally closes the gap between detection and action — which is where the majority of preventable downtime currently escapes.