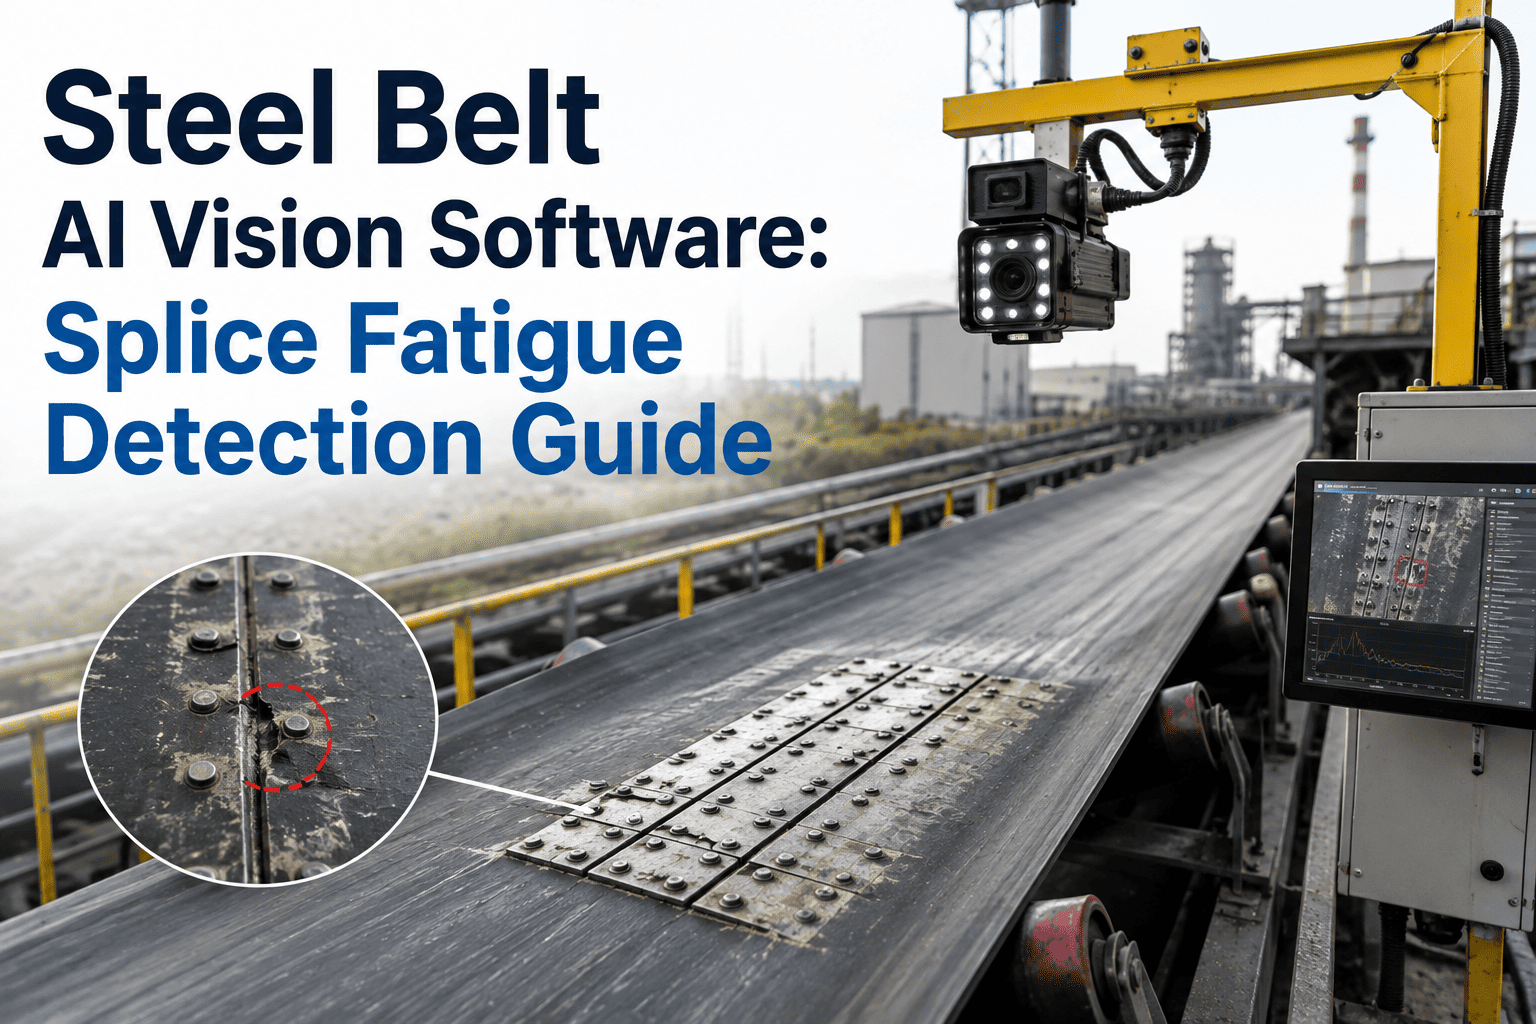
Steel plant conveyor belts move sinter, coke, ore, and finished coils around the clock, and the weakest point on any belt is almost always the splice. A mechanical or vulcanized splice loosens under cyclic tension, cover rubber cracks near the edge, or a tramp-metal gouge grows into a longitudinal rip — and none of it happens overnight. It builds quietly across weeks in the dusty, poorly lit gap between shift walkdowns, until a night-shift operator hears the belt slap and the whole line stops. AI vision cameras mounted along the belt path close that gap by recording every meter of belt surface on every single pass, and machine-learning models trained on splice geometry, cover wear, and edge fraying turn those frames into a live health score for each conveyor. This guide breaks down how steel plants are deploying belt-vision software alongside a CMMS to catch splice fatigue before it becomes a shutdown, and you can see it work on your own belt line with a Start Free Trial of Oxmaint.
Your belt splice is failing right now. The question is whether anyone is watching.
Splice separation is the single most common cause of sudden, unplanned conveyor stoppage in steel plants. AI vision cameras watch every splice, every cover panel, and every edge on every pass — turning invisible wear into a health score your CMMS can act on before the belt tears.
The four damage patterns that end in a shutdown
A steel plant belt carries hot sinter, sharp scrap, and abrasive ore across hundreds of meters, often through enclosed galleries where a technician only walks the line once or twice per shift. Damage accumulates in the hours between those walkdowns, and by the time it is visible to the eye, the repair window has already closed.
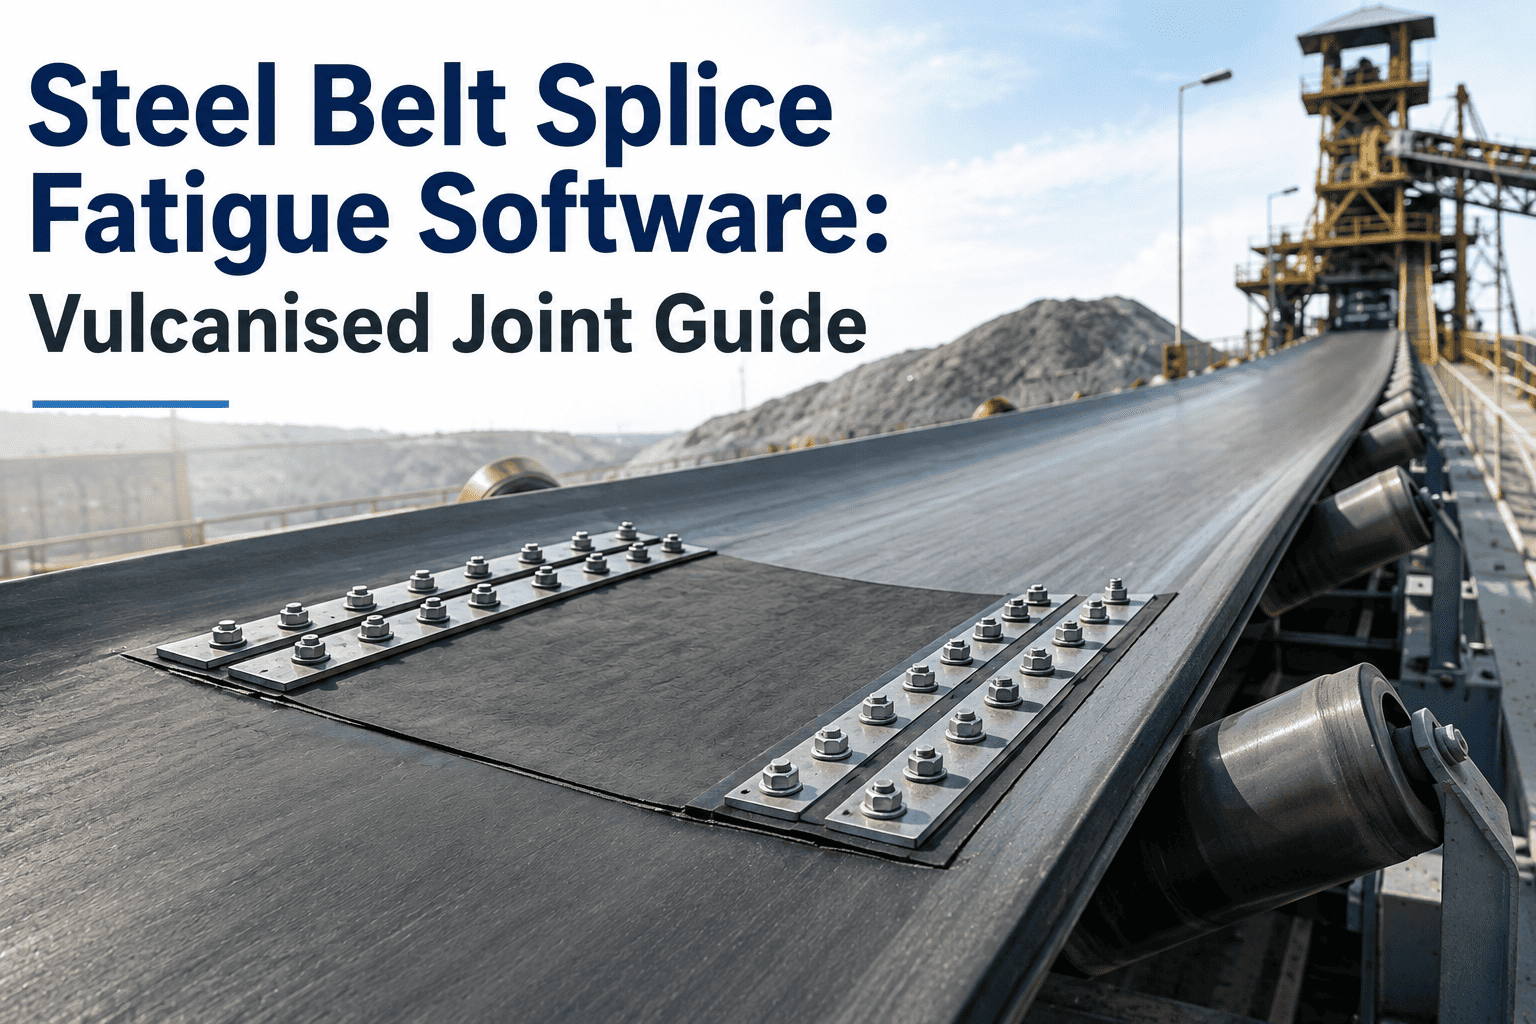
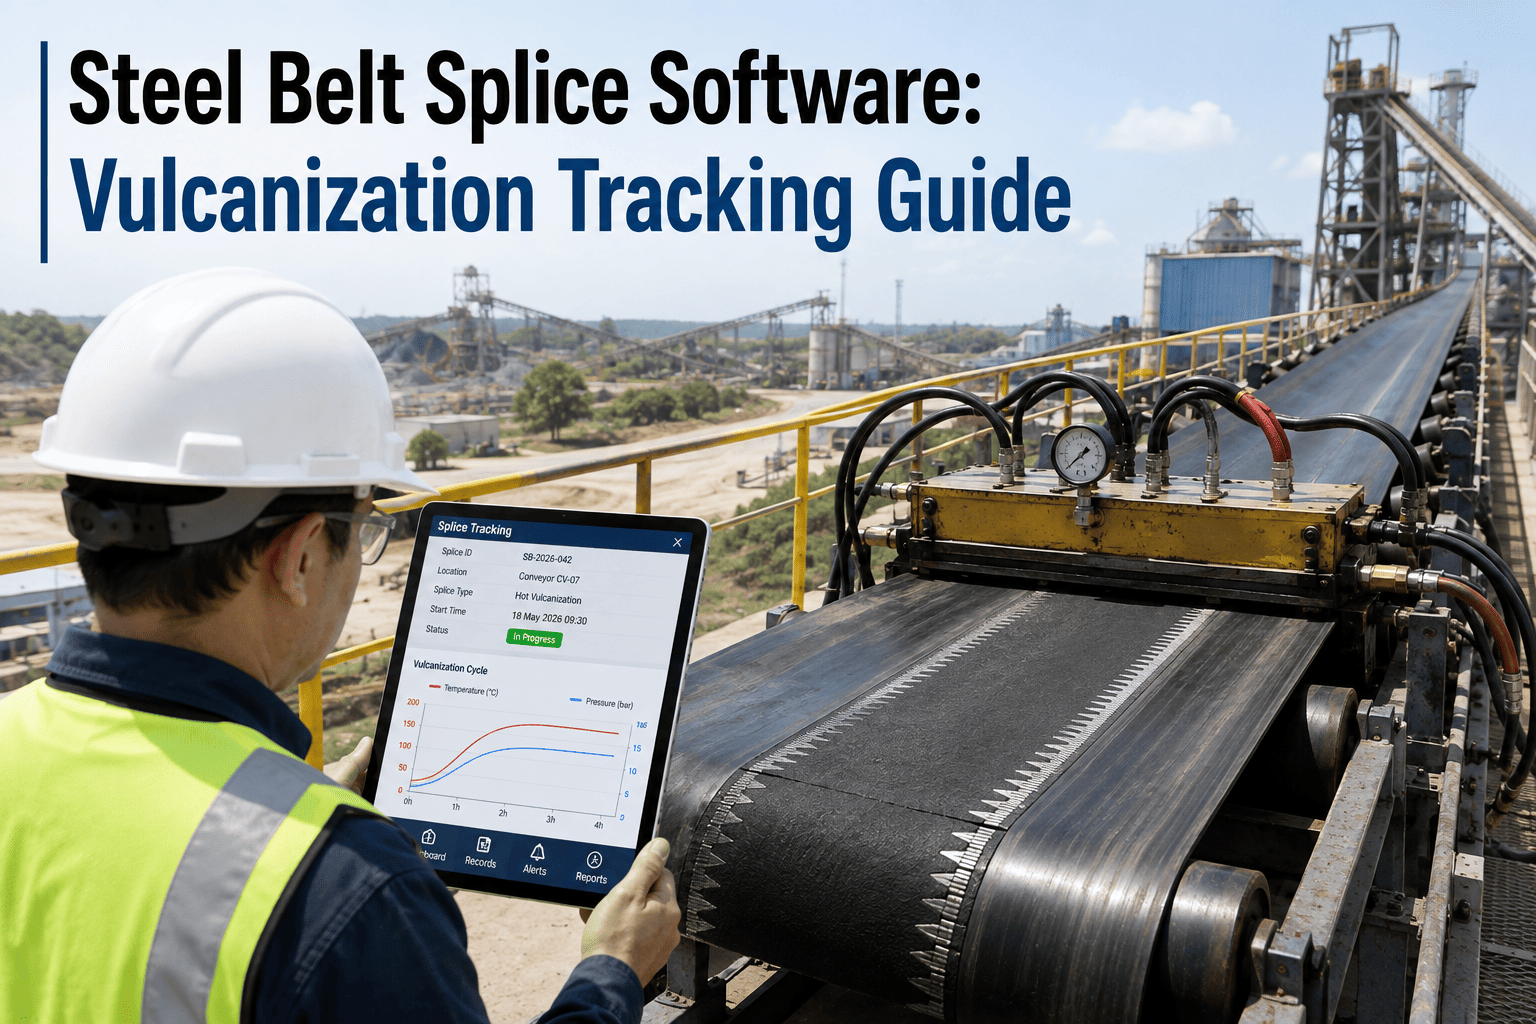
Mechanical fasteners loosen and vulcanized joints delaminate under repeated flex cycles. A splice that looks intact from a distance can already be shedding clips or separating at the ply, and once it lets go the belt can tear apart in seconds.
Heat from hot sinter and coke, combined with UV exposure at outdoor transfer points, dries out the rubber cover. Fine surface cracking spreads into deep gouges that expose the carcass fabric or steel cords underneath.
Misaligned idlers and tight chute clearances chew into the belt edge continuously. Left unmonitored, edge wear removes the belt's structural margin and eventually reaches the load-bearing carcass itself.
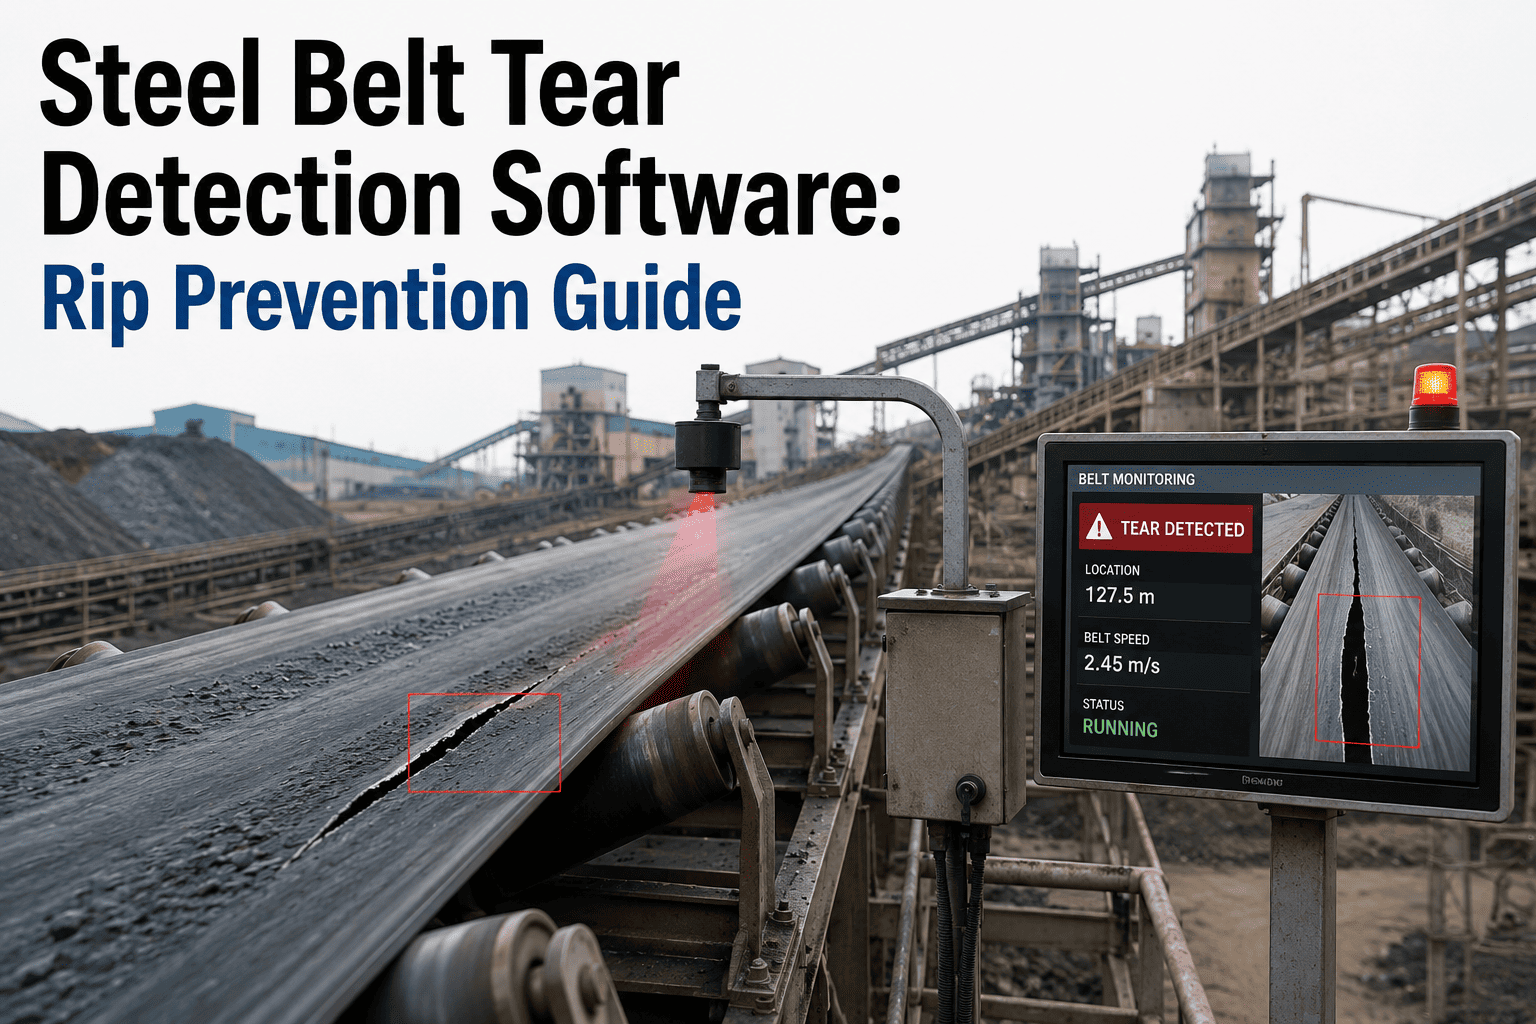
Scrap fragments, bolts, and broken liner plates puncture the cover on impact. A single unnoticed puncture becomes an entry point for moisture and material that widens into a full-thickness tear within days.
Six things AI vision tracks on every single pass
Fixed cameras positioned along the return or carry side capture the full belt width at line speed. A trained detection model classifies each frame, measures change against the previous pass, and logs anything that trends the wrong direction.
The model measures fastener spacing, staple alignment, and splice-line straightness against a baseline scan, flagging any shift that signals loosening.
Surface crack density and depth are scored per square meter, with growth-rate trending across weeks of scans, not a single snapshot.
Belt edge profile is compared frame-over-frame to catch progressive fraying long before the carcass fabric is exposed.
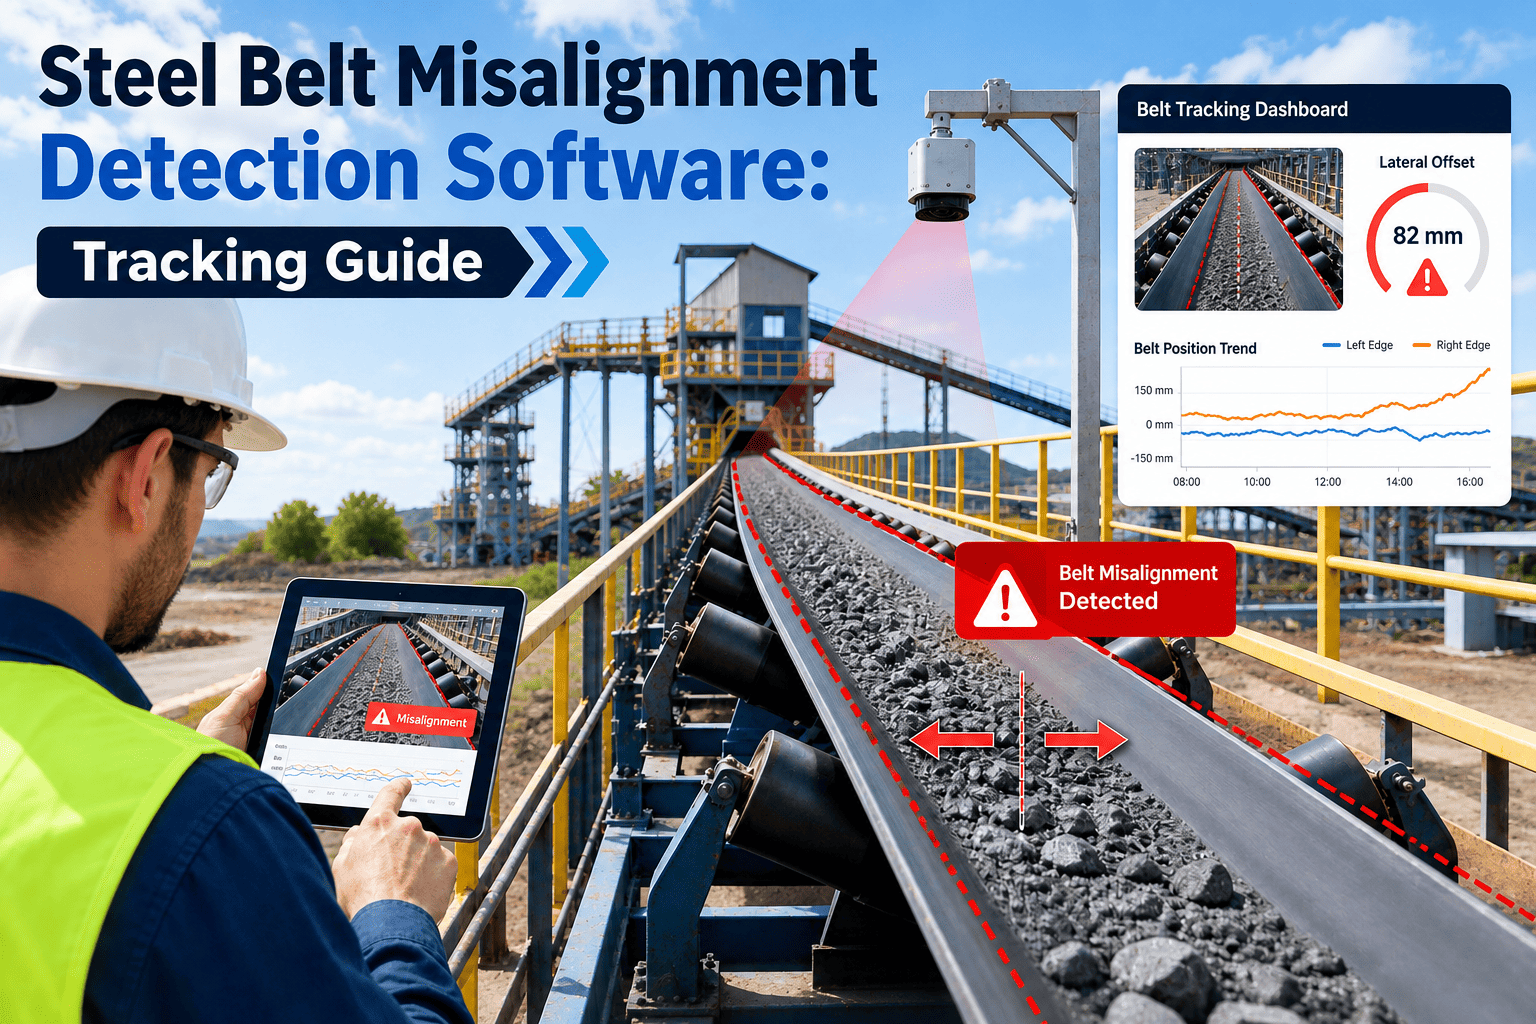
Lateral position is logged continuously, catching mistracking trends caused by worn idlers or uneven loading before spillage starts.
Tramp metal, oversized rock, and stray tools on the belt surface trigger an immediate alert rather than waiting for a downstream jam.
Cleat height loss and skirting-rubber gap growth are tracked at transfer points where spillage risk is highest.
How a scan becomes an action in four steps
Vision alone only produces images. The value comes from turning every scan into a scored, trended, and dispatchable maintenance signal automatically.
Line-speed cameras scan the belt width on every pass, day and night, without slowing production.
The model tags splice condition, cracks, edge wear, and debris against a trained defect library.
Findings roll up into a single conveyor health score, trended against last week's and last month's scans.
A score drop past threshold auto-generates a CMMS work order with the exact frame and belt-meter location attached.
Each factor is weighted because a degrading splice carries far more failure risk than a shallow cover crack. A belt scoring below 70 typically warrants a scheduled inspection within the week, and below 50 warrants inspection within 48 hours.
See your own belt's health score before it drops below 50
Oxmaint connects belt-vision camera feeds directly to your asset registry, turning every scan into a trended score and an automatic work order the moment something changes.
A conveyor fleet health board, in one view
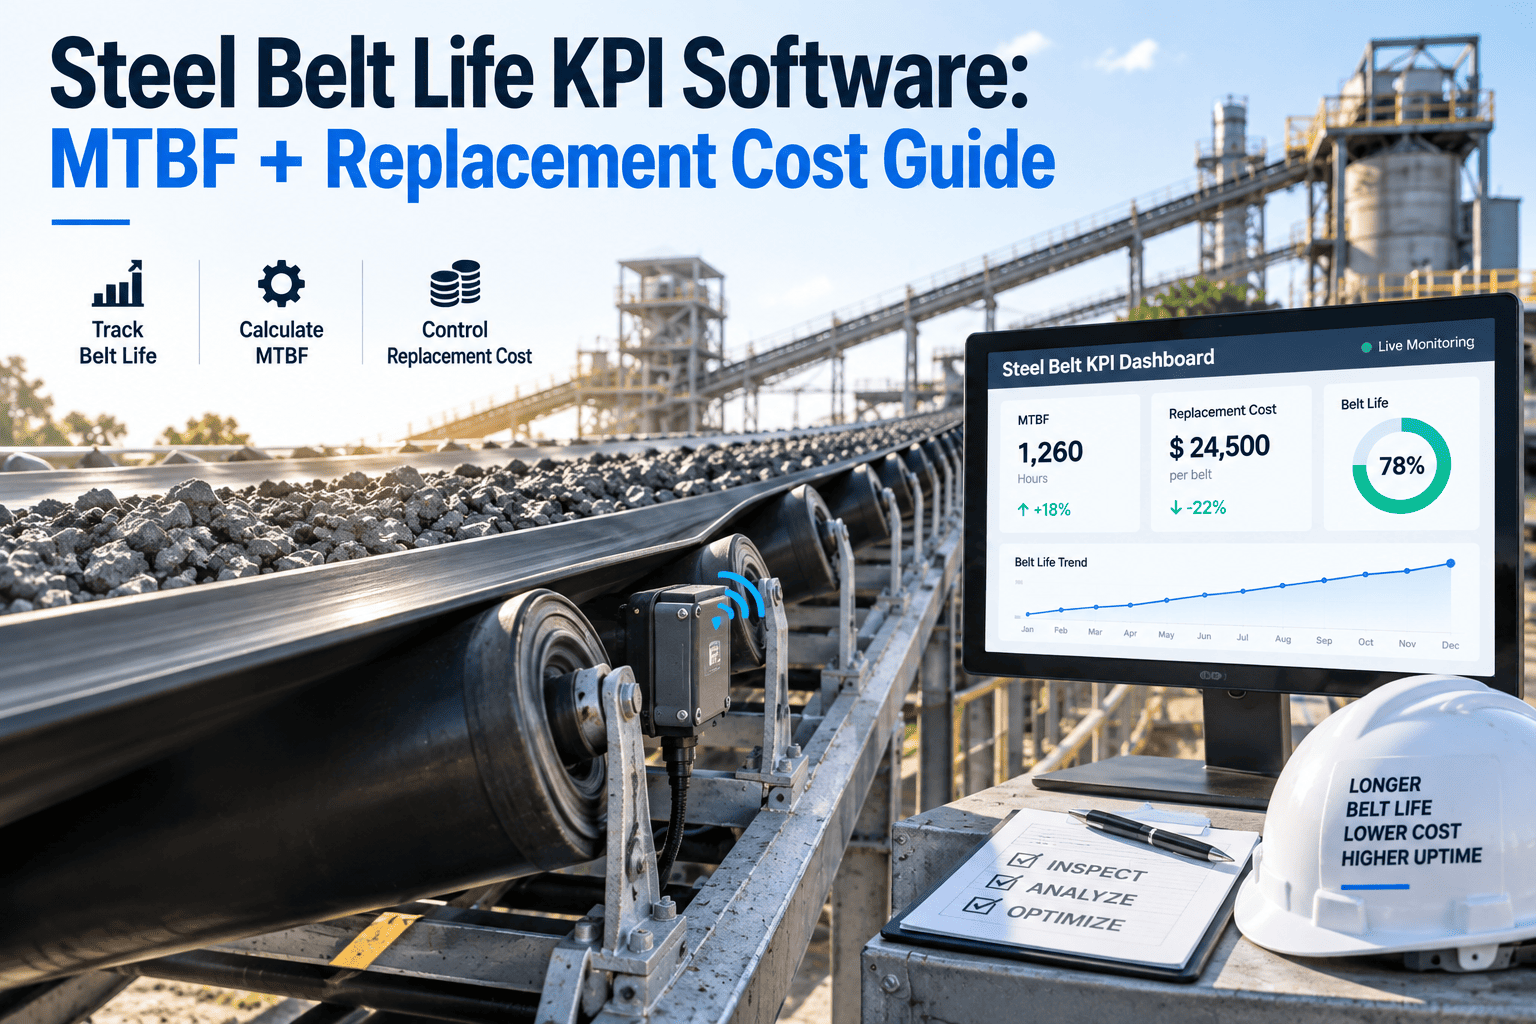
Instead of a clipboard checkmark, each conveyor carries a live, trending number. A meter that has held steady above 85 for months needs nothing more than routine checks — one dropping fast is where the maintenance budget should go this week.
A flat-products mill running six overland belts saw CV-22's score fall from 79 to 41 across three weekly scans as a mechanical splice began shedding fasteners near the tail pulley. The auto-generated work order let the crew re-splice during a planned Sunday outage instead of an emergency stop mid-shift, avoiding an estimated 14 hours of dispatch downtime.
AI vision versus the once-a-shift walkdown
Manual inspection is not careless — it is simply limited by human eyes, light, and time. The comparison below is why steel plants are adding cameras rather than replacing the inspection team.
| Inspection Factor | Manual Walkdown | AI Vision Software |
|---|---|---|
| Coverage frequency | 1–2 times per shift | Every belt pass, continuously |
| Splice condition trending | Visual judgment, not logged | Measured and trended per scan |
| Low-light or enclosed gallery zones | Often skipped or rushed | Fully scanned regardless of lighting |
| Early crack detection | Visible only once advanced | Flagged at early growth stage |
| Record for audits and insurance | Paper log, easily incomplete | Timestamped image and score history |
| Response to a sudden defect | Delayed until next walkdown | Alert within minutes of the scan |
What plant managers ask before deploying belt-vision cameras
The camera compares splice geometry, fastener spacing, and joint line straightness against earlier scans of the same splice. Gradual shifts in any of these measurements are flagged well before the splice visibly separates. You can review sample splice-trend reports by starting a Start Free Trial.
No — it removes the guesswork from what a technician sees during a walkdown. Cameras cover every pass and every meter, while the maintenance team focuses hands-on time on the belts the health score flags as declining.
Most installations use one to two fixed cameras per conveyor, positioned to capture full belt width on the carry or return side. Longer overland belts with multiple transfer points may add a camera at each transfer for edge and spillage monitoring.
A work order is generated automatically in the CMMS, tagged with the belt-meter location, defect type, and the image that triggered the alert, so the crew arrives already knowing exactly what to inspect. See the workflow live in a Book a Demo session.
Yes. Every scan is timestamped, scored, and stored, creating a defensible inspection record that paper logs rarely match, particularly for splice condition and cover-wear history over the belt's service life.
Stop finding out about splice failures from a shutdown alarm.
Connect your belt cameras to Oxmaint, get a live health score on every conveyor, and let auto-generated work orders catch splice fatigue while it is still a scheduled repair, not an emergency one.
Free 14-day trial · No credit card