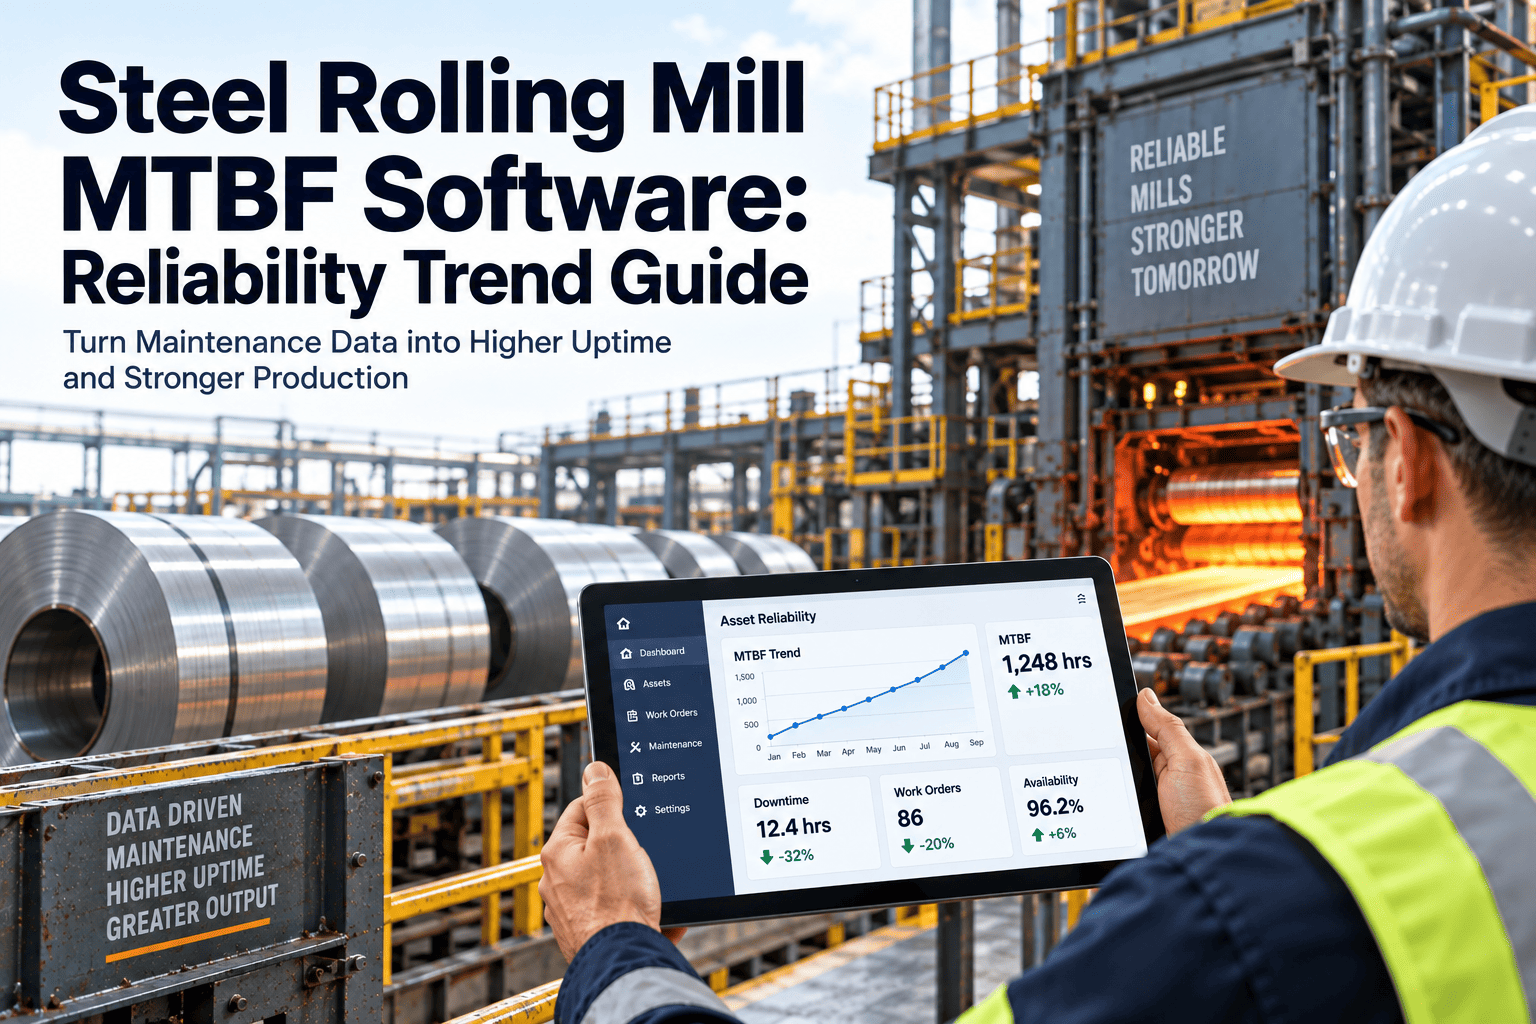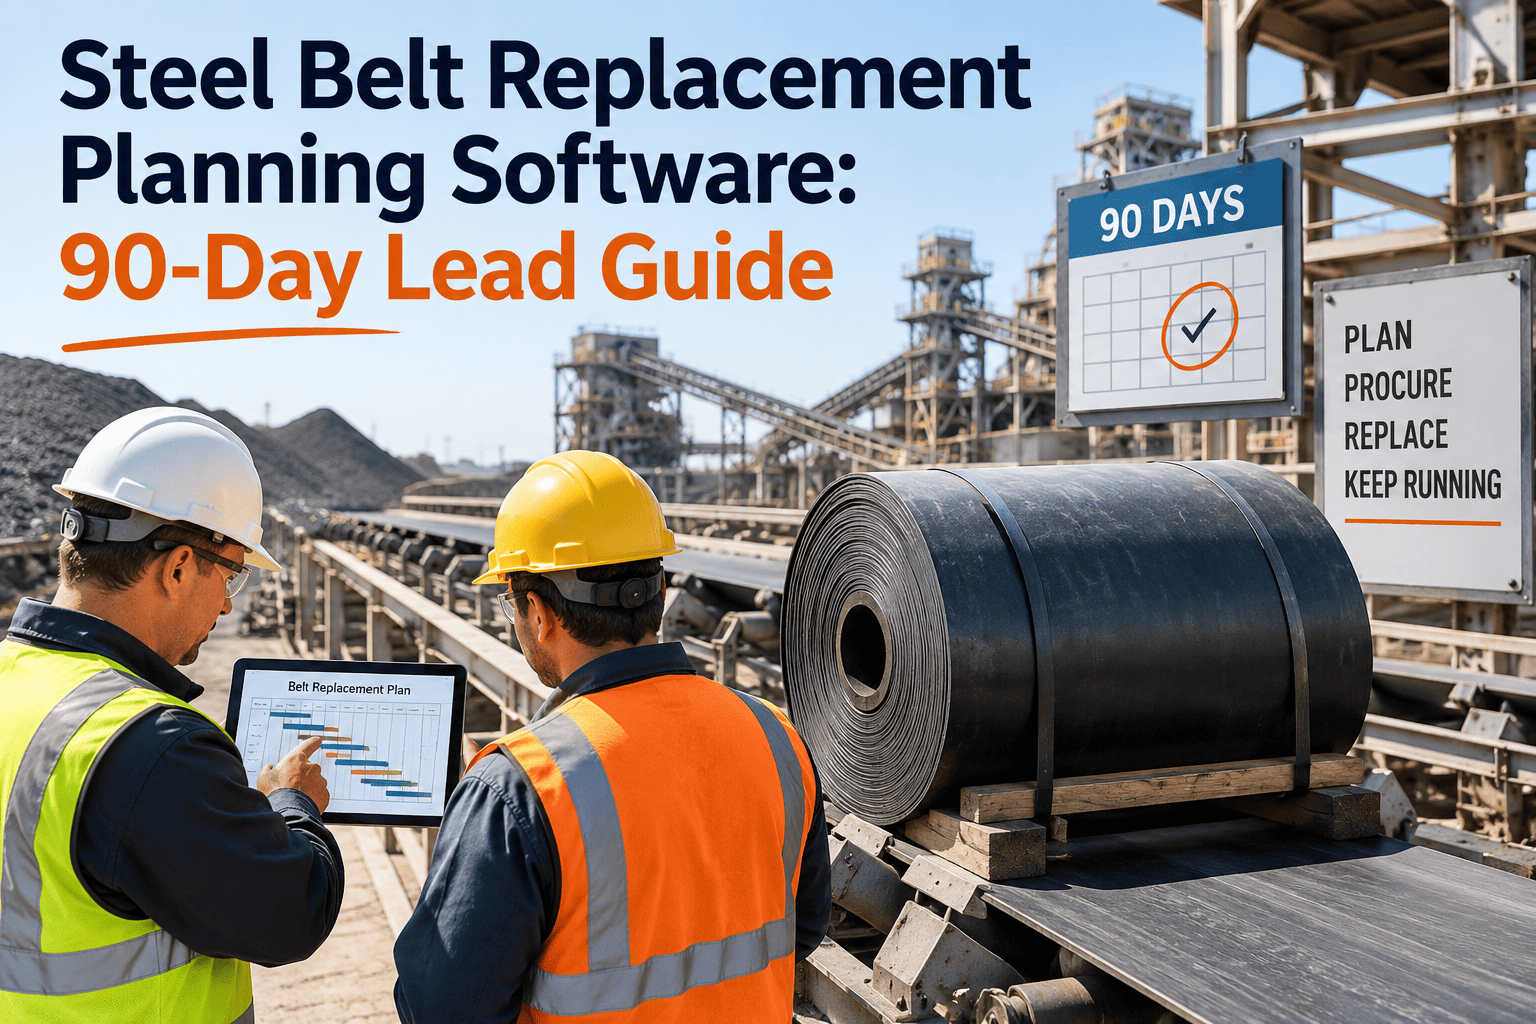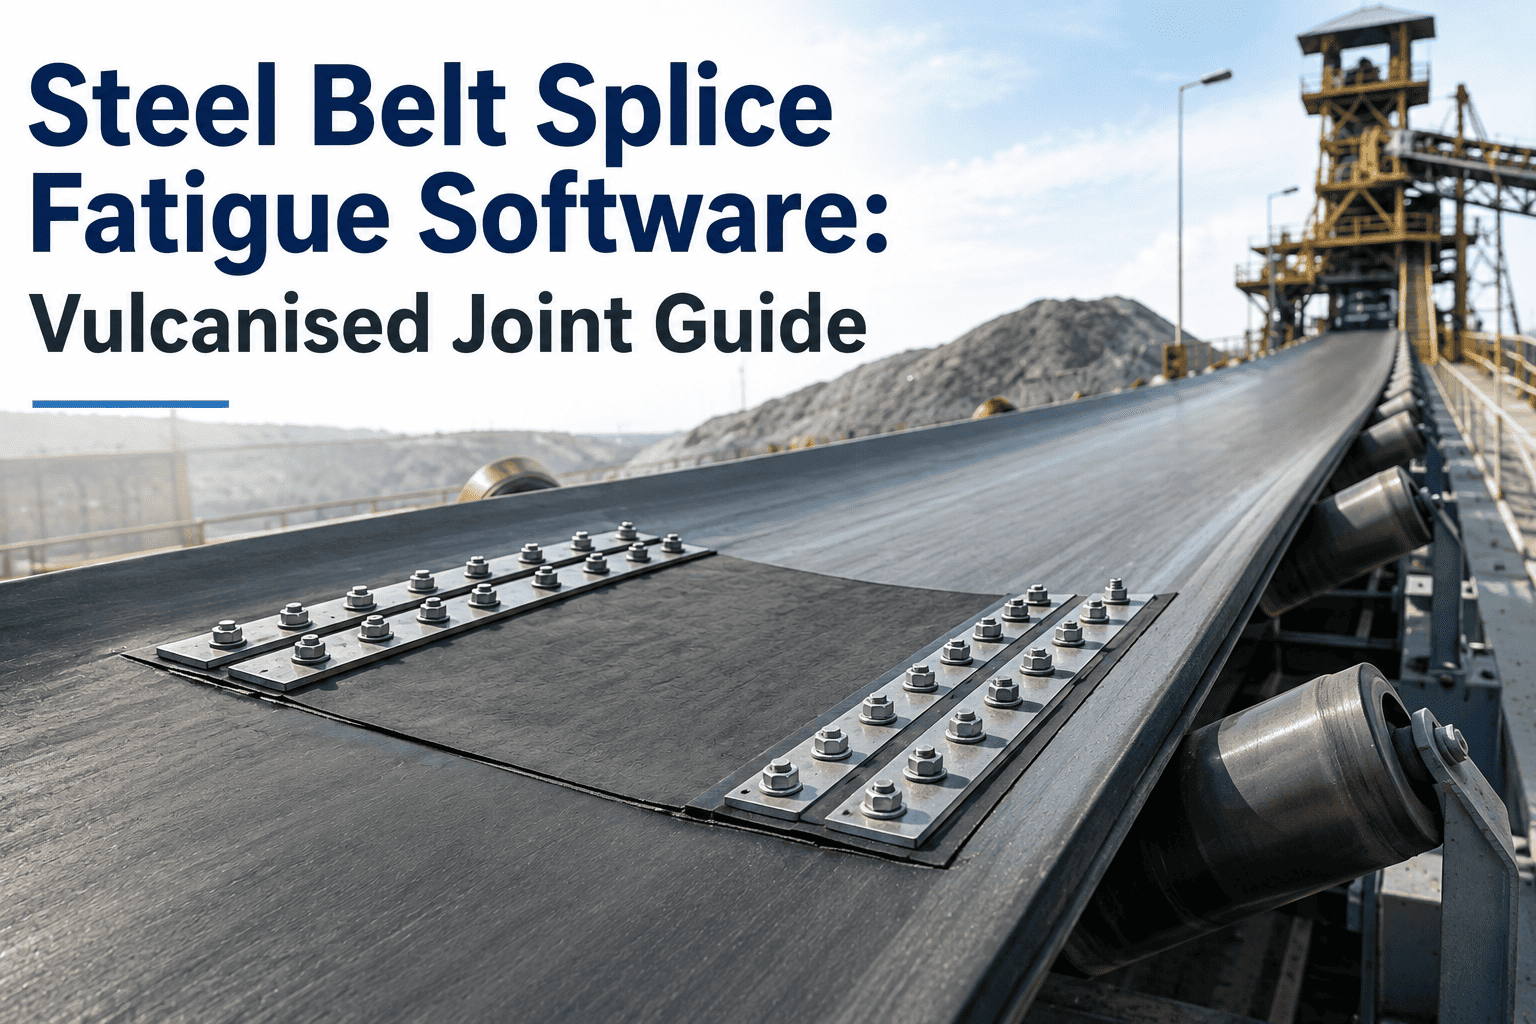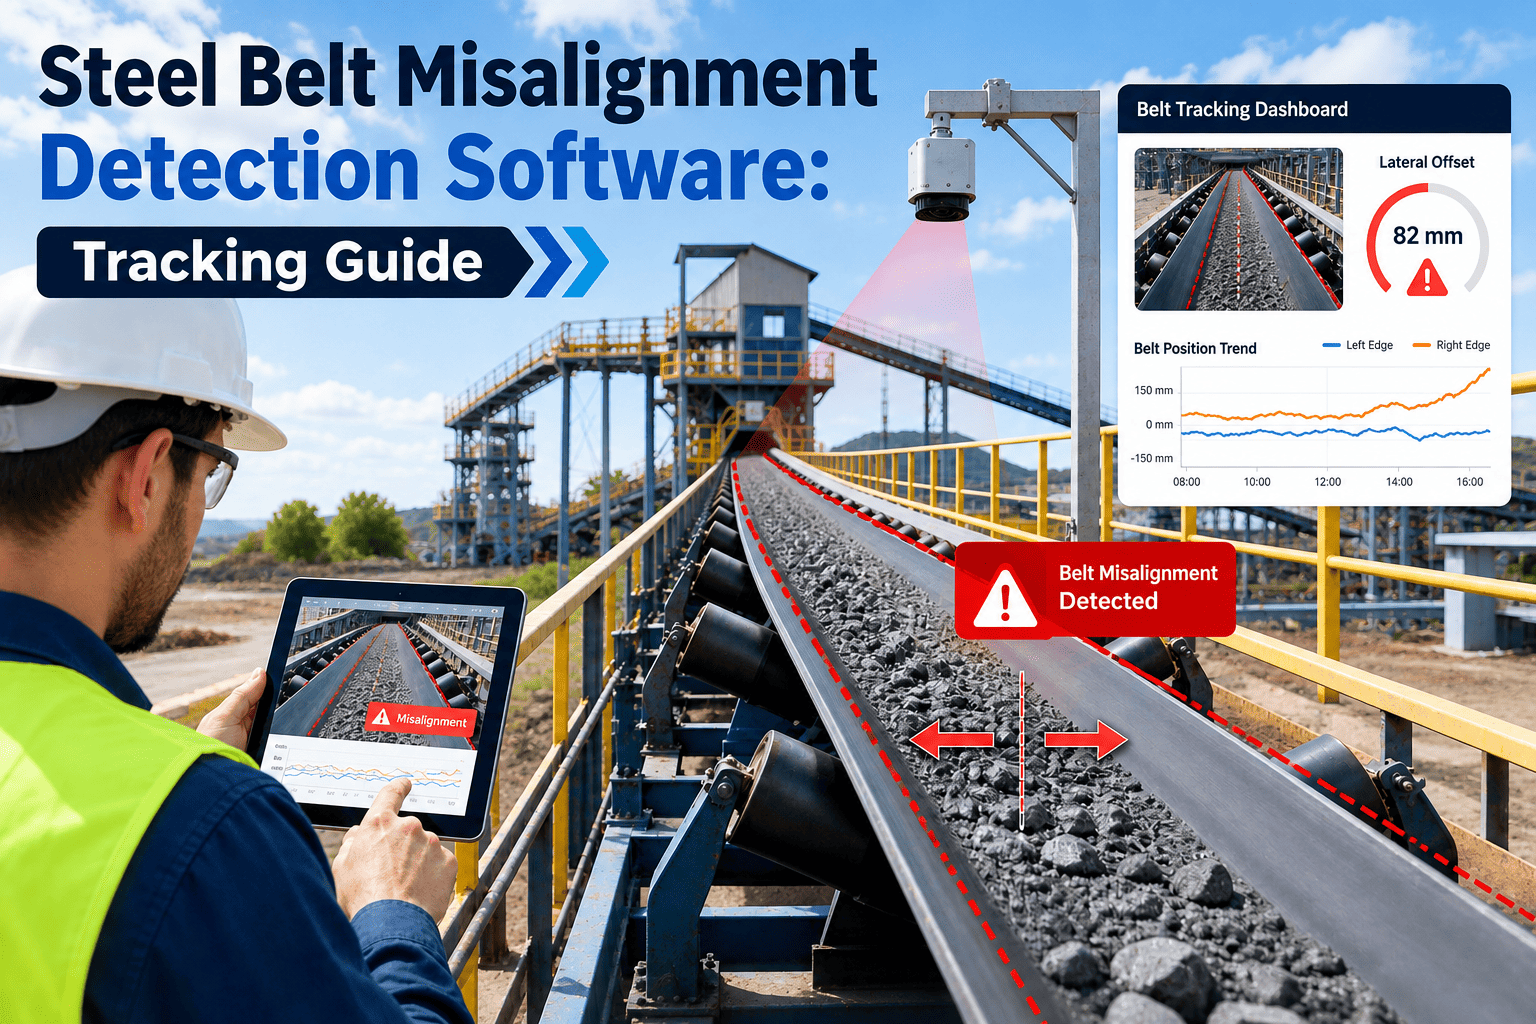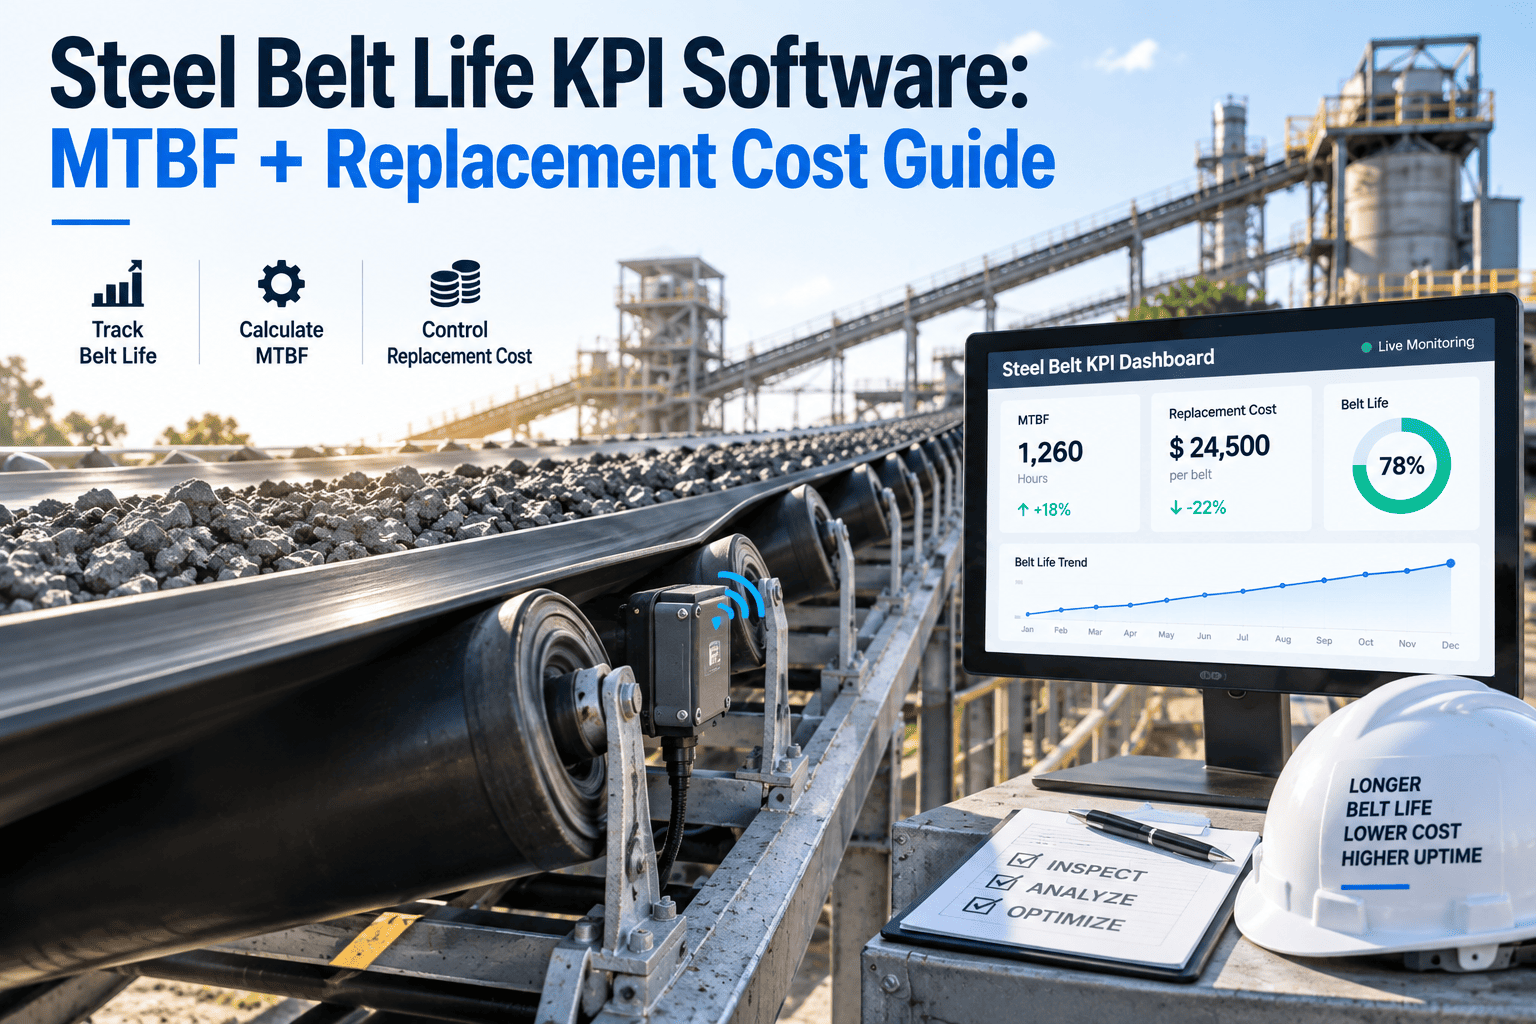
Wide steel-cord conveyor belts move raw ore, sinter, coke, and finished product through every stage of a steel mill, and a single unplanned belt failure on a main transfer line can stop production across an entire process area within minutes rather than hours. Most plants track belt age in a spreadsheet and react when a belt tears, but reliability teams that instead watch mean time between failures, cost per running hour, and replacement lead time catch degrading belts weeks before failure and walk into every capex meeting with a defensible number instead of a guess. This guide breaks down the three belt life KPIs worth defending, shows how to calculate each one, and explains how connecting belt inspection data to a CMMS turns scattered readings into a trend line your plant manager will actually act on.
Three Belt Life Numbers Every Steel Plant Should Be Able to Defend
MTBF, cost per running hour, and replacement lead time turn belt maintenance from a reactive scramble into a forecastable line item. OxMaint captures inspection readings, wear trends, and failure history in one place per conveyor asset so these KPIs calculate themselves instead of living in someone's memory or a notebook that leaves the plant with them.
The Four KPIs That Actually Predict Belt Failure
Belt age alone tells you almost nothing — a belt running light loads on a short conveyor can outlast one carrying abrasive sinter fines on a steep incline by a factor of three. These four KPIs, tracked together, describe the actual condition and cost profile of every belt asset in the plant, and each one answers a different question a reliability team or a plant manager will eventually ask.
Mean Time Between Failures
The average operating interval between unplanned stoppages caused by the belt itself — tears, splice failures, mistracking events, or cover wear-through. Calculated per conveyor, not per plant, since duty cycles vary enormously between a short feeder belt and a half-kilometer overland conveyor.
Cost Per Running Hour
Total belt-related cost — material, labor, downtime, and expedited freight — divided by hours the conveyor actually ran that period. This is the number that lets you compare a cheap belt replaced often against a premium belt replaced rarely on equal footing.
Replacement Lead Time
Days from order placement to belt delivery and installation readiness. Wide steel-cord belts are frequently custom-vulcanized to length and carcass spec, so lead time can run from a few weeks to several months depending on width, rating, and splice type.
Cover Wear Rate
Millimeters of top or bottom cover rubber lost per thousand operating hours, tracked from periodic ultrasonic or caliper readings. Wear rate is the leading indicator that feeds both MTBF prediction and the replacement lead-time countdown.
How to Calculate Belt MTBF Without Guessing
Run this per conveyor, not fleet-wide. A plant with twenty conveyors averaging 4,000 hours MTBF might actually have fifteen healthy belts running 6,000+ hours and five problem belts dragging the average down — and those five are where the budget should go.
Two mistakes distort most MTBF numbers reported to plant managers. First, planned belt replacements — scheduled swaps done before failure — should never count as a failure event, or MTBF looks worse every time a team does preventive work correctly. Second, a splice repair that keeps the belt running is a different event than a full belt replacement and should be logged separately, since splice failure rate and cover wear-through rate usually point to different root causes and often call for different corrective actions on the conveyor itself.
What Actually Drives Cost Per Running Hour
Material cost is usually the smallest piece of the belt cost equation. Unplanned downtime, expedited freight on custom-length belts, and overtime labor for emergency splicing typically account for the majority of total cost when a belt fails without warning instead of on a scheduled window.
A belt replaced on a planned outage window, with material staged ahead of the lead-time clock, routinely costs a fraction of the same replacement done as an emergency reaction to an in-service tear.
The gap between planned and emergency cost widens further when the failed conveyor feeds a downstream process that has no buffer capacity. A torn belt on a main charge conveyor into a blast furnace or a sinter strand feed can idle equipment well beyond the conveyor itself, and that secondary downtime rarely shows up in the belt's own cost ledger even though it belongs there. Reliability teams that want an accurate cost-per-running-hour figure should include a downstream impact factor for conveyors that sit on a critical path, not just the direct repair invoice.
Stop Reacting to Belt Failures
OxMaint logs every wear reading, splice repair, and belt replacement against the conveyor it belongs to, then calculates MTBF, cost per running hour, and remaining wear life automatically. Reliability teams see which belts need attention this quarter and which can wait.
Replacement Lead Time: Why the Order Date Matters More Than the Failure Date
Custom steel-cord belting is rarely a shelf item. Width, carcass construction, cover compound, and splice type are specified per conveyor, which means the order-to-delivery clock can run far longer than most maintenance teams plan for.
Spec Confirmation and Quote
Belt width, tension rating, cover thickness, and splice method confirmed against the conveyor's original design or updated duty requirements.
Manufacturing and Vulcanization
Steel-cord belts of significant width and length are built and cured to order; this window stretches further during high seasonal demand at belt manufacturers.
Freight and Site Delivery
Oversized belt rolls require freight coordination; expedited shipping on a rush order can add substantial cost on top of the emergency labor premium.
Scheduled Swap and Splice
Installation performed during a planned outage rather than an emergency stoppage, with the old belt's wear history logged for the next cycle.
Belt Life KPI Reference Table
Use this as a starting scorecard structure. Actual thresholds vary by conveyor duty, incline, and material carried, so treat these as a framework to calibrate against your own failure history rather than a fixed target to hit on every belt in the plant.
| KPI | How It Is Tracked | Review Cadence |
|---|---|---|
| MTBF (per conveyor) | Operating hours ÷ unplanned failure events | Monthly |
| Cost per running hour | Total belt cost ÷ hours operated in period | Quarterly |
| Cover wear rate | Ultrasonic or caliper reading, mm lost per 1,000 hours | Monthly inspection round |
| Replacement lead time | Order date to install-ready date, logged per supplier | Updated per purchase order |
| Splice repair frequency | Count of in-service splice repairs per belt per year | Quarterly |
| Mistracking incident rate | Count of tracking-related stoppages per conveyor | Monthly |
Three Warning Signs a Belt Is Closer to Failure Than the Calendar Suggests
Cover Wear Rate Accelerating Between Readings
If ultrasonic cover thickness readings show wear accelerating rather than declining at a steady linear rate, load, alignment, or idler condition has likely changed. Investigate loading chute impact points and idler spacing before scheduling a routine replacement.
Splice Repair Frequency Climbing on One Belt
Multiple splice repairs on the same belt within a short window usually signals carcass fatigue rather than a one-off installation error. Continued patching typically costs more in cumulative downtime and labor than pulling forward the replacement order and scheduling the swap on a planned outage window.
MTBF Trending Down Quarter Over Quarter
A declining MTBF trend on a specific conveyor, even without a single dramatic failure, is the clearest early signal that the belt has entered its wear-out phase and should be added to the next capex cycle rather than run to failure.
How OxMaint Tracks Belt Life Automatically
Manual wear logs live in inspector notebooks and get lost between shifts, and a belt's history often walks out the door with whichever technician performed the last inspection. OxMaint attaches every reading, repair, and replacement to the specific conveyor asset record so KPI trends build themselves over time, survive staff turnover, and remain visible to whoever is on shift when a decision needs to be made.
Per-Conveyor Failure Logging
Every belt stoppage, splice repair, and full replacement logs against the specific conveyor asset, so MTBF and cost per running hour calculate correctly instead of getting blended into a plant-wide average that hides problem belts.
Wear Reading History and Trend Lines
Cover thickness readings from periodic inspections build a trend line per belt, flagging acceleration in wear rate before it becomes a mid-shift failure that stops the line.
Lead-Time-Aware Replacement Planning
Supplier lead times log per order, so purchasing can trigger the next belt order based on projected wear-out date instead of waiting for a failure to force an emergency purchase.
Cost Roll-Up Reporting
Material, labor, and downtime cost roll up automatically into cost per running hour, giving reliability teams a defensible number for the next capex or budget conversation.
Building a Belt Scorecard Finance Will Actually Trust
Most capex requests for belt replacement get denied or deferred not because the belt doesn't need replacing, but because the request arrives without a number finance can verify. A scorecard built from logged inspection data, not a maintenance team's judgment call, changes that conversation.
Start with a one-page view per conveyor: current MTBF against a rolling twelve-month baseline, cost per running hour trended quarter over quarter, and the wear-rate curve projecting a replacement date. When that projection lines up with the supplier's quoted lead time, the order becomes a scheduling decision rather than a debate about whether the spend is justified. Plants that present this scorecard consistently tend to see faster capex approval, because the request stops looking like a maintenance opinion and starts looking like a forecast backed by measured data.
The same scorecard structure also helps justify spec changes. If cost per running hour on a specific conveyor stays persistently above the fleet average even after routine replacements, that is the evidence needed to request a heavier cover compound or a different splice method rather than simply repeating the same purchase cycle indefinitely.
Belt Life KPI Questions
What is a healthy MTBF for a steel plant conveyor belt?
Should planned belt replacements count against MTBF?
How early should we order a replacement belt before predicted wear-out?
Does cost per running hour include labor for splice repairs?
Can OxMaint track belt KPIs alongside other conveyor components like idlers?
Case Study: Tracking MTBF Cut One Plant's Emergency Belt Orders in Half
Our belt replacement process used to start the day a conveyor tore — someone would call the supplier in a panic and we would eat the expedite fee every time. Once we started logging cover wear readings and MTBF per conveyor in OxMaint, we could see three belts trending toward wear-out months before they would have failed. We placed standard-lead-time orders instead of emergency ones, scheduled the swaps during planned outages, and cut our emergency belt orders by roughly half in the following year. The cost per running hour number also gave us something concrete to show finance when we asked for a heavier-duty cover spec on our worst-performing conveyor. What surprised us most was how much of our previous belt budget had been going to expedite freight and overtime splicing crews rather than the belts themselves — once that was visible in the cost roll-up, the case for planning ahead of the lead-time clock made itself, and we didn't have to argue for a bigger maintenance budget so much as spend the existing one more deliberately.
— Reliability Engineer, Integrated Steel Mill
Turn Belt Wear Readings Into a KPI You Can Defend
OxMaint connects every inspection reading, splice repair, and replacement order to the conveyor it belongs to, so MTBF, cost per running hour, and replacement lead time calculate themselves instead of living in someone's notebook.