A hot strip mill can run at flawless gauge and perfect chemistry and still ship a claim-generating coil, because the defect that matters most at the end of the line is not dimensional, it is visual — a scale patch, a scab, a roll mark, or a hairline crack that a human inspector, watching steel move at fifteen metres a second, simply cannot catch every time. Surface Defect Detection systems exist because the eye is the weakest link in an otherwise precise process, and once a vision system starts classifying defects automatically, the real challenge shifts to what happens with that classification afterward. Plants that get real value from SDD are not the ones with the sharpest camera resolution — they are the ones that route every classified defect into a connected maintenance and quality workflow, which is exactly what teams build with the OxMaint CMMS platform.
SDD Vision Systems That Actually Change What Happens Next
Scale, scab, crack, and roll mark classification connected to work orders, root-cause tracking, and grade decisions — so a detected defect turns into an action instead of just a flagged image.
The Six Defect Classes Every Vision System Has to Tell Apart
A surface defect detection system is only useful if it classifies correctly, not just detects that something is there. Scale and scab look similar to an untrained camera but come from completely different root causes, and mixing them up sends maintenance chasing the wrong equipment. The six classes below are the core taxonomy behind most hot strip and cold rolling SDD deployments.
Scale
Oxide layer not fully removed before rolling, appearing as a rough or dark patch. Usually traced back to descaler pressure or nozzle wear.
Scab
Torn or folded surface metal, often from a slab surface defect carried through rolling. Distinguished from scale by its raised, irregular edge.
Roll Mark
Periodic, repeating pattern caused by a damaged or worn work roll. The repeat interval itself identifies which roll and which stand caused it.
Edge Crack
Fine cracking along the coil edge from excessive width reduction or cold material. A leading indicator of downstream slitting failures.
Pit & Inclusion
Small surface voids or embedded non-metallic particles from the casting stage, usually clustered rather than spread across the coil.
Coating Defect
Uneven zinc or paint coverage on finished coil, detected by thickness variance rather than surface texture alone.
From Camera to Correction — The Five-Stage SDD Workflow
A camera that flags a defect is only the first stage of a working SDD program. Plants that stop at detection end up with a folder of flagged images nobody reviews. The workflow below is what separates a vision system that reduces claims from one that just generates alerts nobody acts on.
Line-Speed Image Capture
High-frame-rate cameras capture the full coil surface at rolling speed, with lighting calibrated to each defect class's contrast profile.
Automated Classification
Vision model classifies each flagged region against the six-class taxonomy and assigns a severity score based on size and density.
Grade & Routing Decision
Severity score triggers an automatic prime, downgrade, or hold decision, routed instantly to the coil's quality record.
Root-Cause Work Order
Recurring defect patterns auto-generate a maintenance work order tied to the suspected stand, roll, or descaler component.
Trend & Verification
Defect rate on the same class tracked post-repair to confirm the corrective action actually resolved the recurring pattern.
A Flagged Defect Is Only Useful If Something Happens Next.
OxMaint connects SDD classification output straight into work orders and root-cause tracking, so a repeating roll mark becomes a scheduled roll change instead of a folder of ignored images.
Live Defect Dashboard — What a Shift Looks Like on a Connected Line
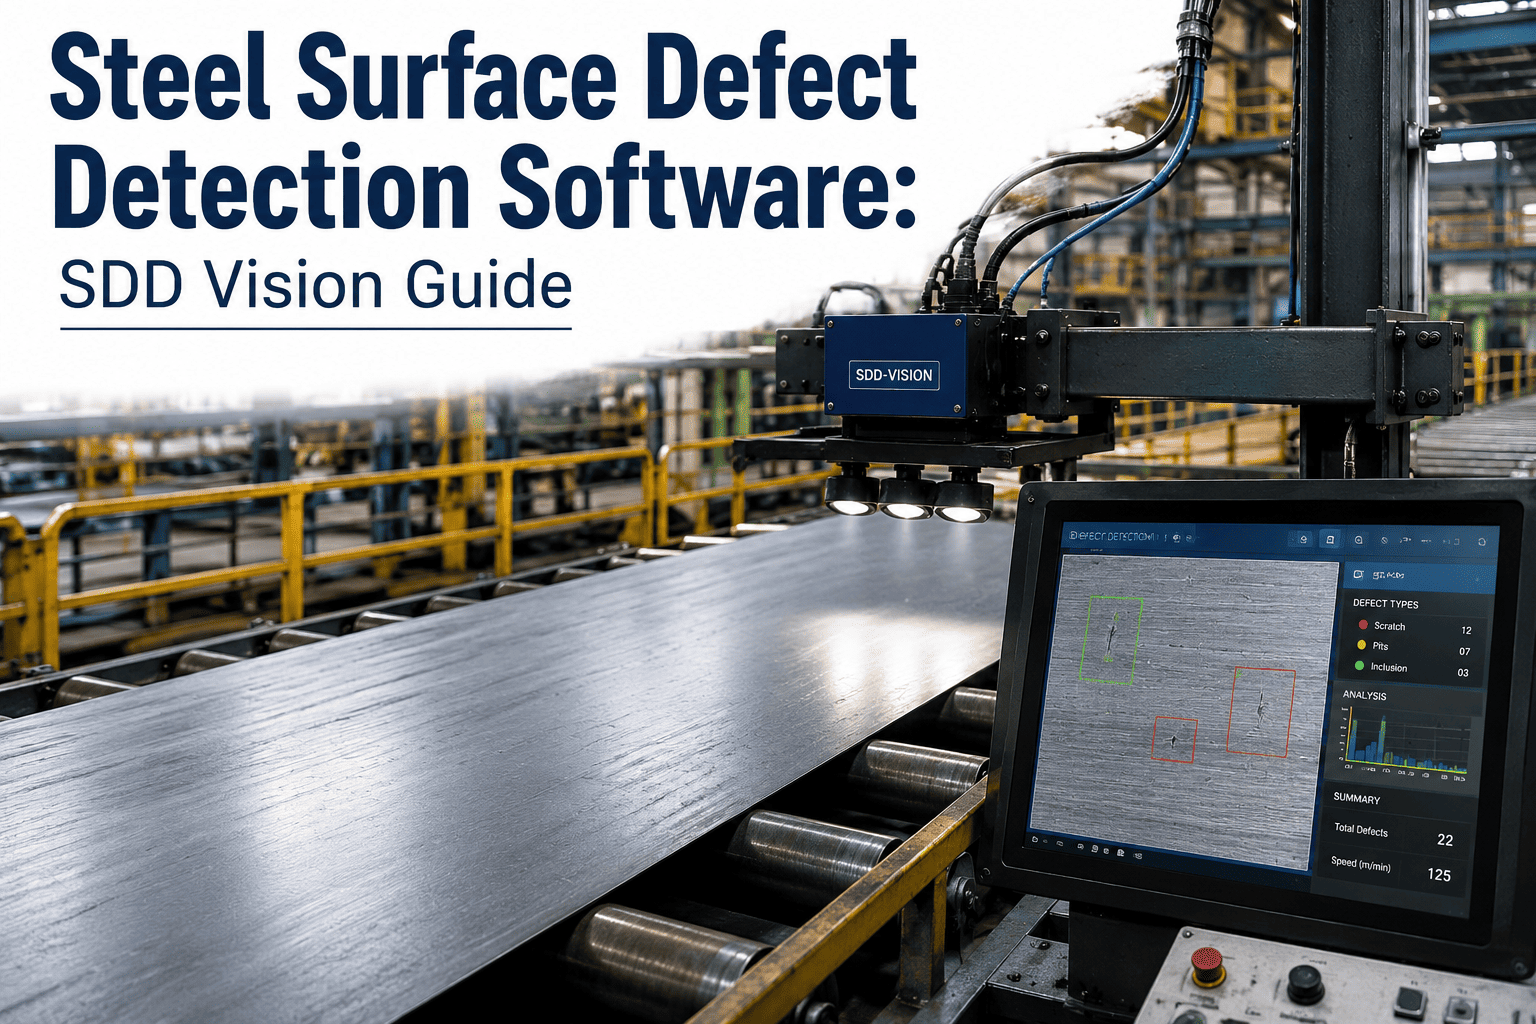
The record below shows what a live SDD dashboard looks like during a single shift on a hot strip line. Every defect class carries its own current rate, trend, and linked action, so a supervisor sees the full picture from one screen instead of reviewing flagged images one at a time.
Manual Inspection vs Connected SDD — The Gap Widens Over Time
A human inspector fatigues, blinks, and cannot watch every metre of coil at rolling speed for eight hours straight. The comparison below shows what typically changes across a twelve-month period after a plant moves from manual visual inspection to a fully connected SDD workflow.
| Inspection Element | Manual Visual | Connected SDD | Annual Impact |
|---|---|---|---|
| Detection Consistency | Varies by inspector fatigue and shift | Uniform across every coil, every shift | 99%+ consistent coverage |
| Defect Classification Accuracy | Often generalised as "surface defect" | Classified into six specific categories | Root cause traceable |
| Root-Cause Resolution Time | Days, via manual log review | Hours, via auto-generated work order | 45% faster resolution |
| Recurring Defect Detection | Pattern noticed only after volume builds | Flagged after third occurrence | Earlier roll/equipment fix |
| Claims from Missed Defects | Depends on inspector attention | Near-zero missed detections | Fewer field claims |
Six Practices That Make an SDD Investment Actually Pay Off
Buying a vision system is the easy part. The plants that see a real return run these six practices around it, turning classification data into recurring corrective action instead of a passive image archive.
Auto Work Order Linking
Every defect above a severity threshold automatically opens a maintenance work order instead of waiting for a supervisor to review flagged images manually.
Class-by-Class Rate Review
Defect rate reviewed per class, not as one combined number, so a spike in one category is not hidden inside an otherwise good average.
Repeat-Interval Analysis
Roll mark and periodic defect intervals cross-checked against roll circumference records to identify the exact component causing the pattern.
Post-Fix Verification
Defect rate tracked for the next batch of coils after any corrective action, confirming the fix actually worked before closing the work order.
Grade Decision Audit
Automatic prime and downgrade decisions spot-checked against actual customer claims to keep the severity threshold correctly calibrated.
Camera & Lighting Calibration
Lighting and lens condition checked against baseline images, since a drifting camera setup silently degrades classification accuracy over time.
What a Fully Connected SDD Program Returns
The figures below reflect what steel plants typically report after connecting their vision system's output directly into a CMMS-driven maintenance and quality workflow.
Uniform coverage across every coil and every shift, independent of inspector fatigue.
Auto-generated work orders reaching maintenance hours sooner than manual log review.
Compared to manual inspection at full rolling speed across an eight-hour shift.
Time between camera capture and an actionable alert reaching the line supervisor.
Frequently Asked Questions
Every Classified Defect Should Trigger an Action, Not Just an Alert
The plants getting real value from vision systems all share one habit — their SDD output, their work orders, and their root-cause trends run inside the same connected system, start to finish.