A conveyor belt rarely fails the way people picture it. It doesn't snap without warning — it thins, quietly, a fraction of a millimetre at a time, under years of abrasive ore, coke, and sinter sliding across its cover. By the time a tear is visible to the naked eye, the steel cords or fabric plies underneath have usually been exposed for weeks already, and the belt has been running on borrowed structural strength the whole time. Ultrasonic thickness mapping is how steel plants turn that invisible decline into a number they can trend, budget against, and act on before it becomes an emergency shutdown — starting with a Start Free Trial of Oxmaint.
How many millimetres of cover does your busiest conveyor have left before it needs replacing?
Most plants only find out the answer when a belt tears mid-shift, usually during a production run rather than a planned stop. A quarterly ultrasonic thickness map, logged at fixed points along the full belt length, turns that unknown into a trend line — one that predicts remaining service life and gives procurement and shutdown teams real lead time instead of an emergency call. The breakdown below covers how the measurement works, where to take it, and how to turn a set of numbers into a replacement plan.
Why ultrasonic beats the alternatives for cover wear
Plants track belt condition three different ways, and only one of them produces a number precise enough to trend. The other two tell you a belt looks worn — ultrasonic tells you exactly how many millimetres of cover remain at a specific point, repeatably, every time you measure.
Fast and requires no equipment, but only catches wear once the surface pattern has visibly changed or fabric threads start to show. By that point a belt has often already lost most of its usable cover margin.
Requires cutting a small sample or accessing a belt edge, giving an accurate reading at that single point but no practical way to survey dozens of points across a belt's full length on a running schedule.
Measures cover thickness through the rubber non-destructively in seconds, at any point along the belt, without stopping or cutting anything. This is what makes repeatable, plant-wide wear mapping practical on a fixed schedule.
Reading the belt like a map, not a single number
A belt does not wear evenly. Loading points, trippers, and high-abrasion material zones thin the cover faster than the rest of the run, so a single average thickness reading hides exactly the spot that will fail first. Mapping fixed measurement points along the belt length turns a vague sense of "the belt is getting old" into a specific zone that needs attention.
Highest impact and abrasion zone, where material first strikes the belt as it drops from a chute or feeder. Typically shows the fastest wear rate of any point on the run, and on high-throughput belts it can wear two to three times faster than the mid-carry section just a few metres downstream.
Steady abrasive contact under load, wearing more slowly and evenly than the loading point but still the largest surface area to track across a belt's full length. This zone is usually the best single indicator of the belt's overall condition trend.
Secondary impact zone on belts with intermediate discharge points, often overlooked in a basic inspection plan until a thickness reading shows it wearing faster than expected relative to the rest of the belt.
Flexing and scraper contact at the head pulley wear the cover from a different mechanism than abrasion, so trends here often diverge from the carrying run and deserve their own reading rather than being assumed to match it.
Lower material contact but exposed to carryback buildup and scraper wear on the underside, typically the slowest-wearing zone on the belt but not one to skip entirely from the quarterly reading plan.
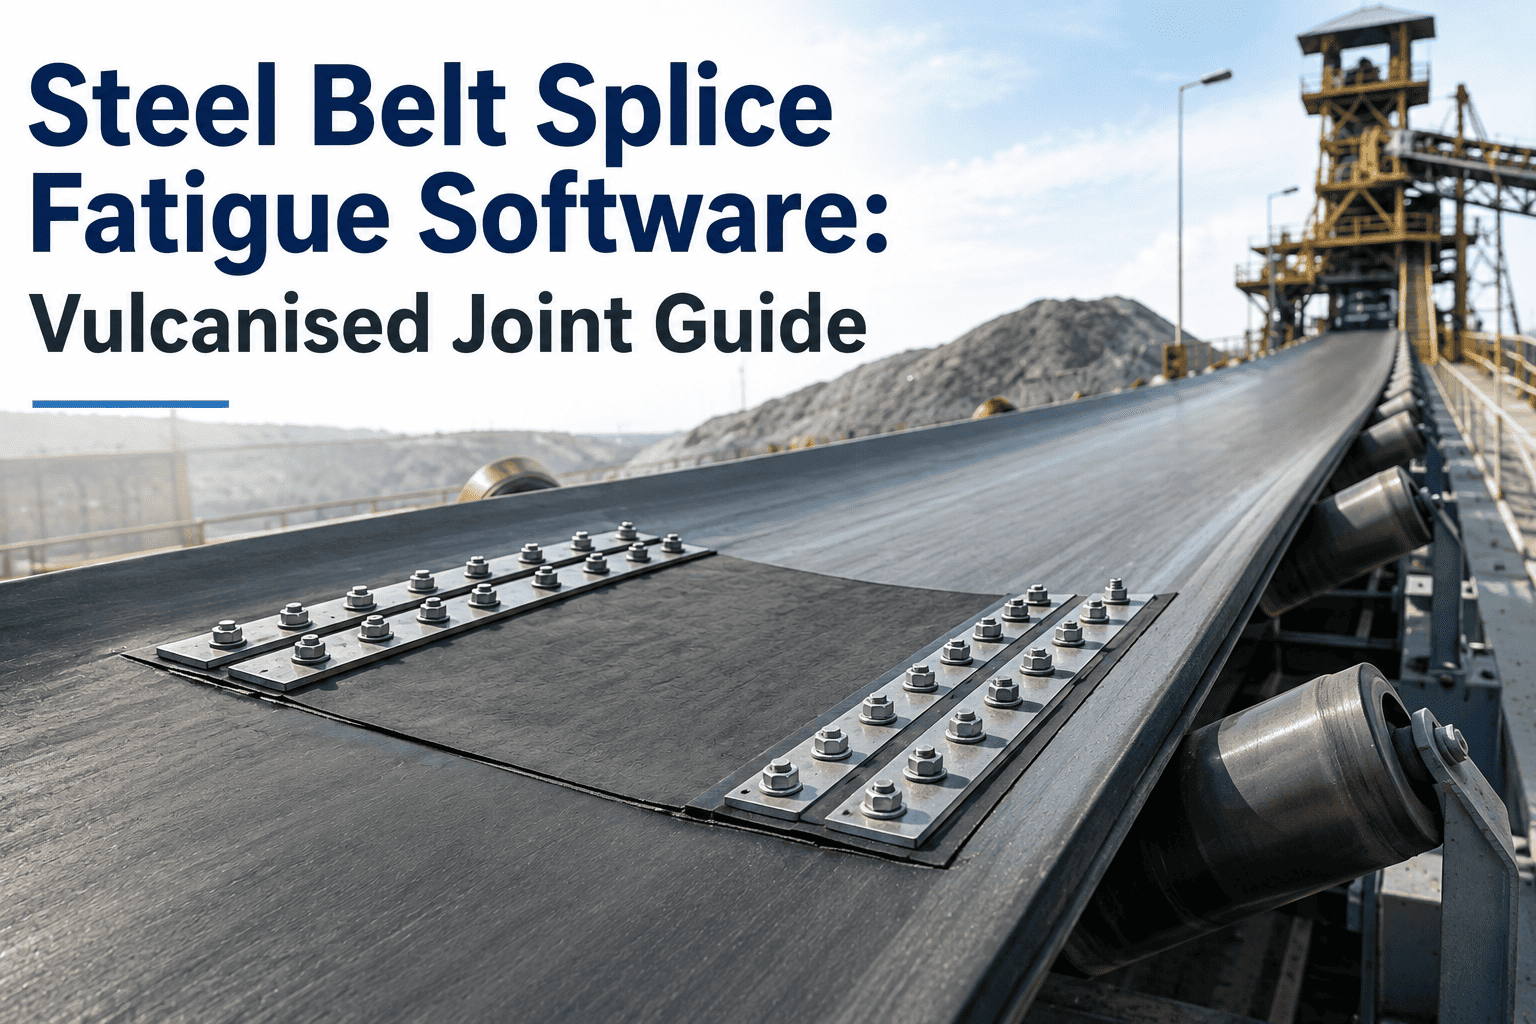
Not a wear zone in the same sense as the others, but thickness and condition readings here catch delamination and joint separation before a splice fails outright, which is often the single most disruptive failure mode on a belt.
What the numbers actually mean
Cover thickness only matters in relation to two things: how far it has left to go before the carcass is exposed, and how fast it is getting there. Both come from the same quarterly readings once they are logged consistently by zone.
Applied consistently per zone, this produces a millimetres-per-month figure that projects forward to a replacement date — the basis for scheduling procurement and shutdown work well ahead of the belt reaching minimum safe cover. Because wear rate rarely stays perfectly linear, most plants recalculate the projection after every new reading rather than relying on a single early estimate, so the forecast tightens as more data accumulates over successive quarters.
| Belt Duty | New Cover (mm) | Caution Threshold (mm) | Replace Threshold (mm) |
|---|---|---|---|
| Light-duty transfer | 3-5 | 2 | 1 |
| General ore/coal handling | 6-10 | 3 | 1.5 |
| High-abrasion primary crusher feed | 10-15 | 4 | 2 |
| Hot material discharge | 8-12 | 3.5 | 2 |
Catching a splice failure before it happened
A plant running quarterly ultrasonic mapping on its primary crusher feed belt noticed Zone A thickness dropping from 11mm to 7mm across three readings — a faster wear rate than the rest of the belt by a wide margin, projecting past the 4mm caution threshold within two quarters. The zone was scheduled for a partial re-cover during the next planned stop instead of running to failure, avoiding both the production loss of an emergency tear and the cost of replacing the entire belt when only one section needed attention. The same trending on the splice region separately flagged early delamination on an unrelated belt, caught during a routine reading rather than discovered as a mid-shift tear that would have taken the conveyor down without warning.
Ready to put belt cover wear on a trend line instead of a guess?
Oxmaint gives steel plants a purpose-built CMMS for logging ultrasonic thickness readings by zone, trending wear rate, and generating replacement work orders automatically.
Running a quarterly thickness mapping program
The value of ultrasonic mapping comes entirely from consistency — the same points, measured the same way, on the same schedule, every quarter. Skipping a cycle or moving measurement points breaks the trend line that makes the whole program useful.
Sound velocity varies by rubber compound, so a one- or two-point calibration against a known sample thickness is required before readings are trustworthy.
Take readings at the same physical points every quarter — loading point, mid-carry, transfer points, discharge wrap, return run, and splice regions — so successive readings are directly comparable.
Each reading gets tied to its zone and date rather than filed as a standalone inspection note, so the history accumulates into a usable trend rather than scattered data points.
Compare the current reading against the prior one to get a millimetres-per-month rate, then project forward to the date each zone reaches its replacement threshold.
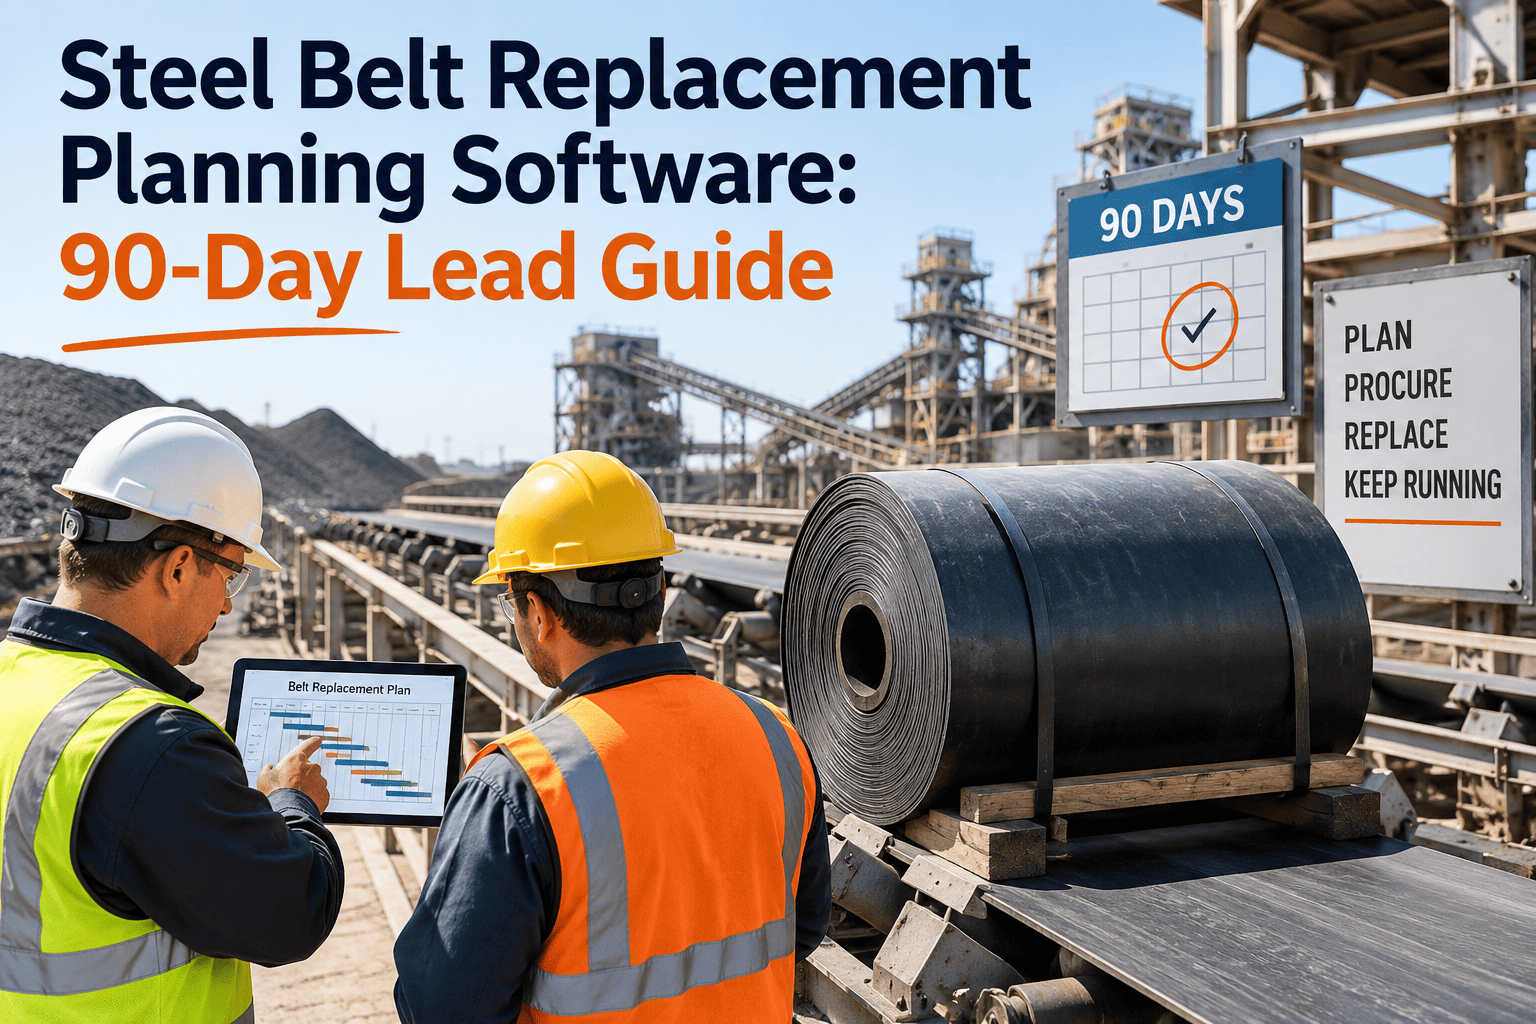
Generate a planning work order roughly 90 days before the projected threshold date, giving procurement enough lead time to source the belt and coordinate the shutdown window.
What a structured thickness program is worth
Belt replacement decisions made on visual judgment alone tend to go one of two costly directions — either the belt runs until it tears, or a serviceable belt with years of cover left gets pulled early out of caution.
Belt cover wear monitoring — common questions
Quarterly is standard for most steel plant belts, with monthly readings on high-abrasion zones like primary crusher feed. You can set up recurring zone-based readings by starting a Start Free Trial of Oxmaint.
It depends on belt duty and construction, but most plants replace once cover thickness approaches 1-2mm above the reinforcement layer, since puncture and rupture risk rises sharply below that margin.
Loading points, transfer chutes, and pulley wraps all wear the cover through different mechanisms and at different rates than the steady carrying run, which is why single-point readings miss the zone that fails first.
No — visual checks still catch splice separation, edge damage, and surface tears that a spot thickness reading can miss between scheduled measurement passes. To see how the two combine in one program, Book a Demo with our team.
Yes — a structured PM program with manual quarterly readings entered against each belt's zone record delivers most of the same trending value as continuous sensor systems, at a fraction of the setup cost.
Mistakes that break a wear-mapping program
A quarterly thickness program only works if the data is trustworthy quarter over quarter. The mistakes below are the most common reasons a plant collects readings for a year and still can't answer how much life a belt has left.
Even a small shift in where a reading is taken along the belt can make wear look like it reversed or accelerated when nothing actually changed, breaking the trend line for that zone entirely. Marking physical reference points on the frame or structure near each zone keeps successive readings anchored to the same spot regardless of who takes them.
A missed reading cycle doesn't just lose one data point — it doubles the uncertainty in the wear rate calculated from the readings on either side of the gap, which pushes the projected replacement date around unpredictably and undermines confidence in the whole forecast.
Switching belt compounds or operators without recalibrating sound velocity introduces a systematic offset that looks like real wear but is actually measurement error, and it is one of the hardest mistakes to catch after the fact since the readings still look plausible on their own.
Turning readings into a belt life forecast
The readings themselves are only half the value. The other half is what happens to that number after it's taken — whether it sits in a technician's notebook or feeds a live trend line tied to a specific belt zone in your asset register.
Each belt gets a single asset record with its measurement zones defined once, so every future reading has a consistent home to log against.
Quarterly reading tasks generate automatically per belt, assigned to the technician responsible for that area, rather than relying on someone remembering the interval.
Once two or more readings exist per zone, the wear rate and projected replacement date calculate automatically, surfacing the belts closest to their threshold first.
Stop guessing when a belt needs replacing. Start measuring it.
Join the steel plants using Oxmaint to log ultrasonic thickness readings by zone, trend wear rate automatically, and get a replacement work order 90 days before failure risk.
Free 14-day trial · No credit card