On a mid-size electric arc furnace line, a rolling mill supervisor spends forty minutes each shift filling out a downtime log that nobody reads twice. The categories are vague — "mechanical," "electrical," "other" — so when the plant misses its monthly output target, nobody can say whether the real culprit was equipment breakdowns, slow changeovers, or a string of five-minute jams that quietly added up to six lost hours. This kind of blurry bookkeeping is common across steel operations, and it erodes throughput long before anyone notices a pattern. Structuring downtime into the six recognised loss categories, and feeding that data into a connected CMMS, turns a vague log into a diagnostic tool that points straight at the next improvement project. Book a demo to see how a maintenance team can start categorising loss the same week.
Six Big Losses, One Categorised View of Downtime
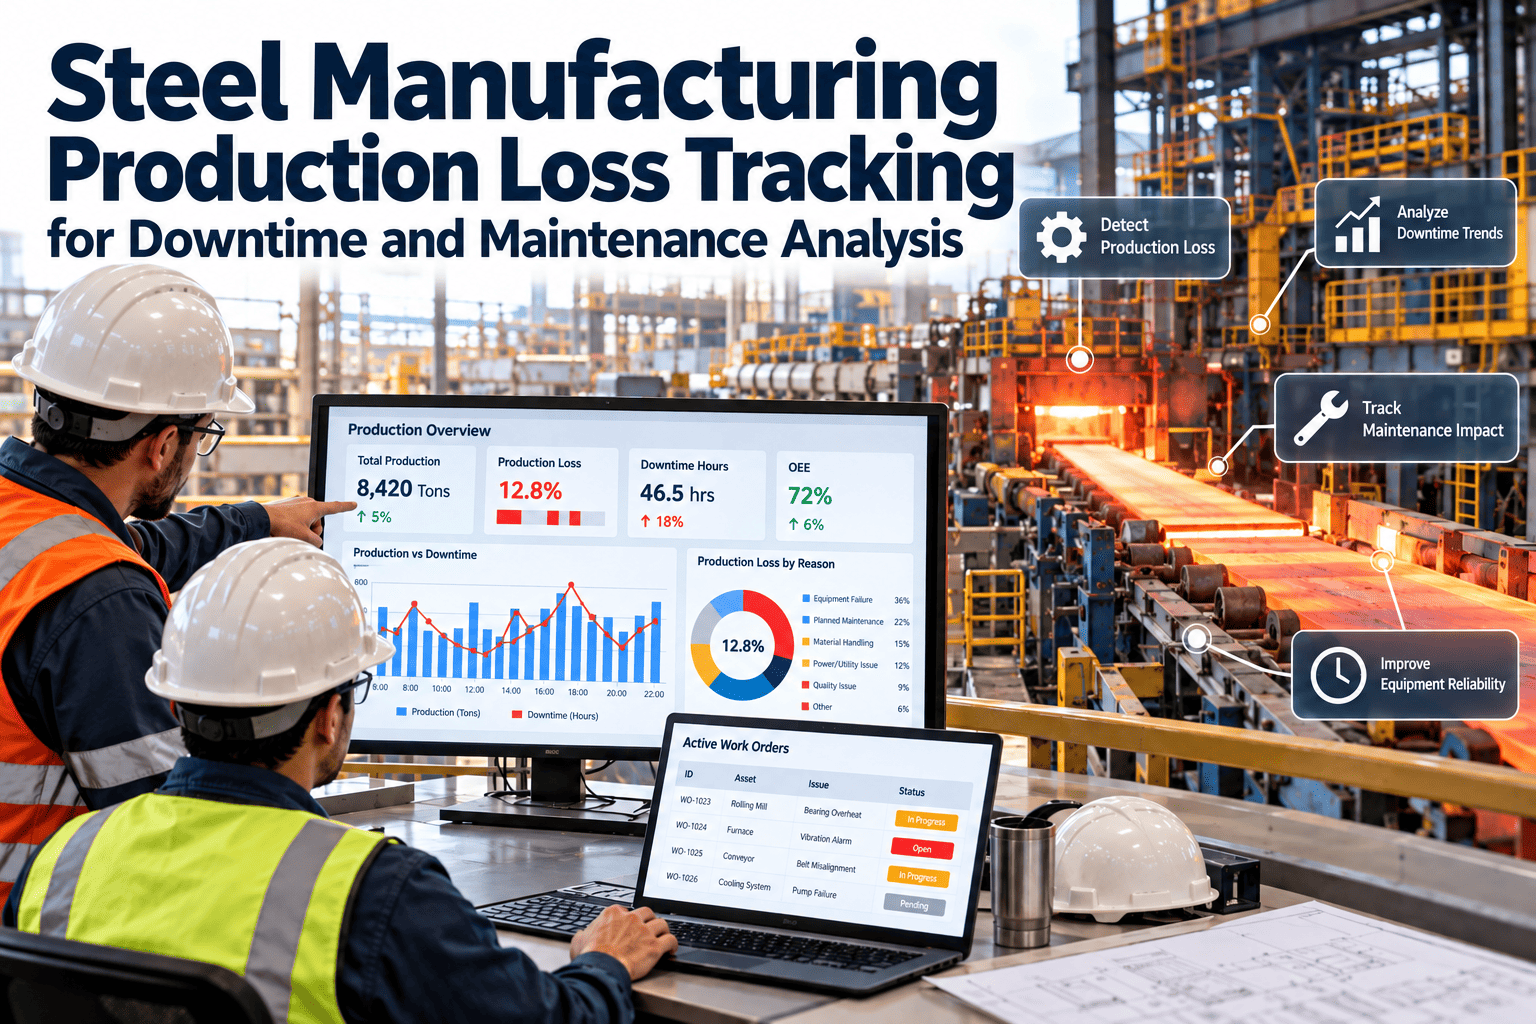
Breakdowns, setup delays, minor stops, speed loss, startup rejects, and process defects rarely show up as six separate line items on a shift report. A CMMS built around the classic loss taxonomy captures each one automatically, so mill managers finally see where tonnage actually disappears.
Why Vague Downtime Logs Cost Steel Producers Real Tonnage
Steel production runs on tight thermal and mechanical windows, and every minute a caster, mill stand, or furnace sits idle has a cost that compounds fast. The trouble is that most plants still record downtime the way they did twenty years ago: a handwritten reason code, a rough duration, and a shrug. When a stand jams for four minutes six times in a shift, that reads as "minor" on paper even though it is thirty minutes of lost rolling time — often more than a single major breakdown. Without a shared loss taxonomy, two supervisors on the same line will code an identical stoppage under two different labels, and the resulting data becomes unusable for anything beyond a monthly headline number.
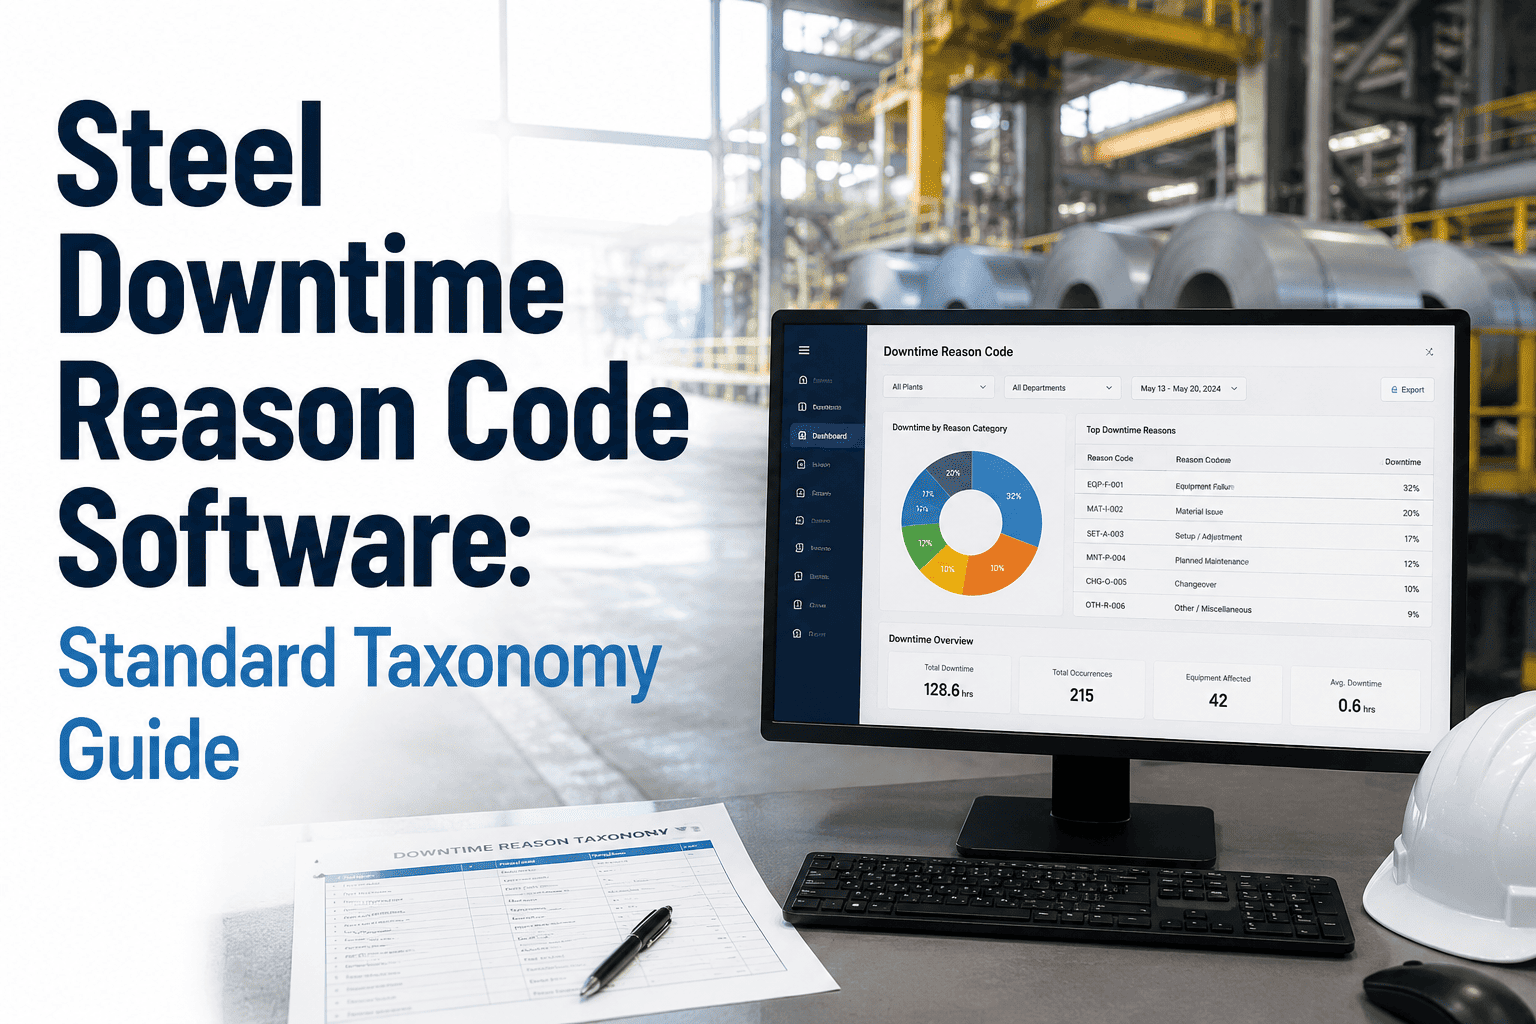
The six big losses framework, adapted from lean manufacturing and long used in discrete industries, gives steel plants a common language for exactly this problem. Breakdowns, setup and adjustment, minor stops, reduced speed, startup rejects, and process defects between them account for almost every form of lost production time. Once a CMMS enforces these categories at the point of capture — rather than leaving them to memory at the end of a shift — the resulting reports stop being a formality and start being a genuine improvement roadmap.
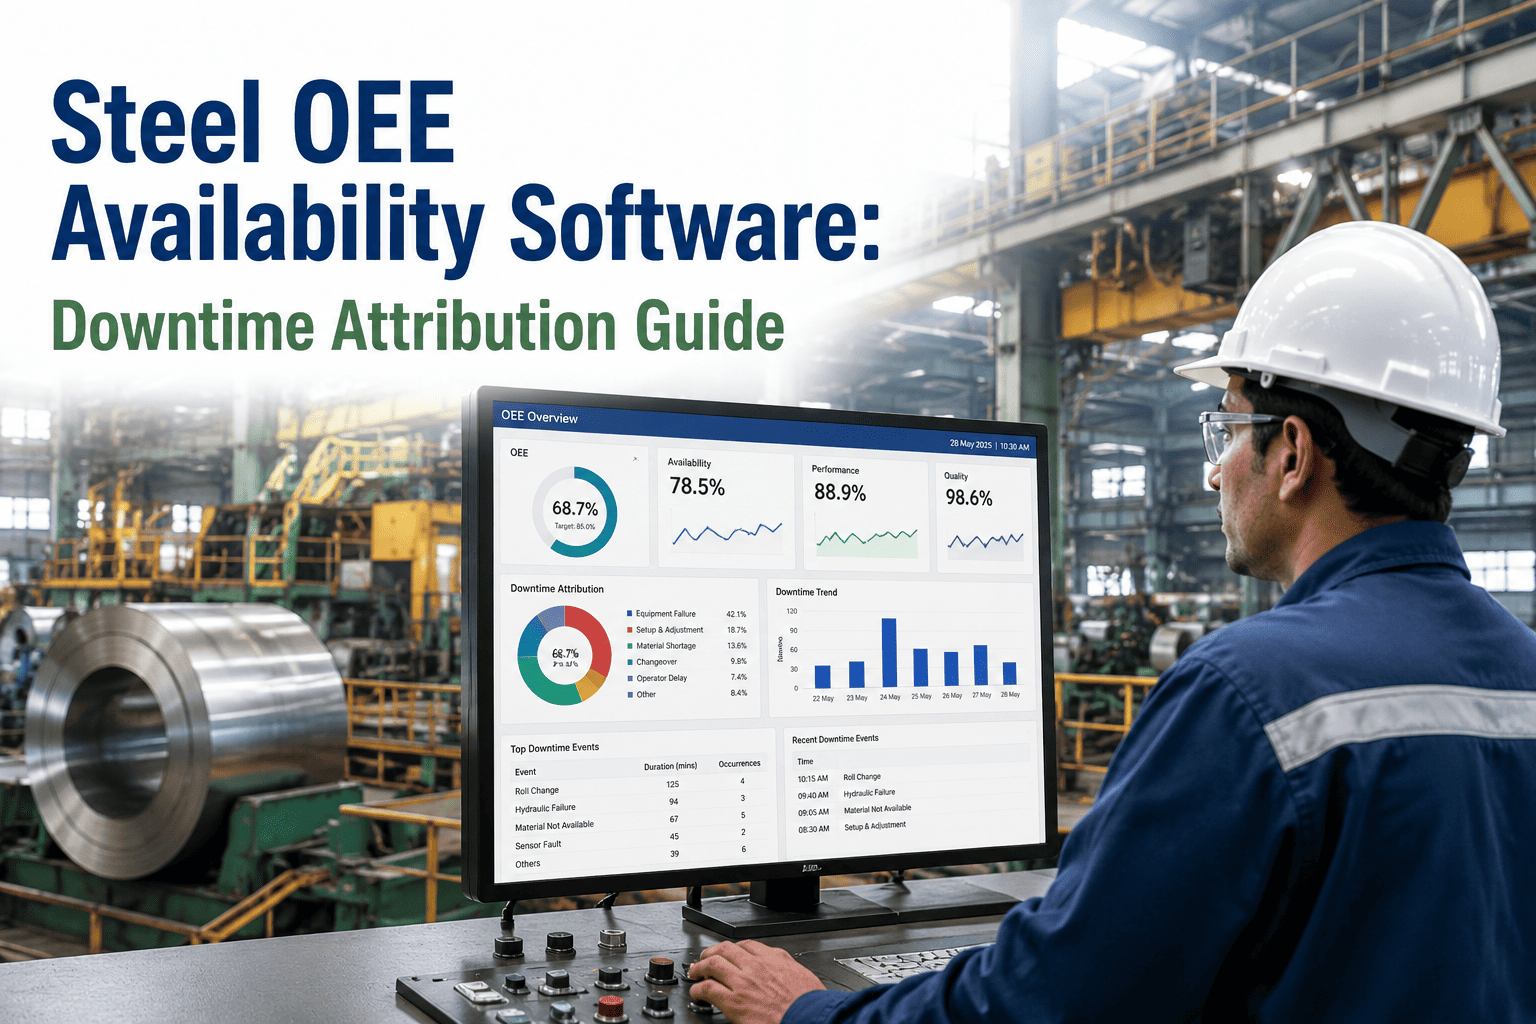
It also matters that the six categories map cleanly onto the three components of overall equipment effectiveness: availability, performance, and quality. Breakdowns and setup time reduce availability, minor stops and reduced speed reduce performance, and startup rejects and process defects reduce quality. A plant that tracks all six consistently is, in effect, already measuring OEE correctly without needing a separate calculation layered on top of an unreliable downtime log.
How a CMMS Captures and Classifies Loss
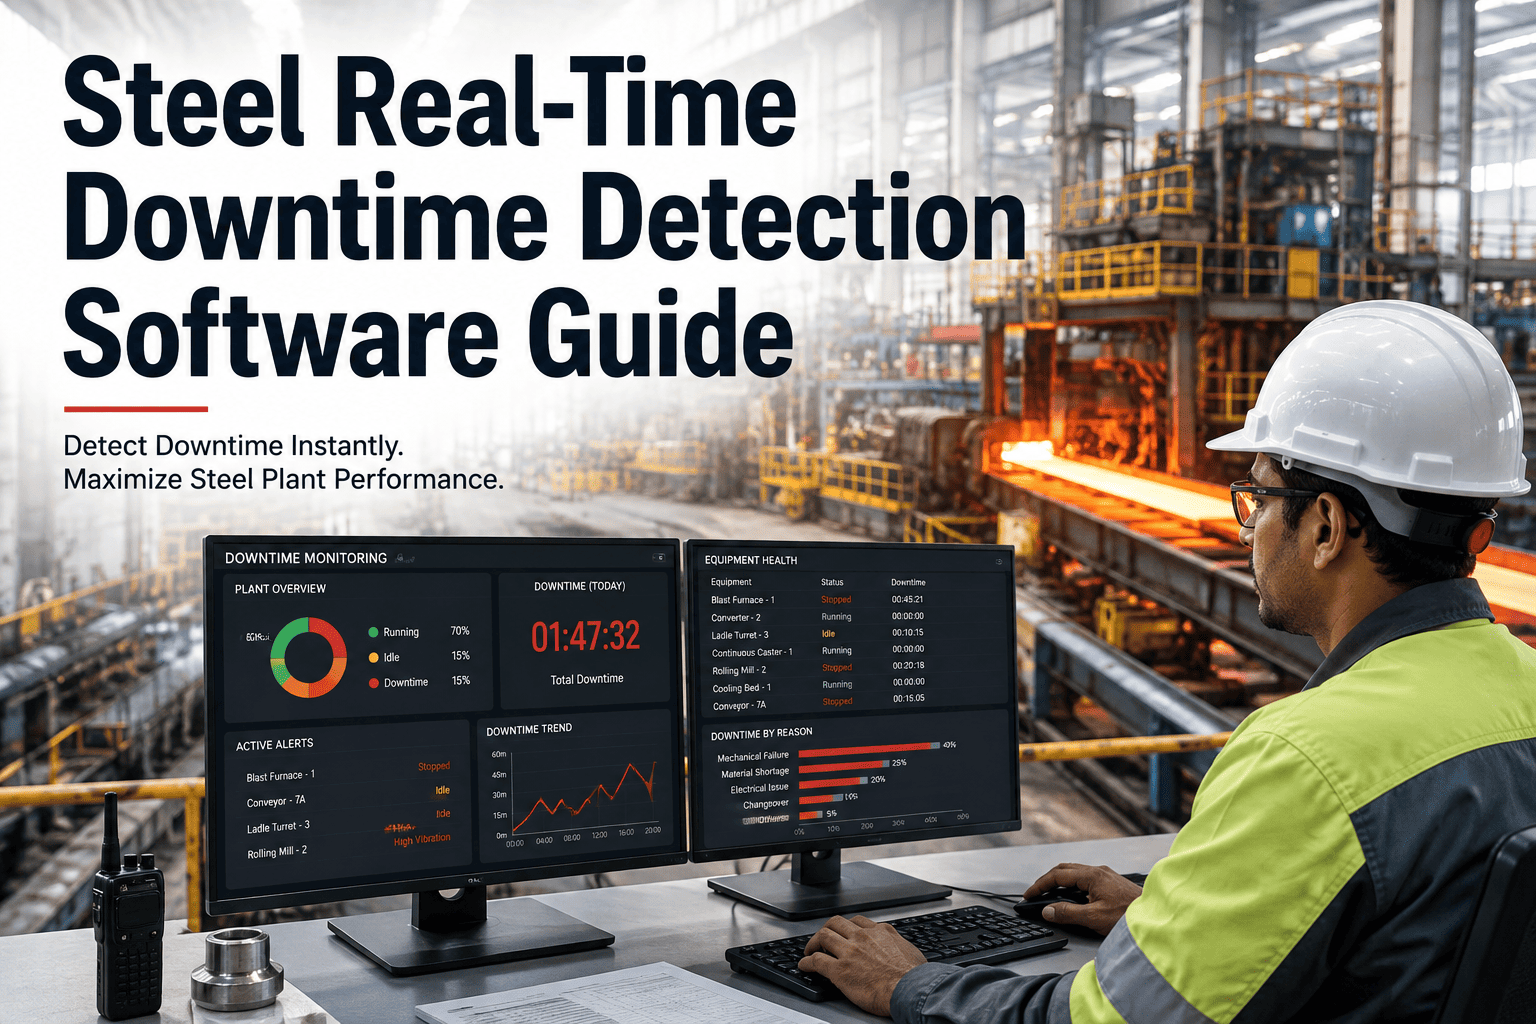
Categorising loss well is less about the taxonomy itself and more about how consistently it gets applied at the moment a stoppage happens. A connected CMMS removes the guesswork by giving operators a short, fixed list of causes to choose from the instant a line stops, and by pulling automatic signals — motor current, line speed, PLC fault codes — to flag stops that nobody manually logged at all.
This matters most for the categories that are easiest to under-report. A major breakdown gets noticed by everyone on the floor and almost always makes it into a log somewhere, but a two-minute jam repeated forty times a shift rarely gets the same attention, even though the total lost time can exceed a single breakdown by a wide margin. Automatic capture closes exactly that gap, and it does so without adding any extra work for the operator running the line.
What Changes Once Losses Are Categorised
The value of a loss taxonomy is not the labels themselves — it is what a maintenance team can finally do once every stoppage carries a consistent, comparable tag. Root cause analysis stops being a guessing exercise across three different shift logs and becomes a query against clean, structured data. Capital requests get easier to justify because a reliability engineer can point to an exact loss category, its cost, and its trend rather than an anecdote from the floor.
This shift also changes how improvement teams spend their limited time. Instead of chasing the loudest complaint from the most recent shift meeting, a reliability engineer can open a ranked list of the six loss categories by cost impact and know with confidence which one deserves the next project. Over several quarters, that discipline compounds — each category shrinks a little further, and the plant's overall equipment effectiveness score becomes something people trust rather than something they quietly disregard.
| Loss Category | Typical Occurrence | Common Steel Plant Example |
|---|---|---|
| Breakdowns | Weekly, high severity | Roll bearing seizure on a hot strip mill stand |
| Setup & Adjustment | Every grade change | Roll change and gauge calibration between coil widths |
| Minor Stops | Multiple per shift | Coil wrapper jam clearing under two minutes |
| Reduced Speed | Ongoing, low visibility | Line run below rated speed after a near-miss event |
| Startup Rejects | Every restart | Off-gauge material during furnace ramp-up |
| Process Defects | Batch dependent | Surface scale rejected at final inspection |
Common Mistakes Plants Make When Categorising Downtime
Even plants that adopt the six big losses framework on paper often undermine it in practice through a handful of recurring habits. The first is letting operators choose from an open text field instead of a fixed list — free text always drifts, and within a few months the same event gets described a dozen different ways across shifts and crews, which defeats the entire purpose of a shared taxonomy.
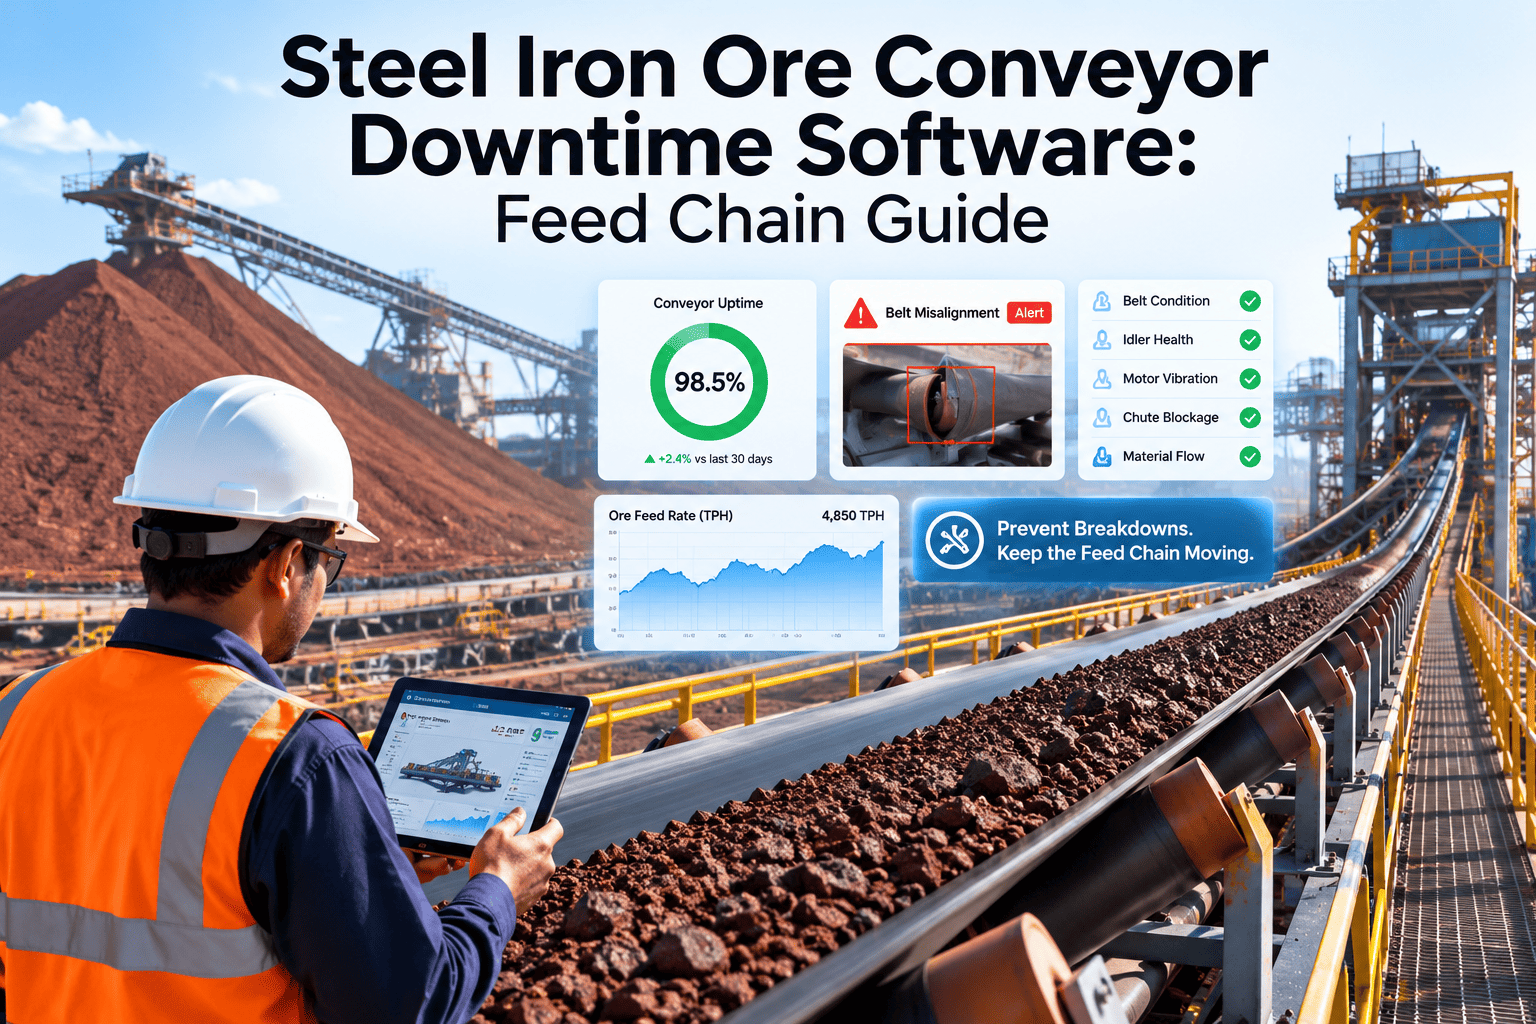
The second common mistake is capturing only stoppages long enough to notice on a control room screen, which quietly excludes the minor stops category almost entirely. Because these short jams and blockages rarely last more than a few minutes, they disappear from manual logs even though their cumulative impact on a shift is often larger than a single breakdown. Automatic detection through PLC signals is the only reliable way to capture this category consistently.
A third mistake is treating the loss categories as a reporting exercise rather than an operational one. If the six big losses only appear in a monthly slide deck for management, nobody on the floor has a reason to tag stoppages carefully in real time. The categorisation needs to feed a weekly or even daily review that reliability engineers and shift supervisors actually use to decide what gets fixed next, or the discipline of tagging accurately will fade within a quarter.
Rolling Out Loss Categorization Across a Plant
Introducing a shared loss taxonomy works best as a staged rollout rather than a single switch-flip, since operators, planners, and reliability engineers all need to trust the new categories before they will use them consistently. Most plants find that the biggest early win comes simply from mapping their existing, messy reason codes onto the six categories, since that step alone usually reveals which category has been hiding the most lost tonnage all along.
Expert Perspective: Reliability Teams on Loss Categorization
Frequently Asked Questions
A steel plant does not need a perfect taxonomy to start seeing value — it needs a consistent one. Even a rough first pass at mapping existing downtime codes onto the six big losses will usually surface at least one category that has been quietly draining tonnage for years without anyone noticing, and that single discovery is often enough to justify the rest of the rollout.