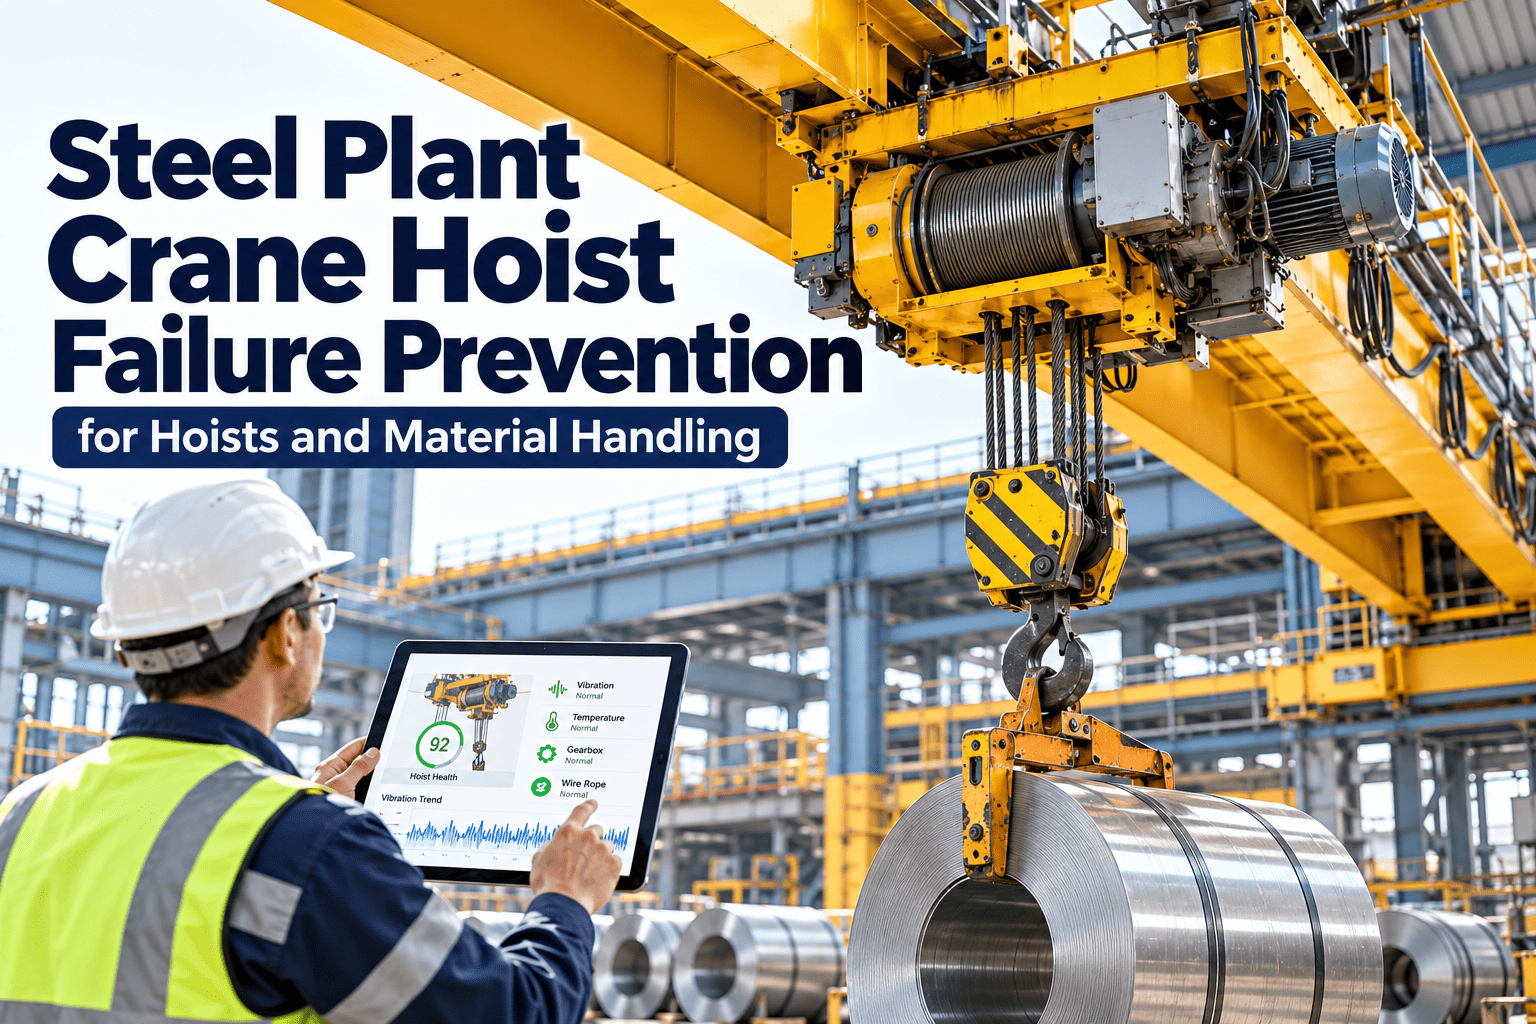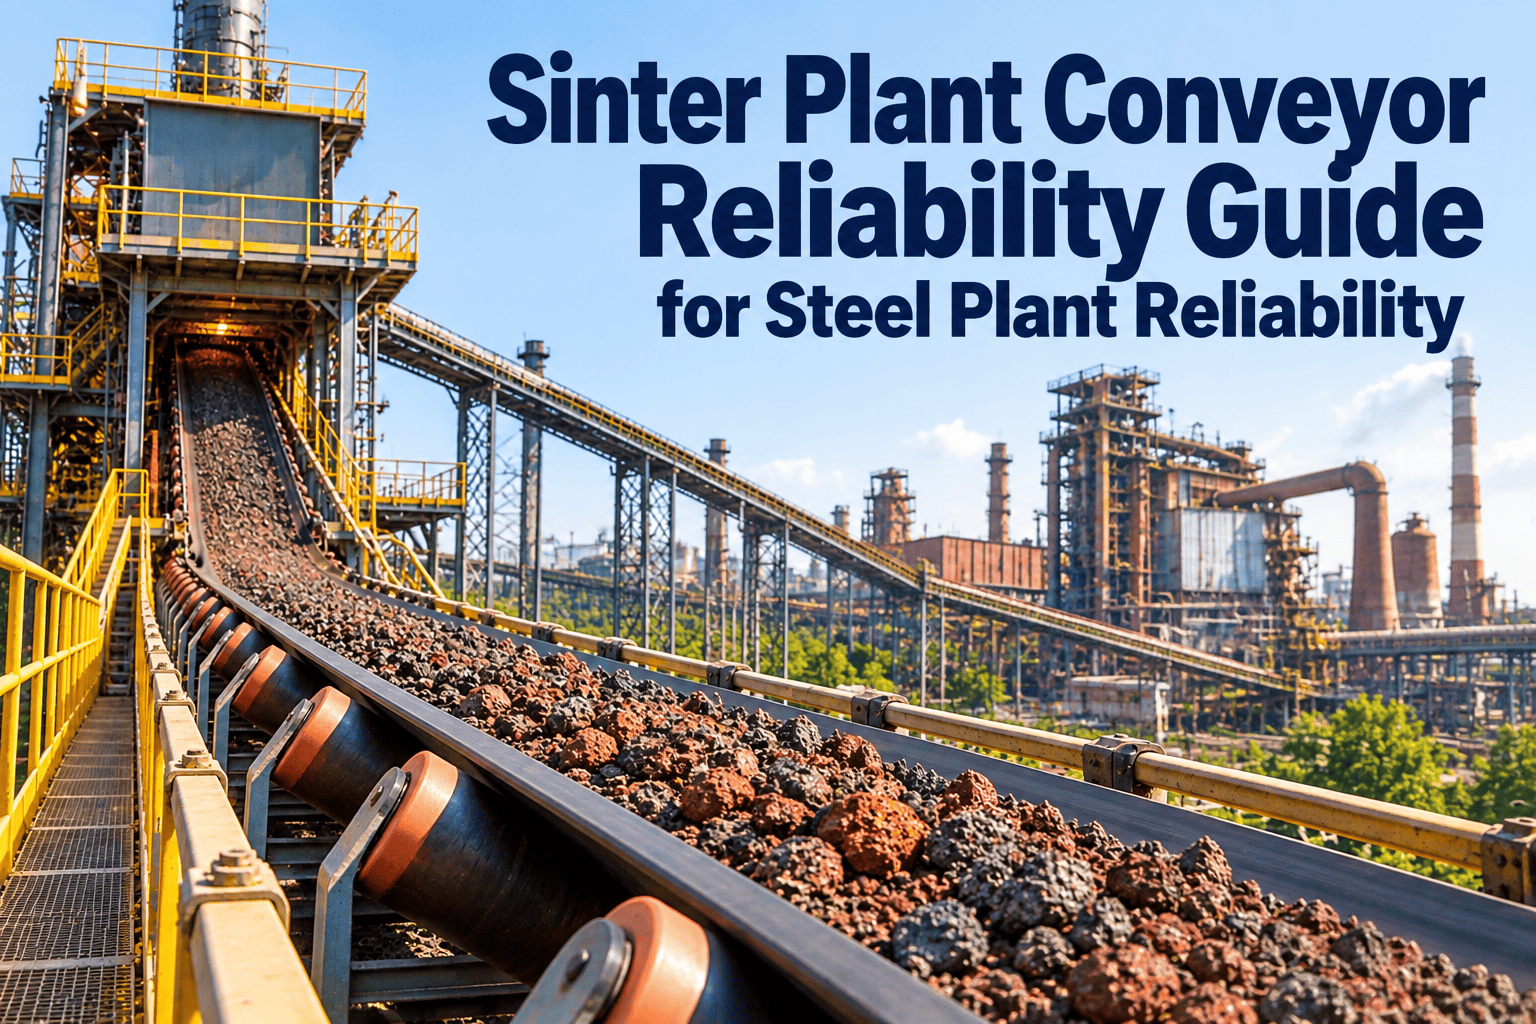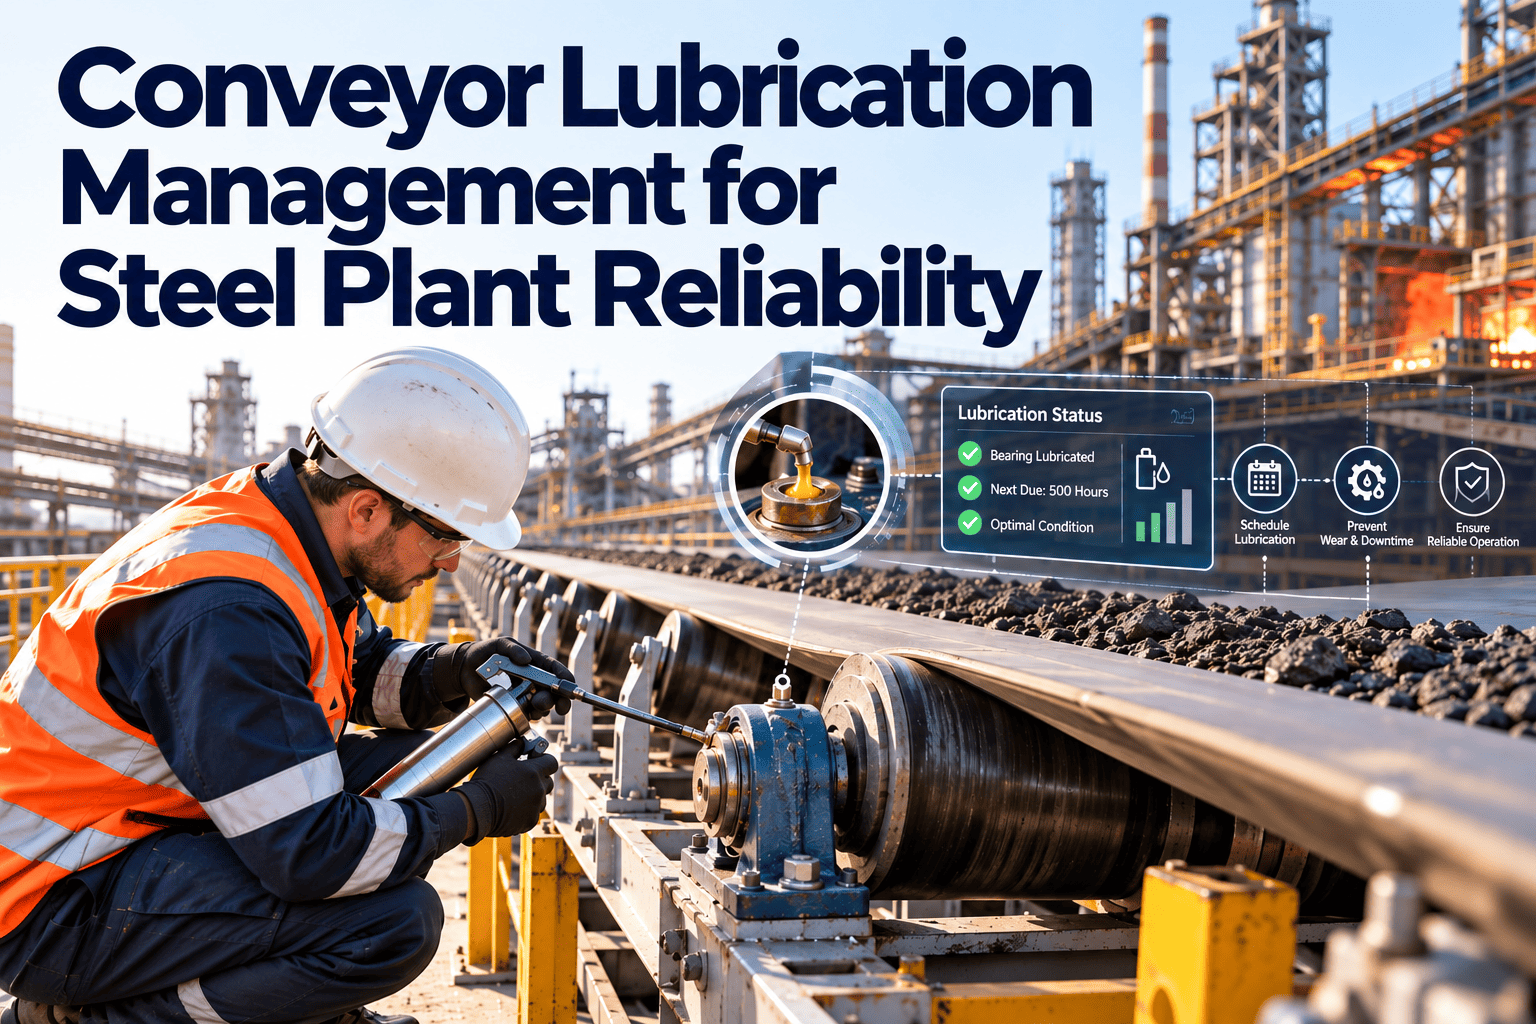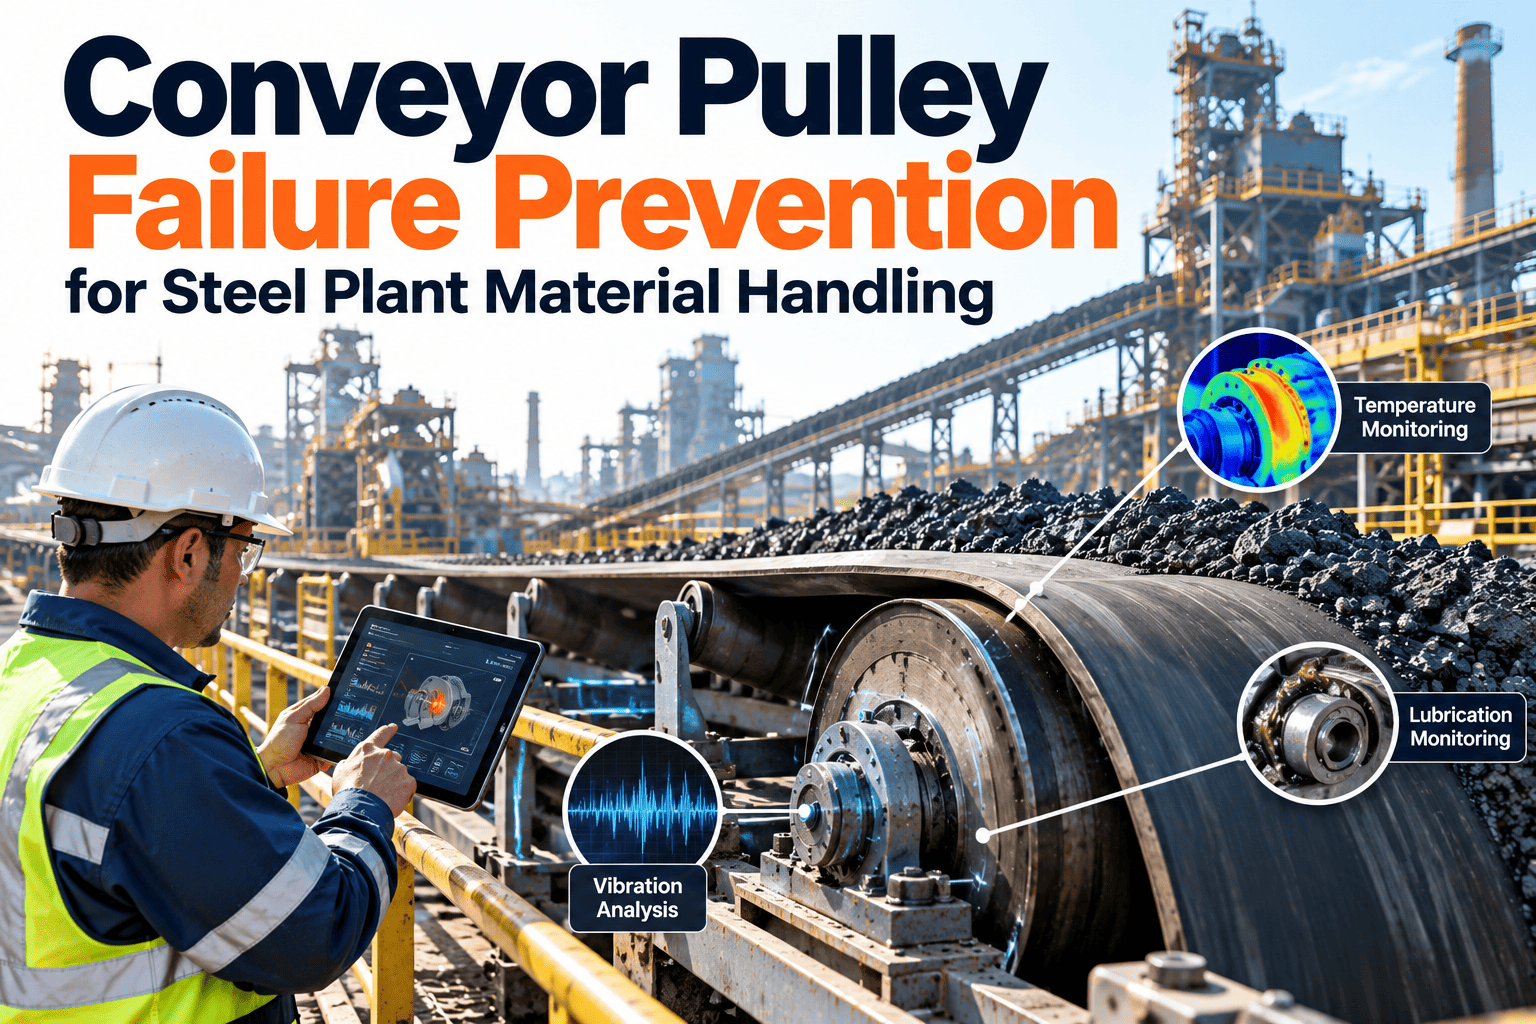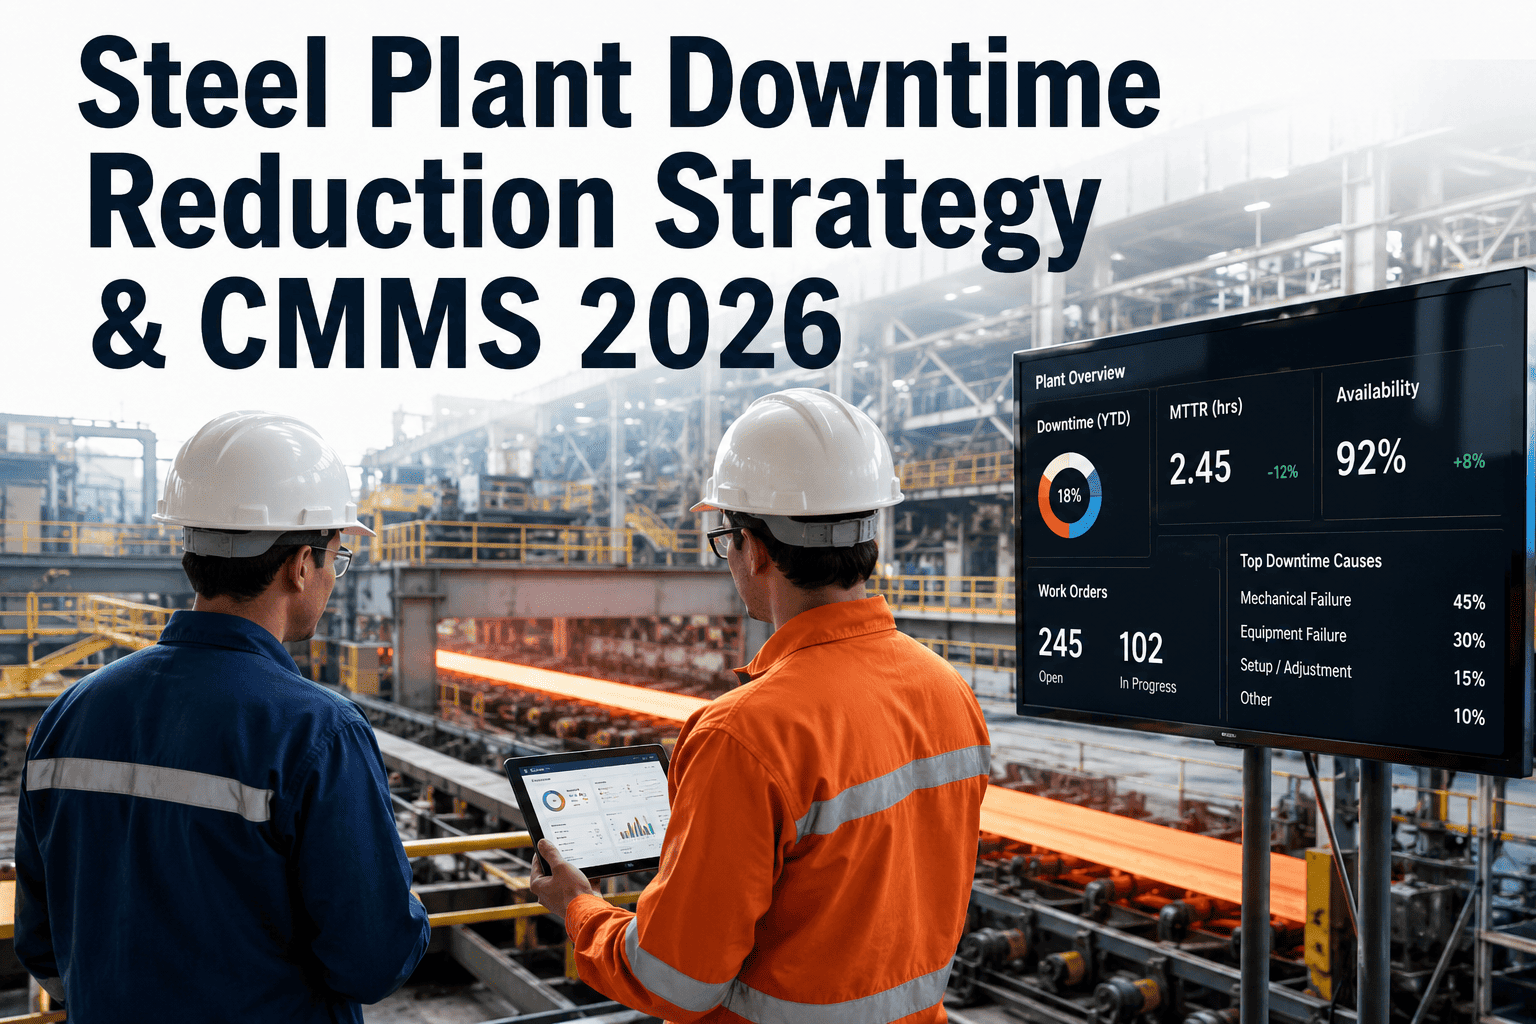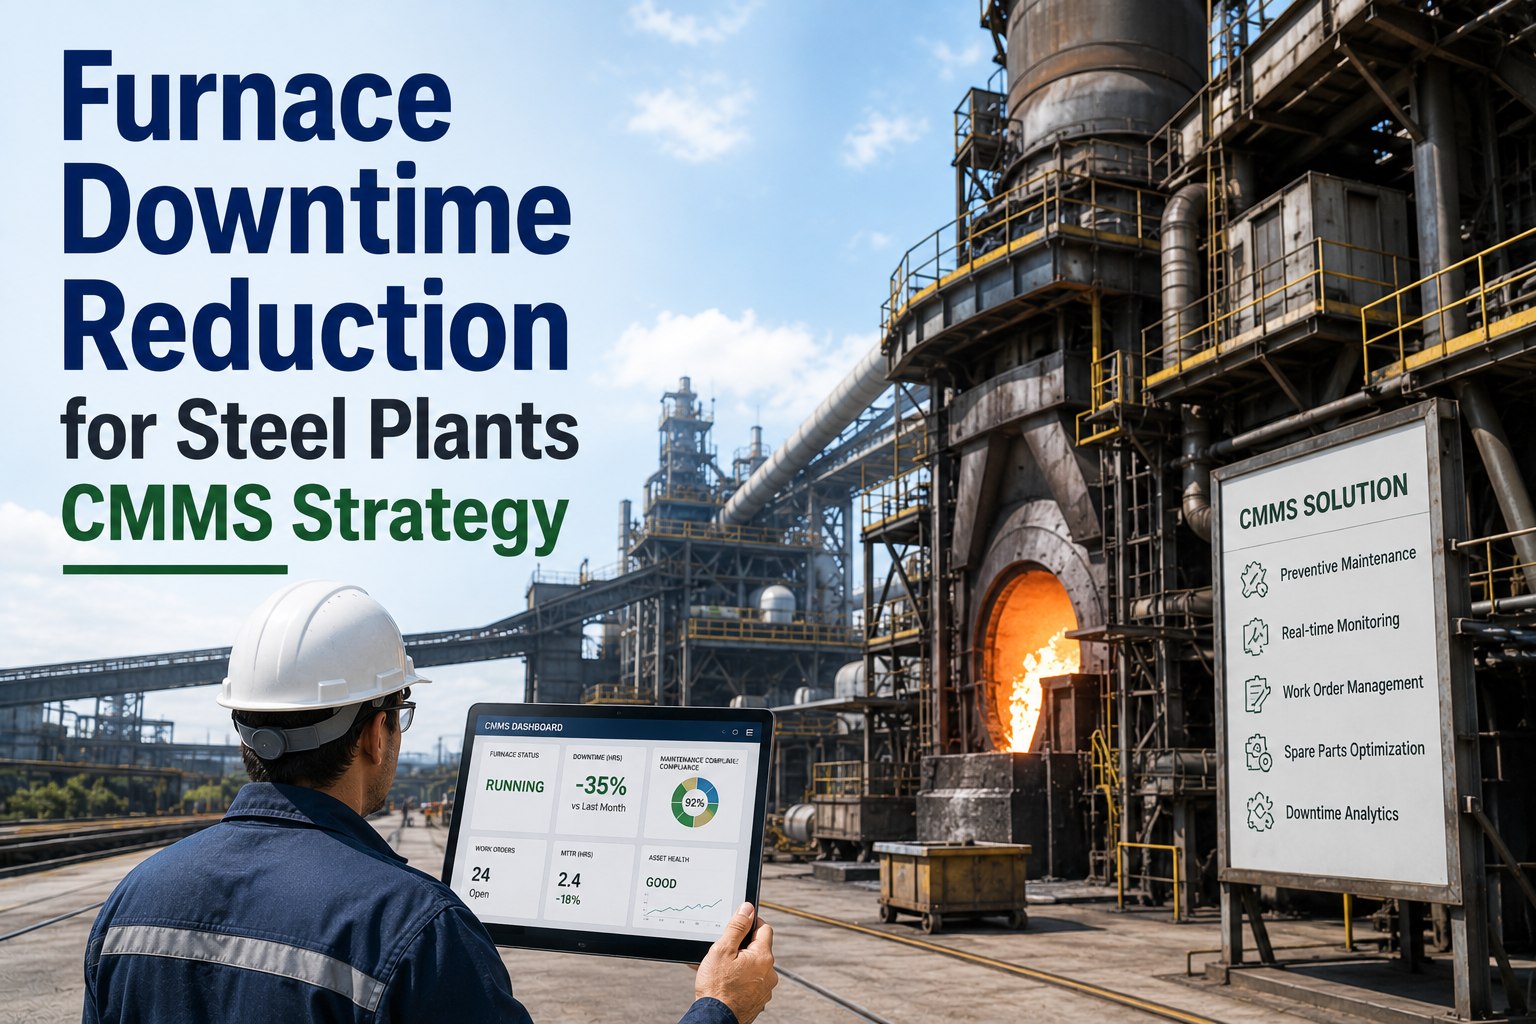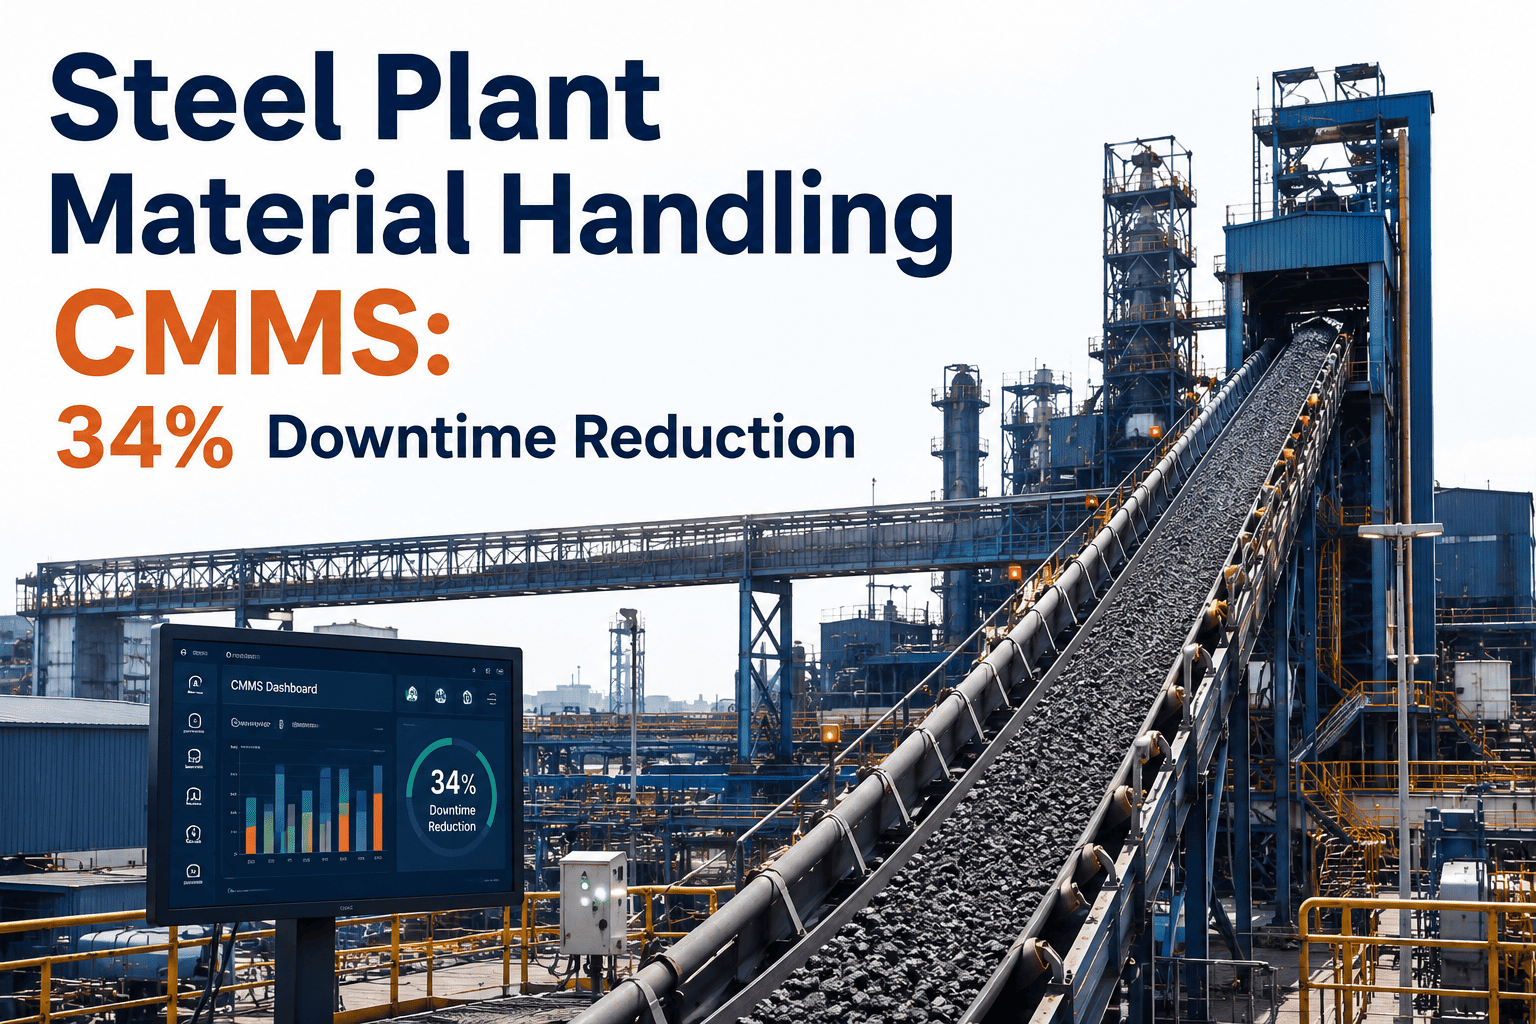
Material handling equipment causes up to 34% of unplanned downtime in a typical steel plant — more than any single process asset, including furnaces and rolling stands. Conveyors, overhead cranes, and ladle transfer cars sit between every major process step, so when one seizes, the blast furnace burden runs down, the caster waits on hot metal, and the whole line stalls behind a $340 bearing. Bulk conveyor downtime alone runs close to $1,000 a minute in lost production, and a single seized idler can escalate into a six-figure loss within hours. Most plants still catch these failures after the belt stops, not before. This guide breaks down where that 34% hides and how a CMMS closes the gap with bad actor tracking, criticality-based PM, and route-based condition monitoring — start a free trial with Oxmaint to see where your handling fleet stands today.
Stop Losing 34% of Plant Uptime to Conveyors, Cranes, and Ladle Cars
Bad actor analysis, criticality-weighted PM, and route-based condition monitoring for the handling fleet that connects every process in your mill.
Material Handling Failures Rarely Look Like the Real Problem
A stalled conveyor or a crane that won't lift never shows up on the report as "material handling failure" — it shows up as "furnace idle" or "caster waiting on heat." Steel plants are tightly coupled, so a $340 bearing on a transfer conveyor becomes twelve hours of cascading disruption as every upstream and downstream process backs up, slows, and restarts out of sequence. By the time the cost gets attributed, it's buried under the process asset that stopped, not the handling equipment that caused it.
Where the 34% Actually Comes From
Material handling is not one asset class — it is five distinct equipment groups, each failing for different reasons and each needing a different detection strategy. Ranking your fleet against these categories is the fastest way to find where downtime is concentrating.
Warning Signs That Predict Failure Before the Line Stops
Handling equipment almost never fails without warning. The signals are there weeks in advance — the problem is that most plants have no system built to notice them until the belt is already down.
| Warning Sign | What It Looks Like | Typical Cost If Missed | Detection Method |
|---|---|---|---|
| Elevated idler temperature | Bearing running hot on a routine thermal scan | $50,000–$150,000 | Infrared thermal imaging route |
| Recurring belt misalignment | Same conveyor tracking off center week after week | $10,000–$40,000 | Tracking sensor and inspection log |
| Crane brake drift | Hoist brake requiring more travel to engage over time | $100,000+ per incident | Scheduled brake torque testing |
| Rising spillage volume | Cleanup crew reporting more material loss at a chute | $5,000–$20,000 monthly | Spillage volume logging by zone |
| Vibration outlier | Gearbox reading drifting above fleet baseline | $30,000–$90,000 | Route-based vibration analysis |
| Overdue PM work order | Inspection sitting open past its due date, unprioritized | Full cascade cost of failure | CMMS overdue-PM escalation rules |
Every Minute a Conveyor Stalls Costs You Roughly $1,000
Oxmaint tracks bad actor assets, criticality, and condition data across your entire handling fleet so warning signs surface weeks before the belt actually stops.
From Reactive Repairs to Predictive Reliability in 4 Steps
Reducing material handling downtime is not one project — it is a sequence of disciplines, each building on the last, until the equipment that used to surprise you starts showing its hand weeks in advance.
Reactive Maintenance vs. CMMS-Driven Reliability
How Oxmaint Tracks Material Handling Reliability
Oxmaint ties every conveyor, crane, and car to a live asset record, so bad actor ranking, PM scheduling, and condition data all live in one closed loop instead of scattered spreadsheets.
Every failure event is logged against its asset with cascading cost, not just repair cost, so the worst offenders in your handling fleet surface automatically.
Belt grade, cover gauge, wear thresholds, and splice type are stored per conveyor zone, preventing procurement errors on high-temperature or fire-resistant sections.
PM frequency is set by cascading impact per asset instead of a flat calendar, so the conveyor feeding a single furnace gets tighter intervals than a redundant belt.
Acoustic idler surveys, thermal imaging routes, and gearbox vibration trending are scheduled and logged against each asset's maintenance history.
Every stoppage is tied to its full downstream cost, not just the repair invoice, giving reliability teams the real number to justify PM investment.
Spillage volume by chute and transfer point is tracked over time, flagging liner wear and belt misalignment before they escalate into stoppages.
What Structured Handling Reliability Delivers
Frequently Asked Questions
Why does material handling cause more downtime than furnaces or rolling stands?
Handling equipment connects every process step, so a single failure cascades both upstream and downstream instead of stopping one asset in isolation. Start a free trial to map your own handling fleet's cascade risk.
What is bad actor analysis and why does it matter here?
It ranks assets by failure frequency and cascading cost so maintenance effort goes to the small share of conveyors, cranes, and cars actually driving most of the downtime. Book a demo to see bad actor ranking in action.
How early can condition monitoring actually catch a handling failure?
Vibration, thermal, and acoustic trending typically surface bearing and drive faults two to three weeks before they become an unplanned stoppage. Start a free trial to configure PdM routes on your bad actor assets.
Does criticality-based PM replace fixed maintenance calendars entirely?
It replaces a flat calendar with intervals weighted by cascading impact, so assets feeding a single process get tighter attention than redundant equipment. Book a demo to see how criticality weighting is configured.
Can Oxmaint track spillage and housekeeping alongside maintenance data?
Yes. Spillage volume is logged by chute and transfer point alongside PM and condition data, so liner wear and misalignment surface in the same system. Start a free trial to log your first spillage zone.
Your Handling Fleet Is Costing You 34% of Uptime — Start Recovering It
Oxmaint ranks bad actor assets, weights PM by cascading impact, and tracks condition data across every conveyor, crane, and car in your plant. Free trial, no credit card required.