A caster runs 6.5 hours out of an 8-hour shift and the availability number reads 81%. That number alone tells a plant manager almost nothing. Was it a bearing failure, a ladle changeover that ran long, a material shortage from upstream, or a planned maintenance window that ate into production time? Availability is the first pillar of OEE, and it is the pillar most steel plants get wrong — not because the math is hard, but because the minutes of downtime never get attributed to a real reason. Every unattributed minute is a minute nobody can act on. If your downtime log still reads "line down" instead of a specific, defensible reason code, start a free trial with Oxmaint to see what attribution looks like when it's tied directly to work orders.
OEE · Availability · Downtime Attribution
Steel OEE Availability Software: The Downtime Attribution Guide
Availability is Run Time divided by Planned Production Time — a simple ratio that hides a hard discipline underneath it. This guide breaks down how availability is actually calculated, why generic "downtime" logging destroys its value, and how a reason-code-driven CMMS turns every stopped minute into something a supervisor can defend and a reliability team can act on.
90%+
Availability world-class discrete manufacturing plants target; continuous process lines aim higher
1 of 3
Availability is one of the three OEE factors — and the one most directly tied to attributed downtime
0
The improvement value of a downtime minute logged with no reason code attached to it
Why This Number Gets Distorted
Availability Is Simple Math on Top of a Hard Discipline
The formula for availability is one division. What makes it hard is everything that happens before the division: agreeing on what counts as planned time, catching every stop the moment it happens, and assigning it a real cause instead of a shrug. Skip any one of those steps and the resulting percentage still looks precise — two decimal places, clean dashboard — while actually representing very little. A plant that logs downtime accurately but never assigns a specific reason still ends up chasing symptoms rather than causes, because "the line was down" doesn't tell a reliability engineer where to start.
The Number Is Only as Good as the Log
An availability percentage calculated from incomplete or approximated downtime data will always look better than reality, because unlogged minutes simply disappear from the math entirely.
Consistency Matters More Than Precision
A plant that applies the same definitions every shift, even slightly imperfect ones, gets more useful trend data than one that recalculates its rules every time someone new builds the report.
Attribution Is Where the Value Actually Lives
The availability percentage tells you how much time was lost. The reason code tells you what to do about it — and only one of those two numbers drives an improvement project.
Where Availability Actually Gets Lost
The Downtime Reason Hierarchy Steel Plants Should Attack in Order
Not all downtime deserves the same attention first. A structured hierarchy, prioritized by frequency and impact, gets more availability back per hour of improvement effort than chasing whatever failure happened most recently.
Level 1
Chronic Small Stops
Short stoppages that individually look insignificant but repeat dozens of times a shift. A 30-second stop happening 40 times steals 20 minutes — often more than a single major breakdown, and almost always invisible without attributed logging.
Level 2
Changeover and Setup Time
Grade changes, ladle swaps, and roll changes that run longer than planned. Usually the fastest availability win available, since the process already exists — it just needs to be measured against its own standard.
Level 3
Equipment Breakdowns
Unplanned failures with the highest per-event impact. Fewer in count than chronic stops, but each one can wipe out an hour of availability in a single incident.
Level 4
Planned Maintenance Windows
Scheduled stops that still count against availability in most methodologies. Frequently overlooked as an improvement target because it's "supposed" to happen — but a window that consistently overruns is still lost availability.
Attribution Is the Whole Point
"Line Down for 40 Minutes" Tells You Nothing. "Bearing Failure, Idler 14, 40 Minutes" Tells You What to Fix.
Oxmaint ties every downtime minute to a reason code and a work order, so your availability number comes with the evidence behind it — not just a percentage on a dashboard.
Why Attribution Breaks Down
The Usual Reasons Downtime Attribution Fails on the Floor
01
Reason Codes Are Too Generic
A code list with "mechanical," "electrical," and "other" gives operators nowhere accurate to put a specific failure, so most events default to whichever code is fastest to select under time pressure.
02
Logging Happens After the Fact
When downtime is recorded from memory at the end of a shift instead of at the moment the line stopped, duration and cause both get approximated — sometimes badly.
03
No Link Back to the Work Order
A downtime entry that isn't connected to the maintenance work order for the same event means the reliability team and the production team are tracking two different, disconnected stories of the same incident.
04
Planned Downtime Gets Miscounted
Including scheduled breaks in the availability denominator, or excluding a maintenance window that should count, quietly distorts the number in either direction and erodes trust in it.
05
Small Stops Never Get Logged at All
A 30-second stall doesn't feel worth stopping to record. Multiplied by dozens of times a shift, those unlogged seconds are frequently the single largest hidden loss category on the line.
06
Reports Are Built Weeks Later
If a Pareto of top downtime causes only gets built once a month, chronic issues have weeks to keep recurring before anyone with authority to fix them even sees the pattern.
How It Should Work
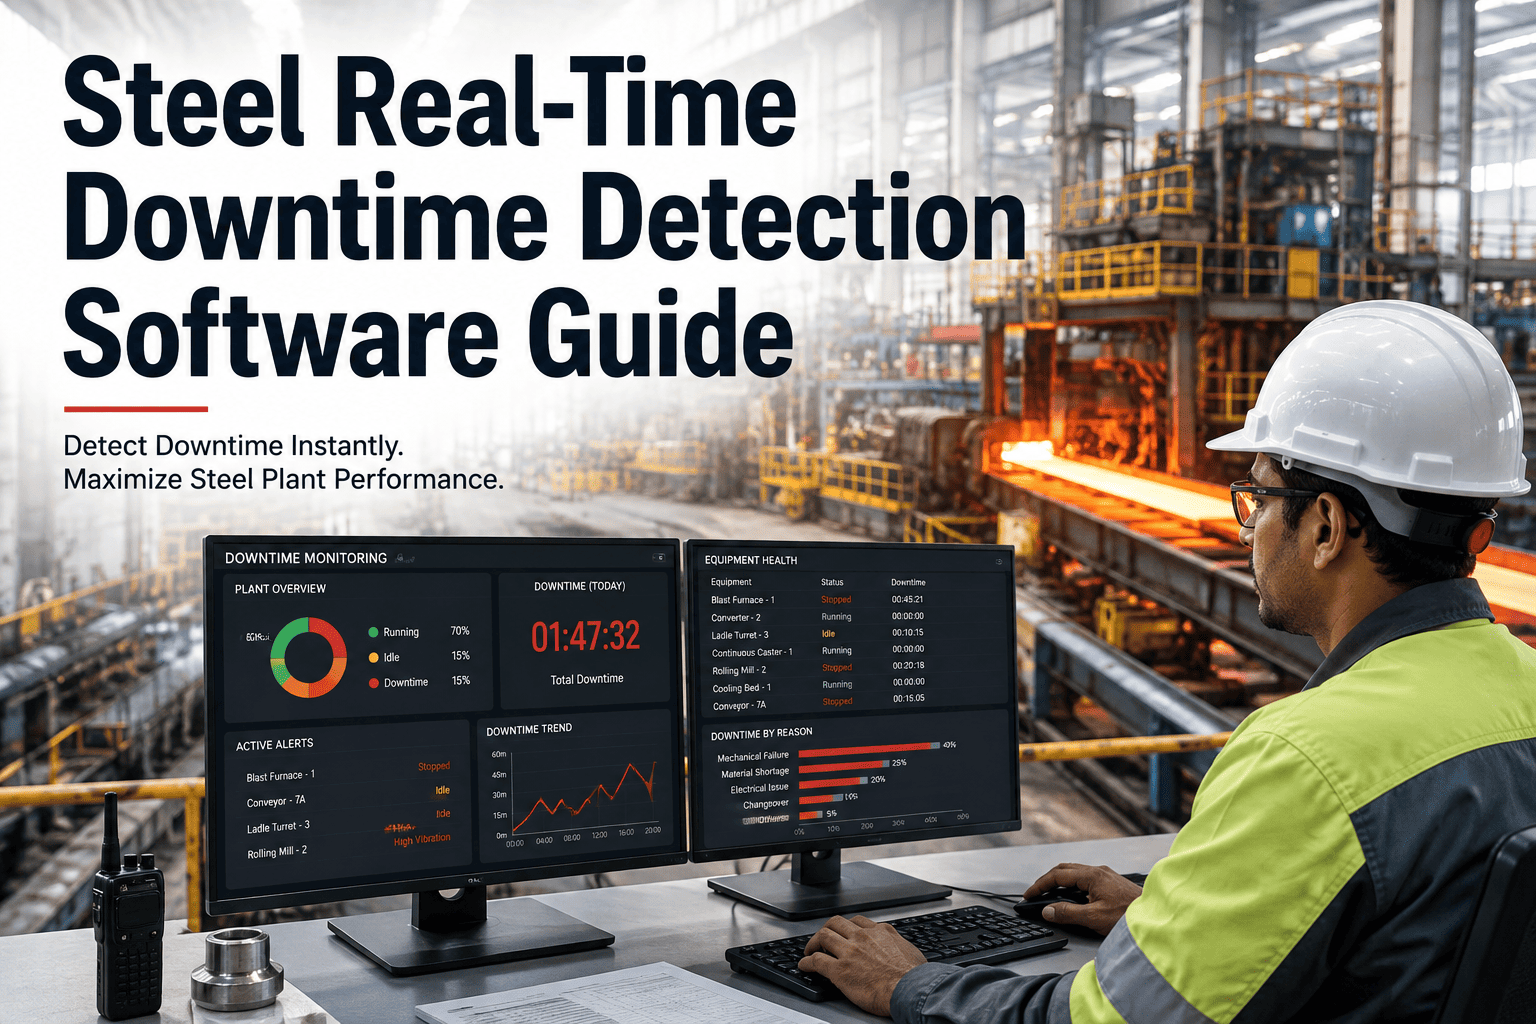
Downtime Attribution From Stop to Root-Cause Report
Stop
Line Stops — Timer Starts Automatically
A stop is detected from a PLC signal or operator input the moment it happens, not reconstructed later, so the duration is accurate to the minute.
Code
Operator Selects a Specific Reason Code
A structured code list — specific enough to be useful, short enough to select in seconds — captures the actual cause instead of a generic catch-all bucket.
Link
Event Ties to a CMMS Work Order
If the stop requires maintenance intervention, the downtime event and the work order share the same record, so the repair history and the availability loss tell one consistent story.
Resume
Line Restarts — Duration Locks In
The moment production resumes, the stop duration is finalized and rolled into that shift's availability calculation automatically.
Rank
Reason Codes Roll Into a Live Pareto
Instead of waiting for a monthly report, the top downtime causes for the shift, day, or week are visible continuously, ranked by total minutes lost.
Act
Top Cause Becomes an Improvement Target
The reliability team attacks the highest-ranked recurring cause first — following the hierarchy from chronic stops through breakdowns — instead of chasing whatever failed most recently.
Building the Code List
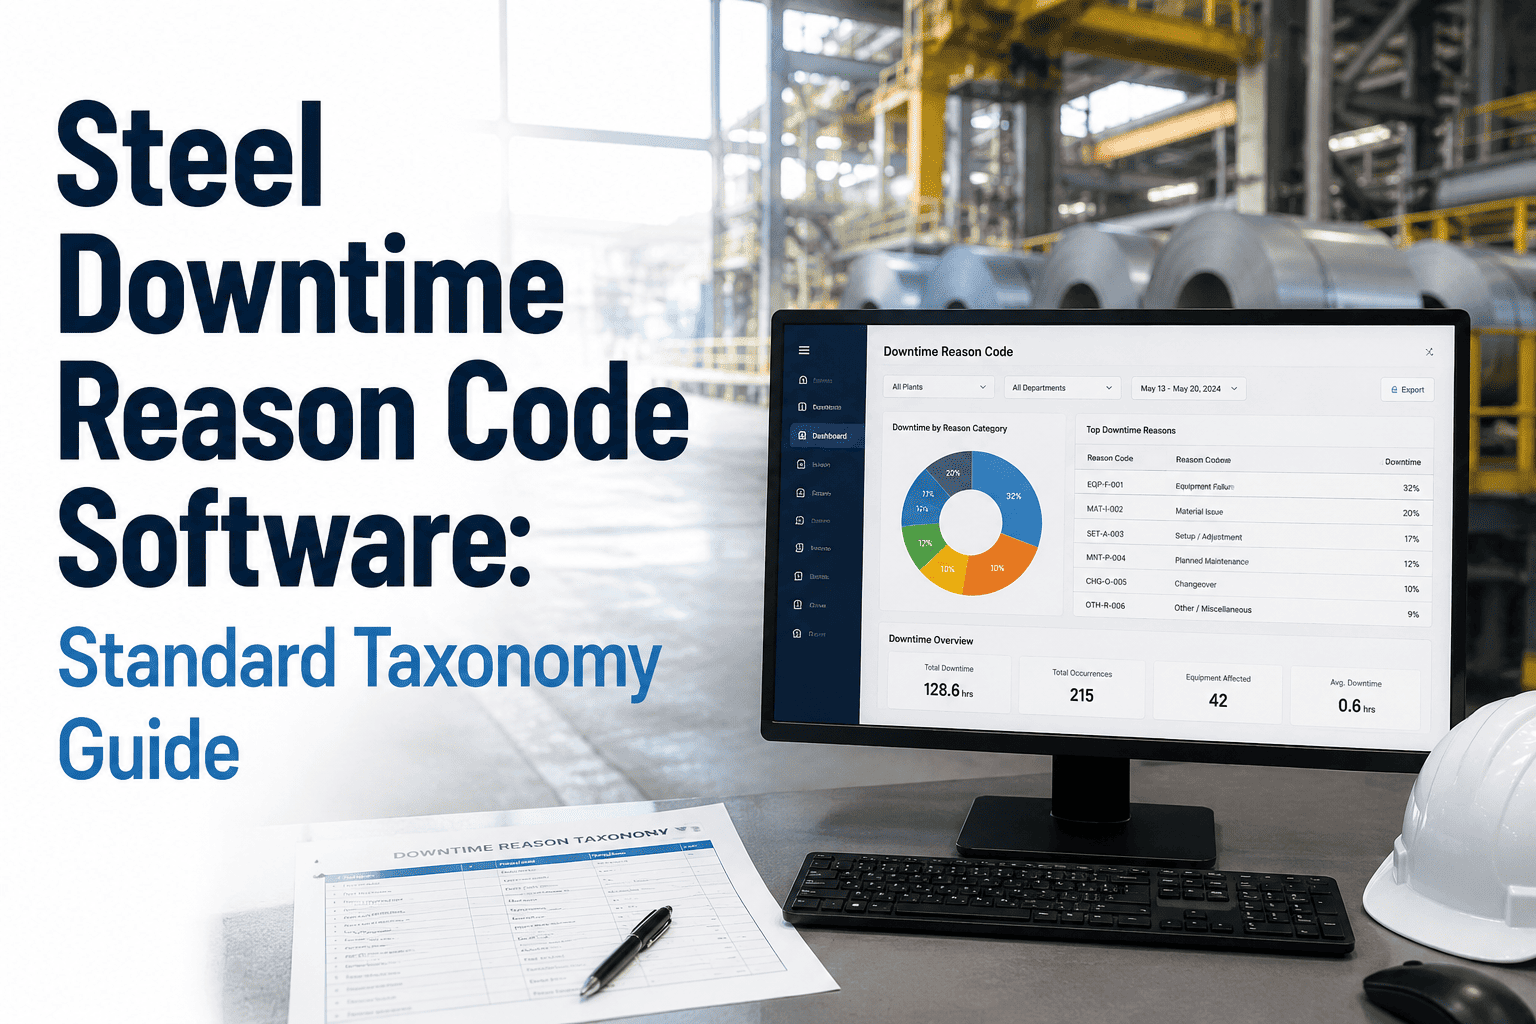
A Reason Code Taxonomy That Actually Holds Up
Most attribution failures trace back to a reason code list that's either too vague to be useful or too granular for an operator to select correctly under pressure. A workable taxonomy sits in the middle.
| Category | Example Codes | Counts Against Availability |
| Equipment failure |
Bearing, motor, hydraulic, electrical fault |
Yes — unplanned |
| Changeover / setup |
Grade change, roll change, ladle swap |
Yes, if it exceeds standard time |
| Material shortage |
Upstream feed delay, inventory stockout |
Yes — unplanned |
| Quality hold |
Off-spec product, inspection stop |
Yes — unplanned |
| Planned maintenance |
Scheduled PM, inspection window |
Depends on methodology — track consistently |
| No operator / staffing gap |
Break coverage gap, crew shortage |
Usually excluded from planned time |
One Consistent Code List, Every Shift
A Reason Code Taxonomy Only Works If Every Shift Uses the Same One
Oxmaint standardizes reason codes across every line and shift, so a Pareto built from this month's data actually compares to last month's — instead of comparing incompatible logging habits.
What Attributed Downtime Changes
What Plants Report After Moving to Real-Time Attribution
+5-8
Availability Points in 90 Days
Plants that move from paper logs to real-time, reason-coded tracking commonly see this range of gain within the first quarter, largely from surfacing losses that were previously invisible.
40-60%
Of Downtime Was "Invisible"
A meaningful share of total downtime typically goes unlogged under manual, end-of-shift reporting — mostly chronic small stops nobody thought were worth recording individually.
1 List
Instead of Every Shift's Own Habits
Standardized reason codes mean a Pareto chart from one shift is directly comparable to another, instead of reflecting whichever supervisor happened to be on duty.
Live
Instead of Monthly Reporting
A recurring cause gets caught and escalated within days, not discovered a month later after it has already repeated dozens of times.
Quick Reference
Where to Start Your Attribution Program
| Your Situation | Where to Start | Why |
| Downtime logged at end of shift from memory |
Move to real-time, stop-triggered logging |
Removes estimation error in both duration and cause |
| Reason codes are vague or inconsistent |
Rebuild taxonomy with 15-25 specific codes |
Specific enough to act on, short enough to select fast |
| Chronic small stops feel "too minor" to log |
Auto-capture stops under two minutes |
Often the single largest hidden loss category |
| Downtime and work orders live in separate systems |
Link every attributed stop to its work order |
One consistent record instead of two conflicting ones |
Common Questions
OEE Availability and Downtime Attribution — Frequently Asked Questions
Should planned maintenance count against availability?+
Most plants using the common Nakajima method include planned maintenance stops that occur during scheduled production time, since it surfaces opportunities to reduce that time. Pick one convention and apply it consistently across every line.
How specific should our downtime reason codes actually be?+
Specific enough to point a technician at the right equipment, short enough for an operator to select in seconds under pressure. Somewhere around fifteen to twenty-five codes per line usually hits that balance.
Book a demo to review a taxonomy for your equipment.
What's the fastest way to improve a low availability number?+
Start with chronic small stops rather than the most recent major breakdown. They're higher-frequency, often invisible under manual logging, and typically hold more total lost minutes than any single equipment failure.
Can attributed downtime data connect directly to our CMMS work orders?+
Yes, when the downtime event and the work order share the same record from the start.
Start a free trial to see downtime and repair history tracked together instead of separately.
Why does our availability number look different from what operators report on the floor?+
This usually points to a mismatch in what counts as "planned production time" or unlogged short stops that never made it into the record. Auditing both definitions is the first step to reconciling the gap.
From the Floor
What Plant Teams Say
Our availability number used to move around depending on who was writing the shift report. Once we switched to real-time reason codes tied to work orders, we found out chronic two-minute stops on the roughing stand were costing us more than any single breakdown all quarter. Nobody had ever seen that pattern because nobody had ever logged those stops individually before.
— Production Manager, Integrated Steel Facility
Every Minute, Attributed
Stop Reporting an Availability Percentage. Start Reporting What's Actually Costing You Minutes.
Oxmaint ties every stop to a reason code and a work order in real time, so your availability number comes with a ranked, defensible answer for what to fix first.