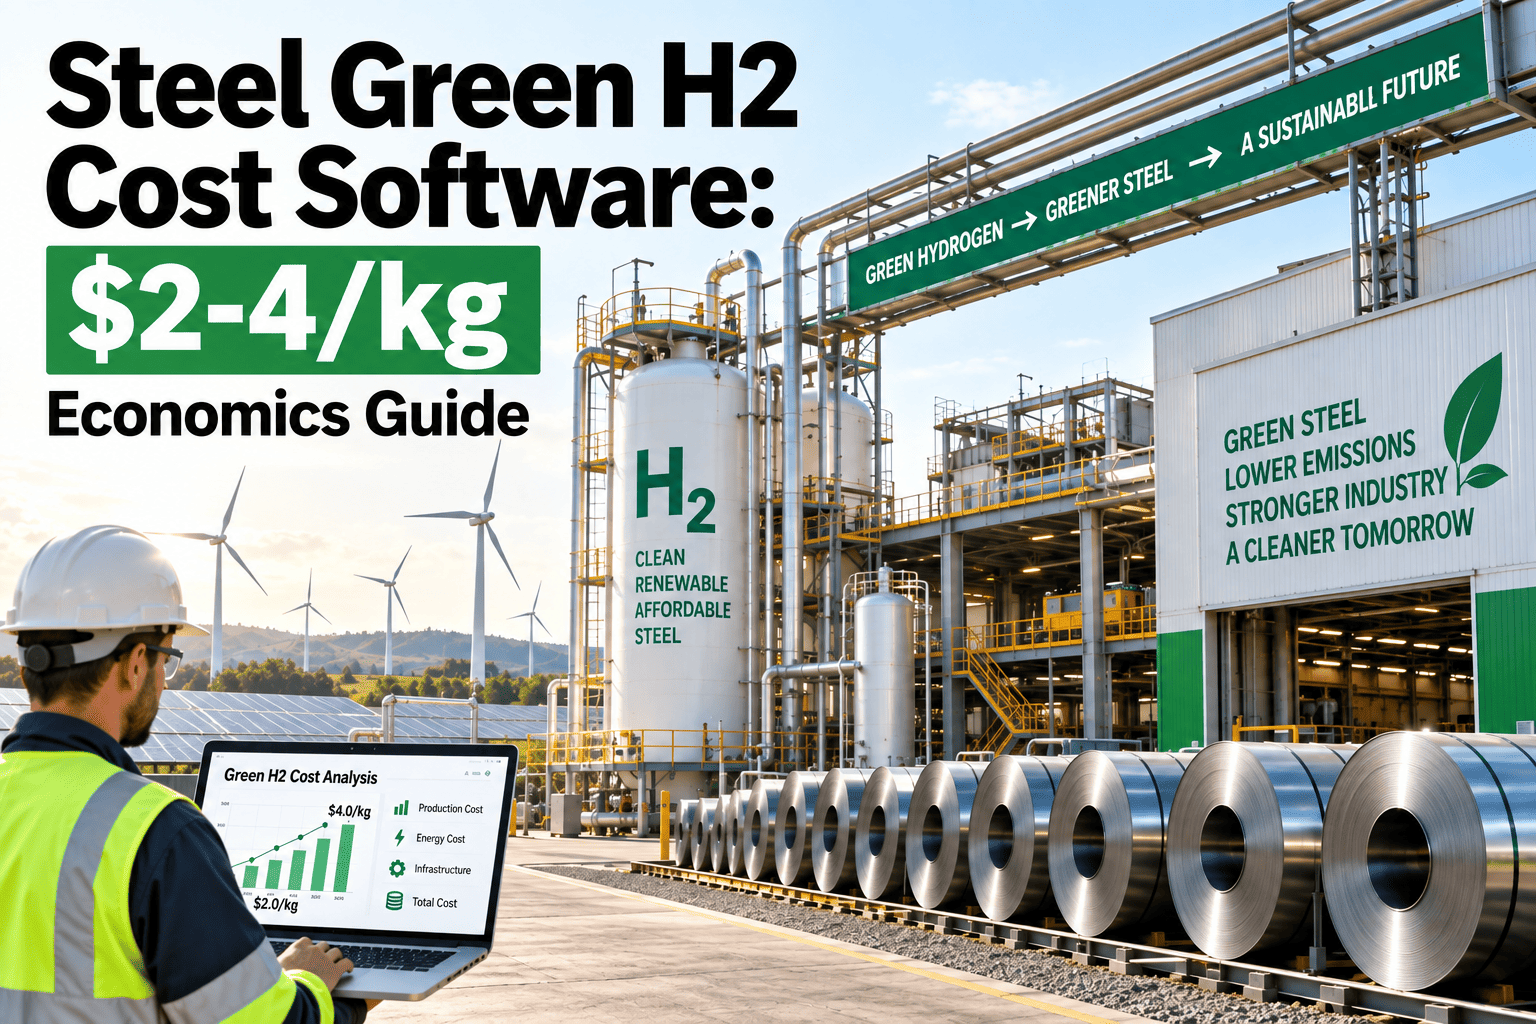
The investment case for hydrogen-based direct reduced iron almost always comes down to one number: the delivered cost of green hydrogen per kilogram. Techno-economic studies consistently show that green H2-DRI becomes cost-competitive with conventional routes once hydrogen lands somewhere in the $1.60–$2.50/kg range, yet plants approving these projects are often modeling that number once at final investment decision and never tracking it again as electrolyzer performance, power contracts, and delivery logistics evolve Book a Demo.
Hydrogen-DRI Investment Economics
Your green steel business case lives or dies on the real, delivered cost of hydrogen
Green hydrogen production costs still range from roughly $2.50 to $7.00 per kilogram unsubsidized. Tracking your plant's actual delivered H2 cost against target economics is the discipline that keeps a DRI investment case honest.
Why $2–4/kg Matters
The hydrogen price band that decides whether green DRI pencils out
Multiple independent techno-economic analyses converge on a similar break-even story: green H2-DRI-EAF steelmaking approaches cost parity with conventional blast furnace-basic oxygen furnace production once hydrogen procurement cost falls below roughly $2/kg, and integrated studies place the break-even for direct-reduction-grade hydrogen closer to $1.60–$1.70/kg when process integration is optimized.
Above that band, every dollar per kilogram translates directly into a steel price premium. At today's unsubsidized production costs — commonly cited in the $2.50–$7.00/kg range depending on electrolyzer technology, capacity factor, and renewable power cost — most projects are still operating with a real green premium that has to be justified by carbon pricing, offtake agreements, or policy incentives.
Cost Drivers
What actually moves delivered hydrogen cost, heat by heat
The levelized cost of hydrogen quoted in a feasibility study is a snapshot. The delivered cost a plant actually pays shifts continuously with four operational variables.
Electrolyzer capacity factor
Downtime, degradation, and curtailment during low-renewable periods reduce effective output, spreading fixed capital cost over fewer kilograms produced.
Renewable power price and availability
Power purchase agreement pricing, grid balancing costs, and curtailment windows directly set the largest single input cost in electrolysis.
Stack degradation and maintenance
Electrolyzer stack efficiency declines over its service life; deferred maintenance accelerates that decline and raises the effective cost per kilogram produced.
Storage, compression, and delivery losses
Compression energy, boil-off, and pipeline or trucking losses between production and the DRI shaft furnace all add to the delivered — not nameplate — cost.
Route Comparison
How steelmaking routes compare on cost and hydrogen sensitivity
| Route | Approx. Cost per Tonne | Sensitivity to H2 Price | Primary Cost Lever |
|---|---|---|---|
| BF-BOF (conventional) | ~$500–$550/t | None | Coking coal and iron ore prices |
| NG-DRI-EAF | ~$450–$550/t | Low | Natural gas price |
| Green H2-DRI-EAF (current) | ~$650–$800/t | Very high | Delivered green hydrogen cost |
| Green H2-DRI-EAF (target economics) | ~$540–$570/t | High | Hydrogen cost at or below ~$2/kg |
These figures move with regional power prices, carbon pricing regimes, and capital cost assumptions — the point is not a fixed number but the pattern: no other input in the green H2-DRI-EAF cost stack moves the needle as much as the delivered hydrogen price.
Model your delivered H2 cost against target economics
Book a walkthrough and we will show how OxMaint tracks electrolyzer performance, maintenance, and delivered hydrogen cost in one operational dashboard.
Closing The Gap
What closes the gap between $2.50–$7.00/kg and the $2–4/kg target zone
Maximize electrolyzer uptime
Condition-based maintenance on stacks, rectifiers, and balance-of-plant equipment reduces unplanned downtime that silently raises cost per kilogram.
Track actual vs. modeled capacity factor
Comparing real production output against the feasibility study's assumed capacity factor surfaces the operational gaps driving up delivered cost.
Log stack degradation trends
Recording efficiency readings over time lets teams plan stack replacement or refurbishment before degradation quietly erodes output economics.
Reconcile power cost against contract terms
Renewable power purchase agreements often include curtailment and balancing clauses; tracking actual power cost against contract assumptions keeps the input cost model accurate.
Report delivered cost per kilogram monthly
A recurring, auditable delivered-cost figure — not a one-time feasibility number — is what investment committees and offtake partners need to track progress toward the target band.
Where OxMaint Fits
Operational tracking for hydrogen-DRI investment cases
OxMaint does not model hydrogen economics from a spreadsheet — it captures the maintenance and asset performance data that determines whether your plant's actual delivered cost tracks toward or away from your investment case.
Electrolyzer condition monitoring
Stack performance, degradation trends, and maintenance history are tracked per unit, feeding directly into uptime and efficiency reporting.
Preventive maintenance scheduling
Balance-of-plant equipment — compressors, purification skids, rectifiers — is scheduled for inspection before failures cause unplanned production loss.
Asset and inventory management
Critical spares for electrolyzer stacks and DRI shaft furnace components are tracked against lead time, reducing downtime risk on capital-intensive equipment.
Reporting dashboards
Uptime, capacity factor, and maintenance cost data roll up into dashboards that operations and finance teams can use to track progress against the investment case.
FAQ
Frequently asked questions about green hydrogen cost for steel
What hydrogen price makes green DRI cost-competitive?
Published techno-economic studies generally place the break-even point between roughly $1.60 and $2.00 per kilogram, depending on process integration, carbon pricing assumptions, and regional energy costs. Above that range, green H2-DRI-EAF typically carries a cost premium over conventional routes.
Why is delivered hydrogen cost different from the quoted production cost?
Production cost figures from feasibility studies assume a modeled capacity factor and degradation curve. Delivered cost reflects actual electrolyzer uptime, real power pricing, compression and storage losses, and maintenance costs — all of which can push the real number well above the model.
Does carbon pricing change the economics?
Yes. Carbon pricing mechanisms can meaningfully narrow the gap between green H2-DRI-EAF and conventional steelmaking by adding a cost penalty to high-emission routes, which several studies show can bring green hydrogen closer to cost parity even above $2/kg.
How does maintenance affect hydrogen cost per kilogram?
Unplanned electrolyzer downtime and undetected stack degradation both reduce effective output, spreading the same fixed capital and power costs over fewer kilograms of hydrogen — directly raising the real cost per kilogram delivered to the DRI process.
Can OxMaint track hydrogen production assets specifically?
OxMaint can be configured to track electrolyzer stacks, balance-of-plant equipment, and related maintenance and inventory records as part of a broader asset management program. Book a demo at calendly.com/oxmaintapp/30min to review your specific facility setup.
Turn your hydrogen-DRI feasibility model into an operating reality
Track electrolyzer uptime, maintenance cost, and delivered hydrogen economics in one place — so your investment case stays grounded in real plant data.
Free 14-day trial · No credit card