A steel plant is not one machine. It is a chain of very different assets, from blast furnace stoves and converter drives to caster segments, rolling mill gearboxes, ladle cranes and gas cleaning fans, and each fails in its own way. Buying one AI tool and pointing it at everything rarely works. A sound strategy decides which assets deserve prediction, which need simpler condition checks and which should stay on routine care. This guide lays out that strategy, and shows how a steel plant maintenance management platform turns alerts into work.
Steel Plant AI Predictive Maintenance Strategy for Multi-Asset Reliability
Match the right maintenance method to every asset class, so AI effort goes where failure is costly and data can support it.
Why multi-asset reliability is harder in steel
Steel operations combine extreme heat, heavy loads, dust, scale, water and continuous duty. That mix creates several problems for any predictive program.
Segment assets before choosing technology
Two questions sort most of the plant: how costly is failure, and how good is the data? The grid below turns those answers into a method.
Typical steel plant assets, signals and failure modes
The table shows where predictive methods usually fit. Actual signals depend on your instrumentation and the equipment maker's guidance.
| Area | Asset | Useful signals | Failure modes to watch |
|---|---|---|---|
| Ironmaking | Hot blast stoves, cooling circuits, top gas systems | Dome temperature, flow and outlet temperature, valve checks, vibration on turbines | Valve seat leakage, cooling blockage, refractory wear, gearbox degradation |
| Steelmaking | Converter or electric furnace drives, transformers, fume fans | Motor current, oil and winding temperature, vibration, dissolved gas trends where available | Gearbox wear, electrical insulation decline, fan imbalance, hydraulic leaks |
| Casting | Mold oscillators, segment rolls, hydraulic units, cooling water pumps | Oscillation signature, hydraulic pressure, roll bearing temperature, spray flow | Bearing seizure, nozzle blockage, servo valve wear, seal leakage |
| Rolling | Work and backup roll bearings, mill gearboxes, descalers, coilers | Vibration, lubricant condition, motor load, pump pressure | Bearing damage, gear tooth wear, lubrication failure, pump cavitation |
| Material handling | Ladle cranes, conveyors, transfer cars | Brake and hoist condition, motor current, wire rope inspection, belt condition | Brake wear, gearbox damage, rope fatigue, idler seizure |
| Utilities | Compressors, oxygen plant equipment, water pumps, fans | Pressure, temperature, vibration, power use | Valve wear, bearing failure, fouling, motor overload |
From sensor signal to completed repair
Prediction only creates value when the chain ends in a finished job. Each link needs an owner.
Give every alert a work order, an owner and a due date
See how asset records, inspections and work orders can sit behind your predictive program.
Prioritizing alerts without drowning the team
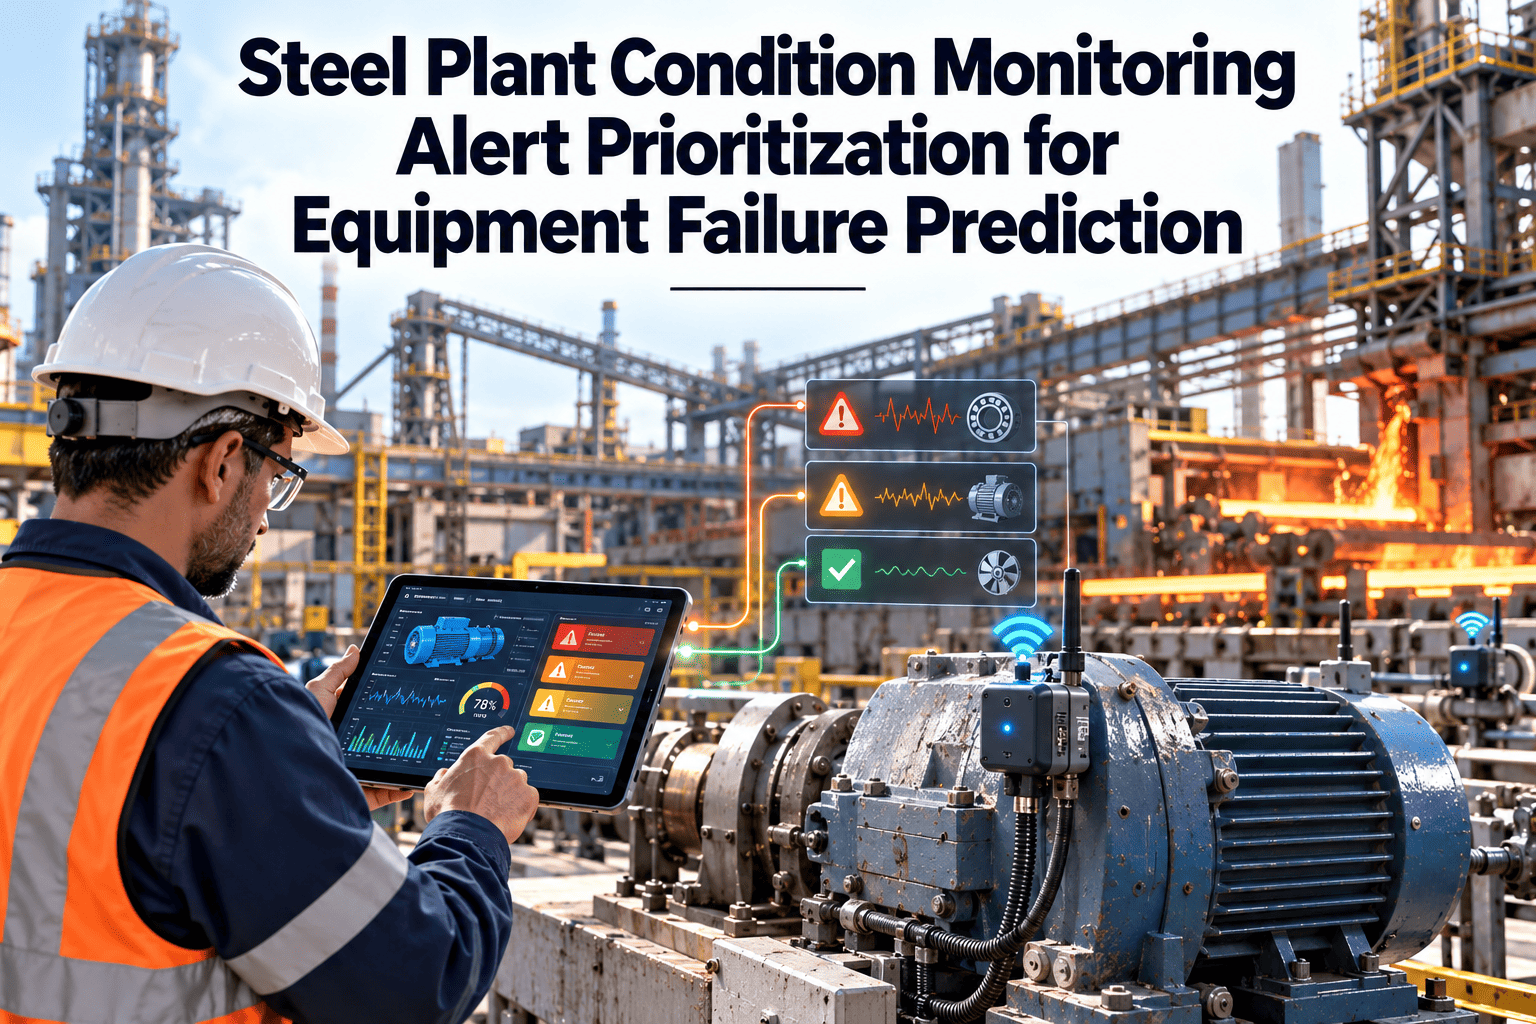
Alert fatigue ends more predictive programs than bad models do. A ranking method keeps attention on what matters.
Factors worth scoring on every alert
- Severity. How far the reading or trend has moved from baseline.
- Confidence. Whether another signal or an inspection supports the finding.
- Criticality. The effect on production, safety, quality and environment if the asset fails.
- Time to act. The next window, the repair duration and the parts lead time.
- History. Whether the asset has failed in this way before.
A maturity path that avoids big-bang projects
Most plants move through recognizable stages. Skipping stages usually means rebuilding the foundation later.
Data foundations that predictive models depend on
Models learn from what the plant recorded. Gaps in the record become gaps in the prediction.
Calendar-based versus predictive programs
Trends and technology shaping steel plant reliability
Several developments make predictive work more practical, although each depends on disciplined data and clear ownership.
- Wireless and low-cost sensors. Easier installation extends monitoring to assets that once relied on walk-around checks.
- Edge processing. Local analysis cuts data volume and allows faster alarms on fast-moving equipment.
- Anomaly detection. Models trained on normal behavior can flag unusual patterns even when few failures exist to learn from.
- Digital process records. Linking process, quality and maintenance data helps separate equipment faults from process effects.
- Standards guidance. Documents such as ISO 17359 on condition monitoring and ISO 14224 on reliability data give structure for programs and records.
Who owns each part of the strategy
Predictive programs stall when everyone assumes someone else owns the alerts. Name an owner for each decision before the first model goes live.
| Role | Responsibility in the program |
|---|---|
| Reliability engineer | Chooses assets and methods, reviews alerts, confirms diagnoses and tunes limits using failure history. |
| Maintenance planner | Turns verified findings into work orders, checks parts and fits repairs into available windows. |
| Area maintenance lead | Assigns crews, confirms feasibility and reports what was actually found on site. |
| Operations and process | Provides operating context, accepts planned load reductions and flags process changes that shift normal behavior. |
| Data or automation owner | Keeps sensor tags, historian links and data quality in good order. |
| Plant leadership | Sets priorities, funds the foundations and reviews program results on a regular cadence. |
A response playbook by alert level
A shared playbook keeps responses consistent between shifts and areas. The levels below are a starting point that each plant should adapt.
Connecting predictions to spares and shutdown scope
Prediction is most valuable when it changes decisions that are otherwise made on habit. Two of the biggest are spare parts and shutdown scope.
Reviewing the program on a fixed cadence
Models and rules drift as equipment, products and operating habits change. A simple review rhythm keeps the program honest.
- Weekly. Review open alerts, confirm findings and clear anything without an owner.
- Monthly. Check alert accuracy, missed failures, response times and the backlog of predicted repairs.
- Quarterly. Revisit asset segmentation, add or retire monitored assets and adjust limits using confirmed outcomes.
- Yearly. Compare results with reliability goals, review data quality and decide where to extend coverage next.
KPIs that show whether the strategy works
How Oxmaint supports a multi-asset predictive strategy
Oxmaint maintenance management software gives steel plants the operational layer around prediction.
Strategy mistakes to avoid
- Starting with the tool. Choose assets and goals first, then technology.
- Predicting everything. Low-consequence assets seldom justify model upkeep.
- Ignoring the work process. An alert with no planner, parts or window creates no value.
- Treating models as finished. They need feedback from real outcomes and periodic review.
- Skipping the operators. Operators often spot early signs that sensors do not capture.
Choosing a first pilot that proves the approach
A good pilot is small enough to finish and important enough that people care about the result.
Frequently asked questions
Build predictive reliability one asset class at a time
Bring asset history, inspections, alerts and work orders into one system, so every prediction ends in a planned repair.