Not every asset in a steel plant deserves the same maintenance attention. A failed gearbox on a continuous caster, a stuck converter tilting drive or a tripped stove valve on a blast furnace can stop output, endanger people and trigger quality claims, while a failed conveyor idler somewhere else is a nuisance. Asset criticality assessment ranks equipment by the consequence of failure, so limited labour, spares and monitoring budget go where they matter most. This checklist helps maintenance and reliability teams build that ranking and keep it current inside asset management software where scores stay linked to each asset record.
Asset Management · Steel Plant Reliability
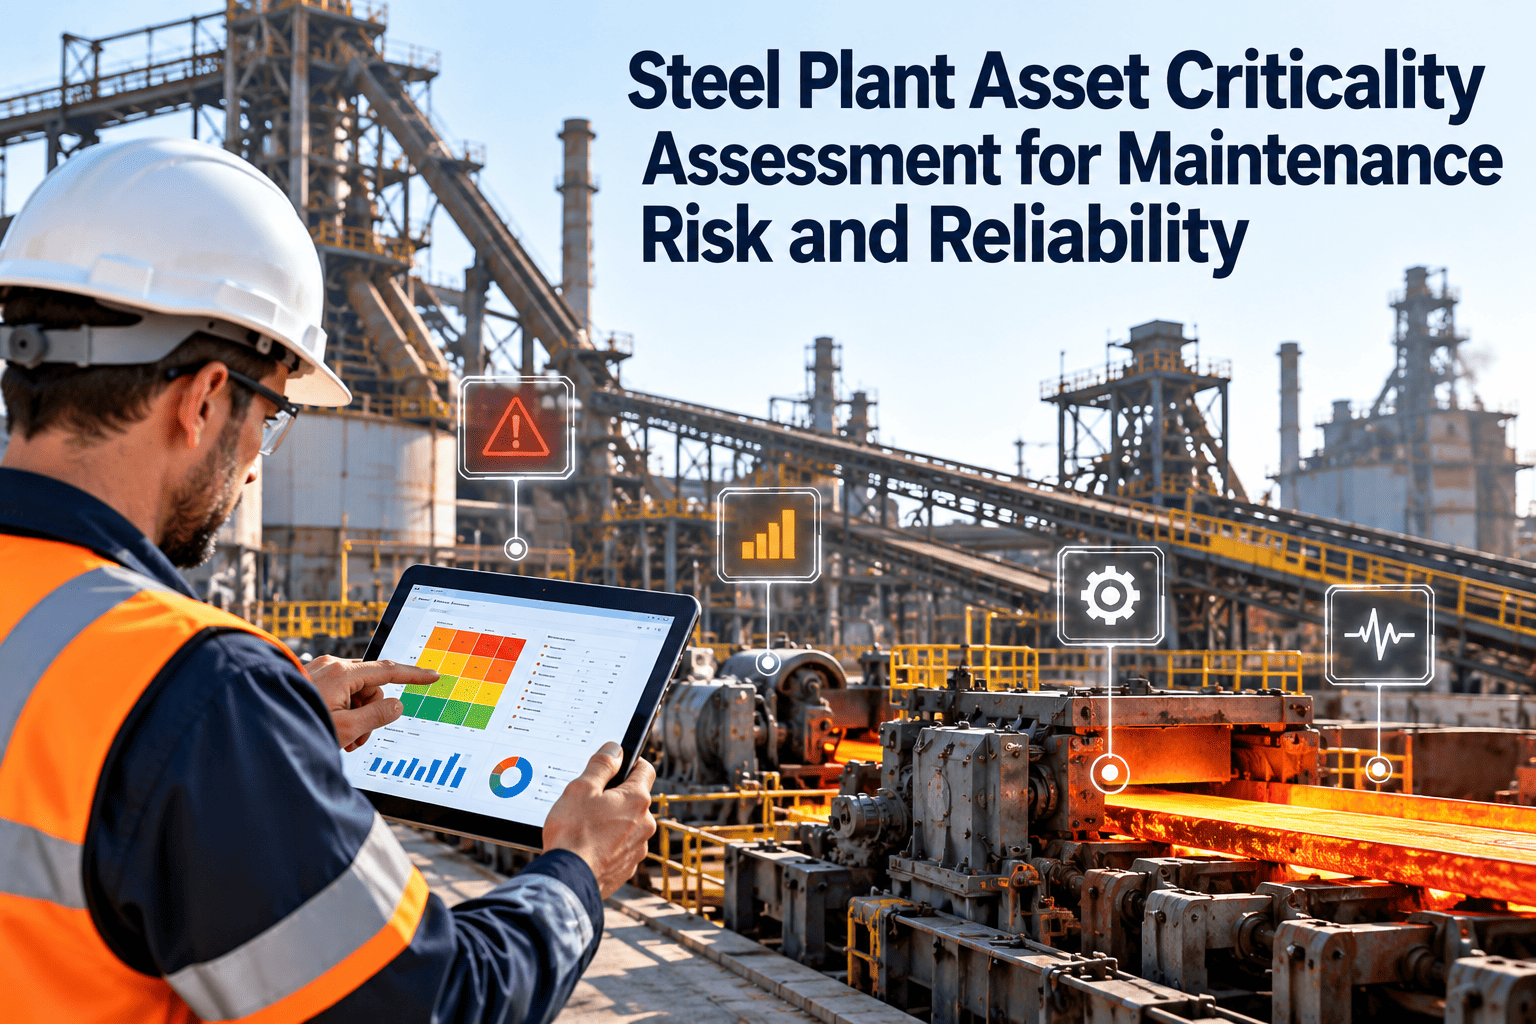
Steel Plant Asset Criticality Assessment for Maintenance Risk and Reliability
Rank equipment by safety, production, quality, environmental and repair-time consequence, then match maintenance effort to the risk each asset carries.
59 checkpoints across 12 checklists. Tick each item as it is verified, and record the owner and date.
Why Equal Maintenance Effort Fails in Steel Plants
Steel plants run thousands of assets across raw materials, ironmaking, steelmaking, casting, rolling and utilities. Treating them all the same wastes effort in two directions.
Over-maintained assets
Low-consequence equipment receives frequent preventive tasks that consume planner time and technician hours without reducing risk.
Under-protected assets
High-consequence equipment shares the same generic interval as everything else, and fails with no condition data and no spare on site.
Step 1: Prepare the Asset Register
Criticality scoring is only as sound as the asset hierarchy beneath it. Clean the register before anyone starts scoring.
Build a clear plant, area, system and equipment hierarchyScore at a level where failure has a defined consequence, usually the functional system or major equipment item rather than every bolt-on component.
Remove duplicates and retired equipmentDead records distort rankings and clutter work order selection lists.
Assign unique asset identifiers and locationsUse consistent tagging that matches drawings, so teams recognise the asset in the field and in the system.
Gather failure history and downtime recordsPull breakdown work orders, cause codes and duration data for the last few years to ground likelihood scores in evidence.
Identify redundancy and bypass optionsNote standby pumps, duplicate fans, parallel lines and manual workarounds, since they reduce consequence.
Step 2: Define the Scoring Criteria
Agree scoring definitions with operations, safety, quality and environmental teams, and write them down. Vague scales produce arguments instead of rankings. The scale below is an example to adapt.
SafetyScore 1 (low): No credible injury pathScore 3 (medium): Minor injury or contained hazardScore 5 (high): Serious injury, fire, gas or molten metal exposure
ProductionScore 1 (low): No effect on outputScore 3 (medium): Partial rate loss or buffered stopScore 5 (high): Full line stop with no bypass
QualityScore 1 (low): No product effectScore 3 (medium): Rework or downgradeScore 5 (high): Scrap, rejected heat or customer claim
EnvironmentScore 1 (low): No release or permit effectScore 3 (medium): Minor exceedance, quickly correctedScore 5 (high): Reportable emission or discharge
Repair time and sparesScore 1 (low): Same-shift repair, spare on siteScore 3 (medium): Days to repair, spare in regionScore 5 (high): Weeks to repair, long-lead or single supplier
Failure likelihoodScore 1 (low): Rare, no historyScore 3 (medium): Occasional, some historyScore 5 (high): Frequent, repeat failures
Agree weights for each criterionGive safety and environment the heaviest influence, and consider a rule where any top safety score automatically escalates the asset.
Set tier boundaries before scoringDecide score ranges for Tier 1 to Tier 4 first, so results are not nudged to protect favourite equipment.
Step 3: Place Assets on the Risk Matrix
Combine consequence with likelihood to see where each asset falls. Tier 1 assets sit where severe consequence meets credible failure.
Low impact
Moderate
Major
Severe
High likelihood
Tier 3Tier 2Tier 1Tier 1
Likely
Tier 3Tier 3Tier 2Tier 1
Possible
Tier 4Tier 3Tier 3Tier 2
Unlikely
Tier 4Tier 4Tier 3Tier 3
Step 4: Score Assets Area by Area
Run workshops by plant area, with an operator, a maintenance planner, a reliability engineer and a safety representative in the room. Typical consequence drivers differ by process stage.
Raw materials and sinterExample assets: Conveyors, crushers, sinter fans, stackersTypical consequence driver: Feed continuity and dust emissions
Blast furnace and stovesExample assets: Hot blast valves, blowers, cooling circuits, charging equipmentTypical consequence driver: Safety, gas handling and long restart
Steelmaking (BOF or EAF)Example assets: Tilting drives, oxygen lances, ladle cranes, off-gas systemsTypical consequence driver: Safety, heat loss and crane dependency
Continuous castingExample assets: Segment bearings, mould oscillation, drive units, spray coolingTypical consequence driver: Breakout risk, quality and sequence loss
Hot rollingExample assets: Main drive motors, gearboxes, roll chocks, descaling pumpsTypical consequence driver: Throughput, surface quality and long repair
Finishing linesExample assets: Cold mill drives, furnaces, coating pumps, tension rollsTypical consequence driver: Product quality and delivery commitments
Utilities and environmentExample assets: Oxygen plant, compressors, water pumps, dedusting fans, treatment plantsTypical consequence driver: Plant-wide dependency and permit compliance
Score the consequence of the functional failureAsk what happens if the asset stops or performs badly, with the existing protection and bypass in place.
Challenge outlier scoresReview any asset where operations and maintenance disagree by more than one level, and record the reasoning.
Capture failure modes for Tier 1 candidatesList how each critical asset can fail, since failure modes decide which tasks and monitoring methods fit.
Step 5: Match Maintenance Strategy to Tier
A tier is only useful when it changes what the team does. Link each tier to a default strategy and review exceptions.
Tier 1Failure mode analysis, condition monitoring, tight inspection routes, critical spares held on site, documented emergency repair plan.
Tier 2Preventive maintenance with periodic inspections, targeted condition checks, agreed spares or vendor support.
Tier 3Standard time-based or usage-based preventive tasks, minimal spares held, corrective repair when needed.
Tier 4Run to failure with a quick corrective response is acceptable, supported by basic inspection only.
Turn Criticality Scores Into Maintenance Action
A ranking in a spreadsheet changes nothing. Store tiers on each asset record, then drive PM schedules, inspections and spare levels from them in one maintenance system.
Asset hierarchyPM schedulesSpare partsReliability reports
Common Mistakes: Before and After
Most criticality programmes fail through process, not mathematics. These contrasts show what to avoid.
Weak practice
Better practice
One engineer scores alone from memory
Cross-functional workshop with operations present
Every asset in the plant scored in one pass
Start with one process area, refine, then expand
Scores filed once and never revisited
Reviews triggered by incidents, modifications and process changes
Tiers have no link to maintenance tasks
Each tier sets PM depth, monitoring and spares policy
Redundancy ignored, so everything looks critical
Standby and bypass capacity factored into consequence
Governance Checklist: Keeping Criticality Current
Plants change, and so does risk. Build review triggers into normal engineering and maintenance routines.
Re-score after major modificationsNew equipment, capacity changes and removed redundancy can lift or lower an asset's tier.
Review after serious failures and near missesCompare actual consequences with predicted scores and correct the scale where the team was wrong.
Check critical spares annuallyConfirm Tier 1 spares exist, are stored correctly and remain compatible with installed equipment.
Audit PM coverage by tierVerify every Tier 1 and Tier 2 asset has current tasks, inspections and an assigned owner.
Align with lifecycle decisionsUse tier and failure cost to guide refurbishment, replacement and capital planning.
Reliability Measures That Show the Ranking Works
Track results by tier. Improvement should appear first among the assets you decided matter most.
Unplanned downtime on Tier 1What it shows: Whether critical assets are protectedExpected direction: Falling over time
PM compliance by tierWhat it shows: Whether effort follows riskExpected direction: Highest on Tier 1 and Tier 2
Mean time between failuresWhat it shows: Reliability trend of ranked assetsExpected direction: Rising on critical equipment
Repeat failure countWhat it shows: Whether root causes are being fixedExpected direction: Falling
Critical spares availabilityWhat it shows: Readiness for Tier 1 repairExpected direction: Complete coverage
Emergency work shareWhat it shows: Balance of planned versus reactive workExpected direction: Falling
How Oxmaint Supports Criticality-Based Maintenance
Oxmaint helps teams keep criticality visible where maintenance decisions happen.
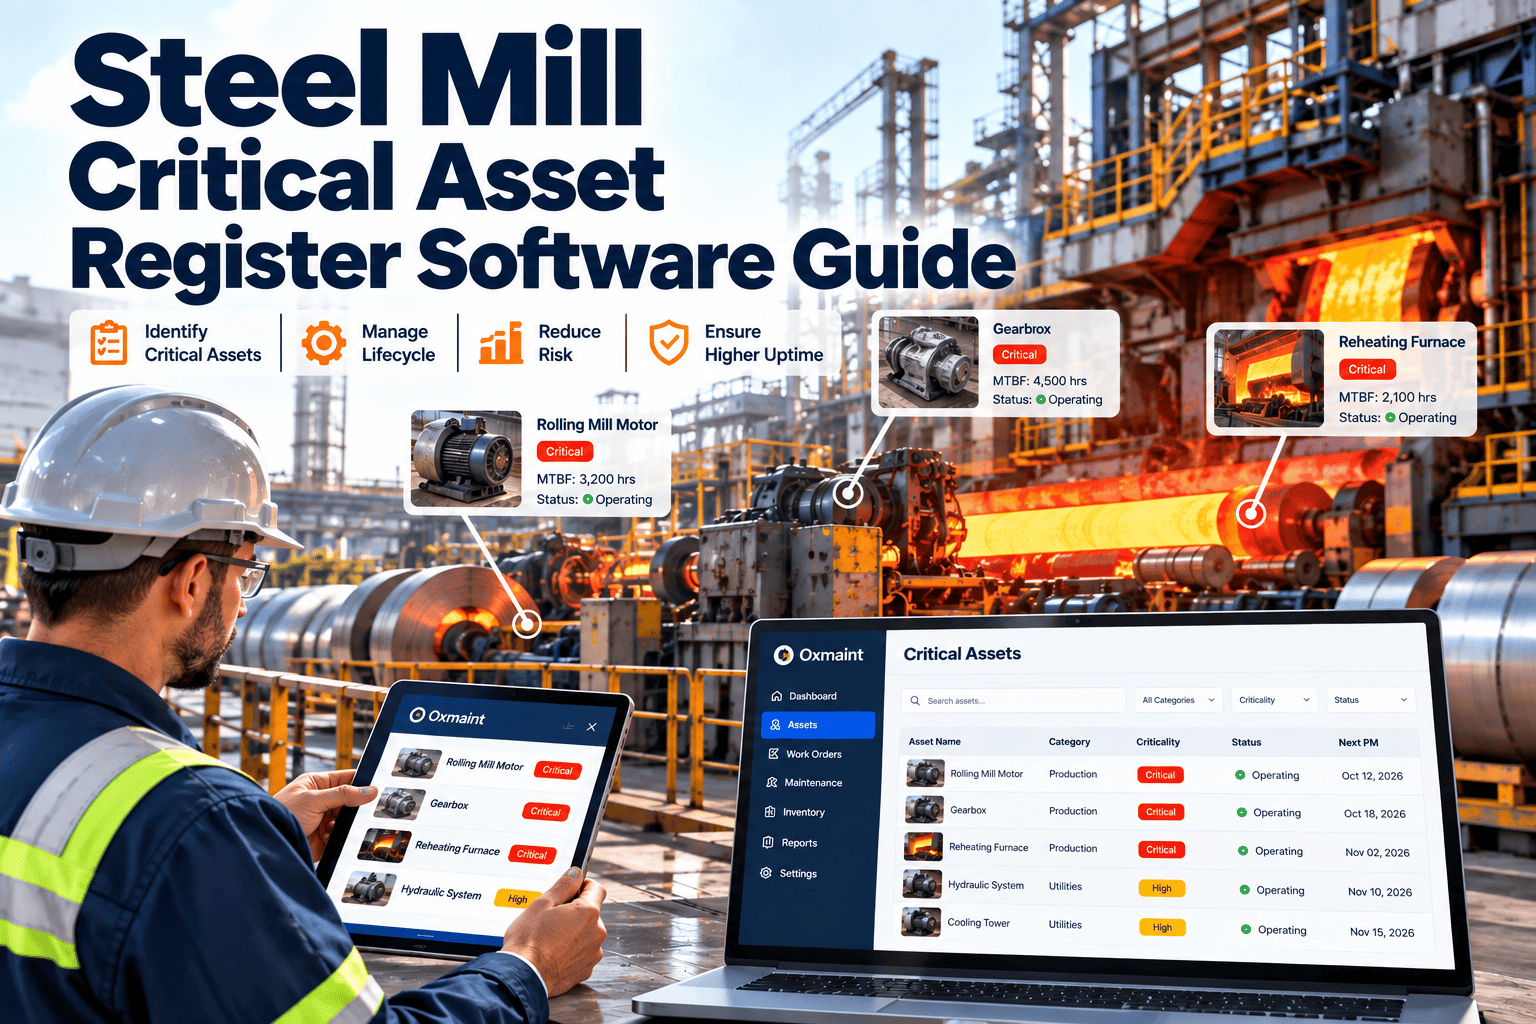
Asset recordsHold tier, hierarchy, documents and history on one record, so technicians see why an asset matters.
Preventive maintenanceSet task depth and frequency by tier, and adjust when failure data shows intervals are wrong.
Work orders and prioritiesPrioritise corrective work using asset criticality so urgent faults on key equipment are not buried.
InventoryLink critical spares to assets and monitor stock against minimum levels.
Condition-based workflowsRaise inspections or work orders from readings and findings on Tier 1 equipment.
DashboardsReport downtime, backlog and compliance by tier, area and asset.
Fields to Store on Every Ranked Asset
A tier without context is hard to defend later. Store the supporting detail on the asset record so reviews start from facts.
Criticality tier and score breakdownKeep the individual criterion scores, not only the final tier, so changes can be traced.
Date, participants and reasoningRecord who scored the asset, when, and the assumptions about redundancy and protection.
Known failure modes and consequencesList the main ways the asset fails and what each one does to safety, output and quality.
Linked spares, procedures and drawingsAttach the critical spares list, repair procedure and vendor contacts so emergency response is faster.
Next review date and ownerName the engineer responsible for keeping the score current.
Asset Criticality Assessment FAQs
What is asset criticality assessment in a steel plant?
It is a structured ranking of equipment by the consequence of failure on safety, production, quality, environment and repair effort.
How many criticality tiers should we use?
Three or four tiers work for most plants. Choose a number that changes real maintenance decisions.
How often should criticality be reviewed?
Review after modifications, major failures and process changes, plus a scheduled check at least yearly.
Does criticality replace failure mode analysis?
No. It tells you where to apply deeper analysis, such as FMEA or RCM, first, typically on Tier 1 equipment.
Worked Example: Scoring a Caster Segment Drive
The scores below are an illustration of the method, not data from a real plant. They show how reasoning is recorded so another engineer can follow it.
SafetyScore: 4Recorded reasoning: A stalled strand can lead to breakout risk near molten steel
ProductionScore: 5Recorded reasoning: Casting stops, and the ladle sequence is interrupted with no bypass
QualityScore: 4Recorded reasoning: Uneven strand withdrawal can cause internal and surface defects
EnvironmentScore: 2Recorded reasoning: No direct release, though an emergency stop creates cleanup work
Repair time and sparesScore: 4Recorded reasoning: Gear unit is long-lead and only one spare is held
LikelihoodScore: 3Recorded reasoning: Occasional bearing and seal issues in the history
Result in this example: Tier 1, with condition monitoring, a documented repair plan and a second spare gear unit reviewed.
Workshop Questions That Surface Real Consequence
Good scoring depends on good questions. Use these prompts to keep workshops evidence-based.
What happens in the first hour after this asset fails?Describe the immediate effect on people, process stability and downstream units.
Which protective devices exist, and are they tested?Interlocks and trips reduce consequence only if proof tests are current.
How long until the unit is back in service?Include diagnosis, parts delivery, access preparation, repair and restart, not only wrench time.
Can another asset take the load?Check standby capacity, buffer stock and manual workarounds, and whether they are truly usable.
Has this asset or a similar one failed before?Use work order history and incident reports rather than recollection.
Which regulations or permits depend on it?Dedusting, effluent treatment and gas handling equipment can carry compliance consequences.
Criticality and Spares Policy
Spare parts are where criticality pays back most visibly. Tie stocking decisions to tier, then review lead times.
Tier 1Spares approach: Hold critical spares on site, or in a pre-agreed rotable or vendor poolReview point: Annual check of condition, lead time and compatibility
Tier 2Spares approach: Stock fast-moving wear parts, with long-lead items sourced on demandReview point: Review after each major failure
Tier 3Spares approach: Minimal stock, with common parts shared across similar equipmentReview point: Review when consumption changes
Tier 4Spares approach: Buy when needed, avoid carrying inventoryReview point: Review only if the failure pattern changes
A 90-Day Rollout Path
Start small and prove value, instead of scoring the entire plant before anything changes.
Days 1 to 15: Choose one area and clean its registerPick a high-impact area such as casting or hot rolling, then fix hierarchy and identifiers.
Days 16 to 40: Hold scoring workshopsScore assets, document reasoning and resolve disagreements between operations and maintenance.
Days 41 to 65: Apply strategy to Tier 1 and Tier 2Update PM tasks, inspection routes, monitoring and spares for the highest-ranked assets.
Days 66 to 90: Measure and expandReview downtime and PM compliance by tier, correct the scale, then repeat in the next area.
Focus Steel Plant Maintenance Where Failure Costs Most
Rank your assets, set strategy by tier and measure the results. Start building a criticality-driven maintenance programme on a platform designed for asset records, work orders and reliability reporting.
Risk-based prioritiesCritical sparesTier-based PMReliability tracking