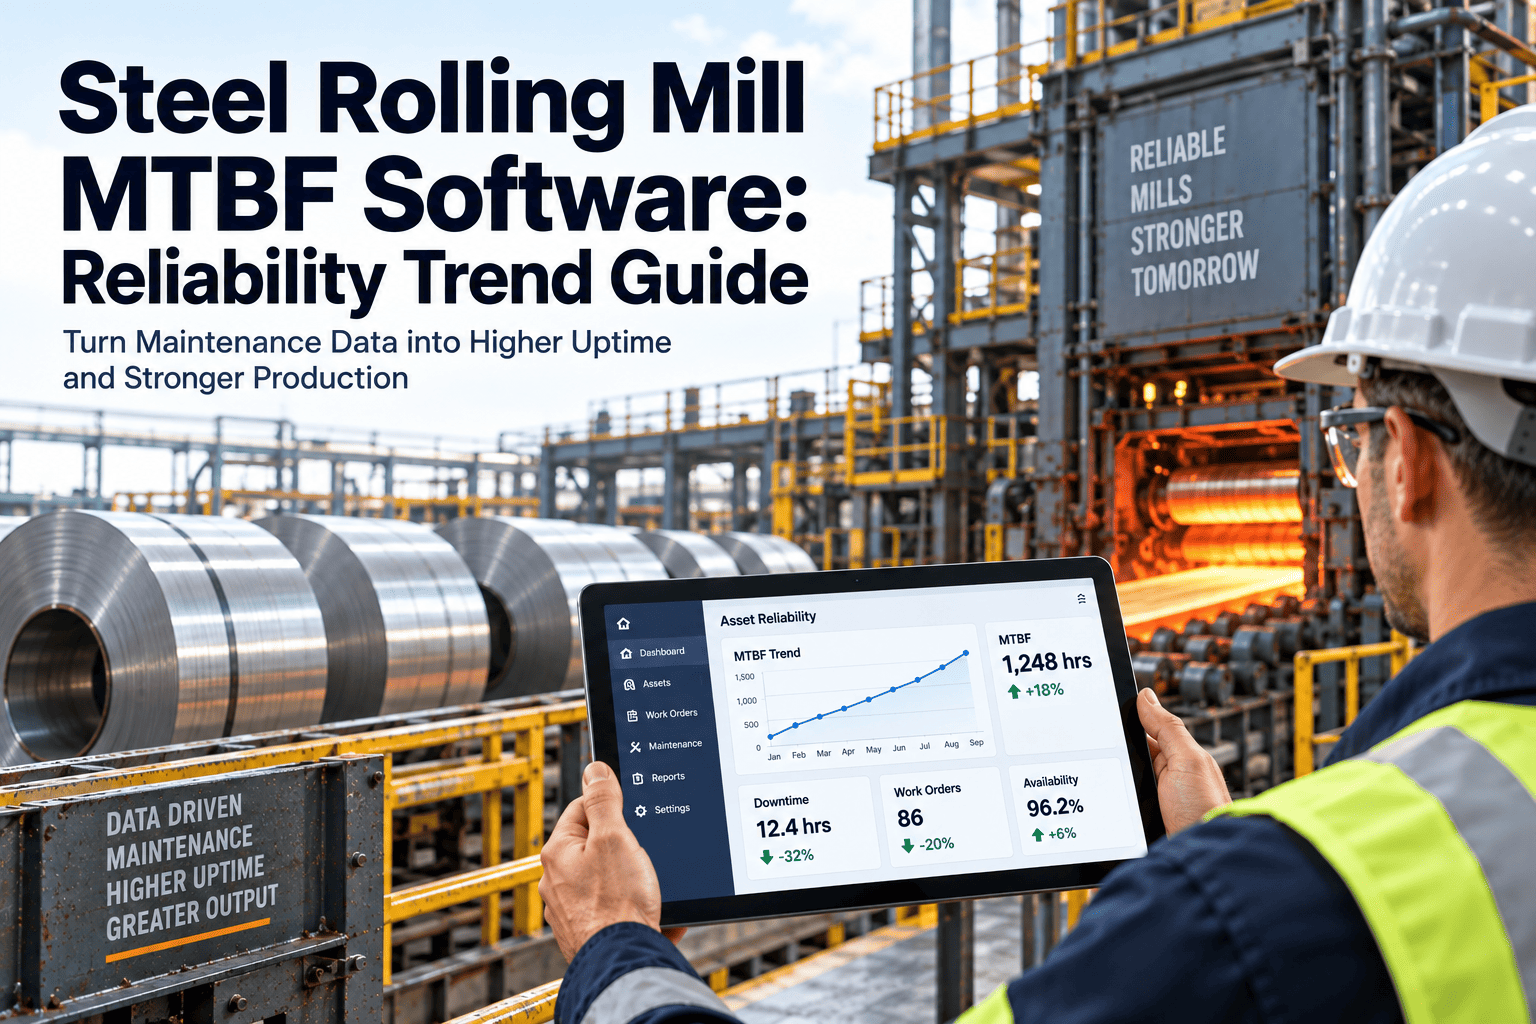
Mean time between failures is the single number that separates a rolling mill running to schedule from one bleeding tonnage to unplanned stands. Most mills still calculate it once a quarter in a spreadsheet, long after the bearing, gearbox, or drive motor that dragged the average down has already been replaced. By the time the report reaches a reliability manager, the trend line is history, not a warning. A rolling mill CMMS that timestamps every failure against the asset it happened to turns that lagging number into a living signal, and you can see how that shift plays out by comparing this month's Start Free Trial data against your existing spreadsheet.
MTBF by asset class, not by mill-wide average
A single mill-wide MTBF number hides which component family is actually failing. Break it down to bearing, gearbox, motor, and hydraulic level and the trend line finally tells reliability engineers where next month's stand stoppage is coming from.
A mill-wide MTBF average hides where the failures actually live
Rolling mills run dozens of stands, each with its own bearing housings, gear reducers, spindle couplings, and hydraulic actuators. Averaging failures across all of them into one MTBF figure erases the pattern reliability teams need to see.
Bearing failures cluster on specific stands
Roll-neck bearings on entry stands see higher radial load cycling than finishing stands, so their MTBF curve should be tracked and trended separately, not blended into a single mill figure.
Gearbox MTBF degrades slowly, then drops fast
Gear reducer failures often follow a long, quiet wear phase followed by a rapid decline once tooth pitting reaches a threshold. A blended average smooths that inflection point out of view entirely.
Motor and hydraulic failures have different seasonality
Drive motor insulation breakdown often tracks ambient heat and duty cycle, while hydraulic actuator failures track seal wear and fluid contamination — two different root causes that need two different trend lines.
MTBF benchmarks by rolling mill component family
Use asset-class MTBF as the working unit, not the whole mill. Each family below has a different failure signature, inspection interval, and typical time-to-repair once it does fail.
| Asset Class | Typical MTBF Range | Leading Indicator | Typical Repair Window |
|---|---|---|---|
| Roll-neck bearings | 4,000–7,500 operating hours | Vibration RMS, temperature rise | 6–14 hours |
| Stand gearboxes | 12,000–22,000 operating hours | Oil debris count, gear mesh frequency | 10–24 hours |
| Main drive motors | 18,000–30,000 operating hours | Insulation resistance, winding temperature | 8–20 hours |
| Hydraulic actuators | 6,000–11,000 operating hours | Seal leakage rate, response lag | 3–9 hours |
How a trended MTBF number actually gets built
Reliable asset-class MTBF is not a formula problem — it is a data-capture problem. Every failure event needs to be tagged consistently before any trend line means anything.
Tag every work order by asset class
Bearing, gearbox, motor, and hydraulic failures get a consistent asset-class code at the point of work order creation, not reconstructed later from free-text notes.
Capture true failure time, not report time
The CMMS timestamp needs to reflect when the asset actually stopped producing, not when the paperwork was closed out on the next shift.
Run rolling MTBF, not quarterly snapshots
A 90-day rolling window recalculated weekly catches degradation trends that a fixed quarterly report always publishes too late to act on.
Overlay condition data on the trend
Vibration, oil analysis, and thermography readings plotted against the MTBF curve show which leading indicator actually predicted the last failure.
Spreadsheet tracking versus a connected reliability trend
The difference between a manual MTBF spreadsheet and a CMMS-driven trend is not aesthetics — it is how early the warning arrives.
- MTBF recalculated once per quarter from manually pulled work order exports
- Failures grouped by mill, not by bearing, gearbox, motor, or hydraulic class
- Condition data lives in a separate vibration-analysis tool, never overlaid
- Trend direction is visible only after three or four quarters of history
- Rolling 90-day MTBF recalculated automatically every week per stand
- Each failure tagged to its asset class at work order creation
- Vibration, oil, and thermography feeds plotted against the same MTBF curve
- Downward inflection flagged within one or two failure cycles, not four quarters
See your stand-level MTBF trend, not a mill-wide average
Connect your existing work order history and get a first asset-class MTBF breakdown in days, not next quarter.
A finishing stand's bearing MTBF drops 18% over two months
A five-stand finishing train had been reporting a stable mill-wide MTBF of roughly 9,200 hours for three straight quarters. Split by asset class, the picture changed.
Once work orders were re-tagged by asset class, the entry-stand roll-neck bearing MTBF showed a steady decline from 6,800 hours to 5,600 hours across eight consecutive weeks, while gearbox and motor MTBF on the same stands held flat. That divergence would have been invisible in a blended quarterly number.
Is your rolling mill ready to trend MTBF by asset class?
Run through this before your next reliability review to see how much of the groundwork is already in place.
Turning rolling mill work order history into a live MTBF dashboard
Oxmaint's CMMS structures the data reliability teams need to move from a quarterly average to a per-asset-class trend that updates on its own.
Asset hierarchy by stand and component
Assets are structured down to bearing, gearbox, motor, and hydraulic level so every work order rolls up to the correct asset class automatically.
Preventive and corrective work orders in one system
Scheduling, mobile completion, and failure coding live in the same workflow, so MTBF calculations draw from complete, consistent history.
Dashboards and reporting built for reliability reviews
Rolling MTBF, failure counts, and inventory usage per asset class are available as standing dashboards, not a manual export exercise each month.
Steel rolling mill MTBF — common questions
What is a realistic MTBF target for rolling mill bearings?
Most integrated mills see roll-neck bearing MTBF in the 4,000–7,500 operating-hour range, though load profile and lubrication discipline shift that significantly between entry and finishing stands.
Why does mill-wide MTBF stay flat while one asset class is declining?
Averaging blends a declining bearing trend with stable gearbox and motor trends, so the combined number can look steady even as one component family heads toward failure.
How often should rolling mill MTBF be recalculated?
A rolling 90-day window recalculated weekly catches inflection points far earlier than a fixed quarterly report, without requiring a full statistical overhaul of the method.
Can existing CMMS work order history be reused for this?
Yes, provided each historical work order can be mapped to an asset class. Oxmaint can import existing history and reclassify it during setup — Start Free Trial to see your own data mapped.
Does asset-class MTBF replace vibration analysis?
No — it complements it. MTBF shows the outcome trend, while vibration, oil, and thermography data show why the trend is moving, which is why the two are plotted together.
Stop averaging your mill's reliability into a blind spot
Bring your rolling mill's work order history into a CMMS built to trend MTBF by asset class, stand by stand.
Free 14-day trial · No credit card