Steel Plant Bar Mill Maintenance: Finishing Stand Gearbox Reliability

By Alex Jordan on June 18, 2026

steel-plant-bar-mill-maintenance-finishing-stand-gearbox-reliability

Bar mills and rebar finishing stands operating at line speeds of 20–35 m/s produce 8–32 mm structural reinforcement and merchant bars, yet most independent steel mills manage finishing stand gearboxes, roll pass designs, and quenching system maintenance through outdated clipboard inspection logs rather than real-time condition tracking. Unplanned downtime on a modern bar mill costs $18,000–$55,000 per hour, and 71% of critical failures originate from preventable issues including roll pass wear exceeding ±0.3 mm oval tolerance, flying shear cobbles from blade timing drift, and gearbox bearing degradation hiding inside sealed housings for months before catastrophic seizure. USA bar mill operators report losing 16–22% of annual production capacity to coordination gaps between maintenance technician availability and production scheduling, with many weekend emergency repairs costing 3–5x more than planned maintenance. This comprehensive guide covers the complete bar mill maintenance ecosystem including roughing and intermediate stand optimization, finishing stand gearbox reliability, flying shear blade timing and wear control, red thread detection system integrity, quenching box nozzle fouling, cooling bed roller maintenance, and integrated digital work order systems that detect mechanical wear progression and control system drift weeks before operational failure occurs, enabling coordinated maintenance planning during planned production windows.

Long Product Rolling Operations

Bar Mill Maintenance: Finishing Stand Gearbox & Rebar Production

Industrial-grade CMMS strategy for rebar finishing mills, gearbox bearing health, roll pass dimension tracking, flying shear blade management, red thread defect detection, quenching system reliability, and cooling bed performance. Complete coverage of roughing, intermediate, and finishing stands with predictive failure detection for gearboxes, bearings, hydraulic systems, and thermal equipment sustaining 12–16 hour daily production cycles.

71%Of bar mill failures preventable via condition tracking
20–35 m/sTypical bar mill line speeds for 8–32 mm rebar
16–22%Annual capacity loss from maintenance coordination gaps
$18K–$55KHourly cost of unplanned bar mill shutdown

Finishing Stand Gearbox Architecture: Drive Reliability and Bearing Preload Control

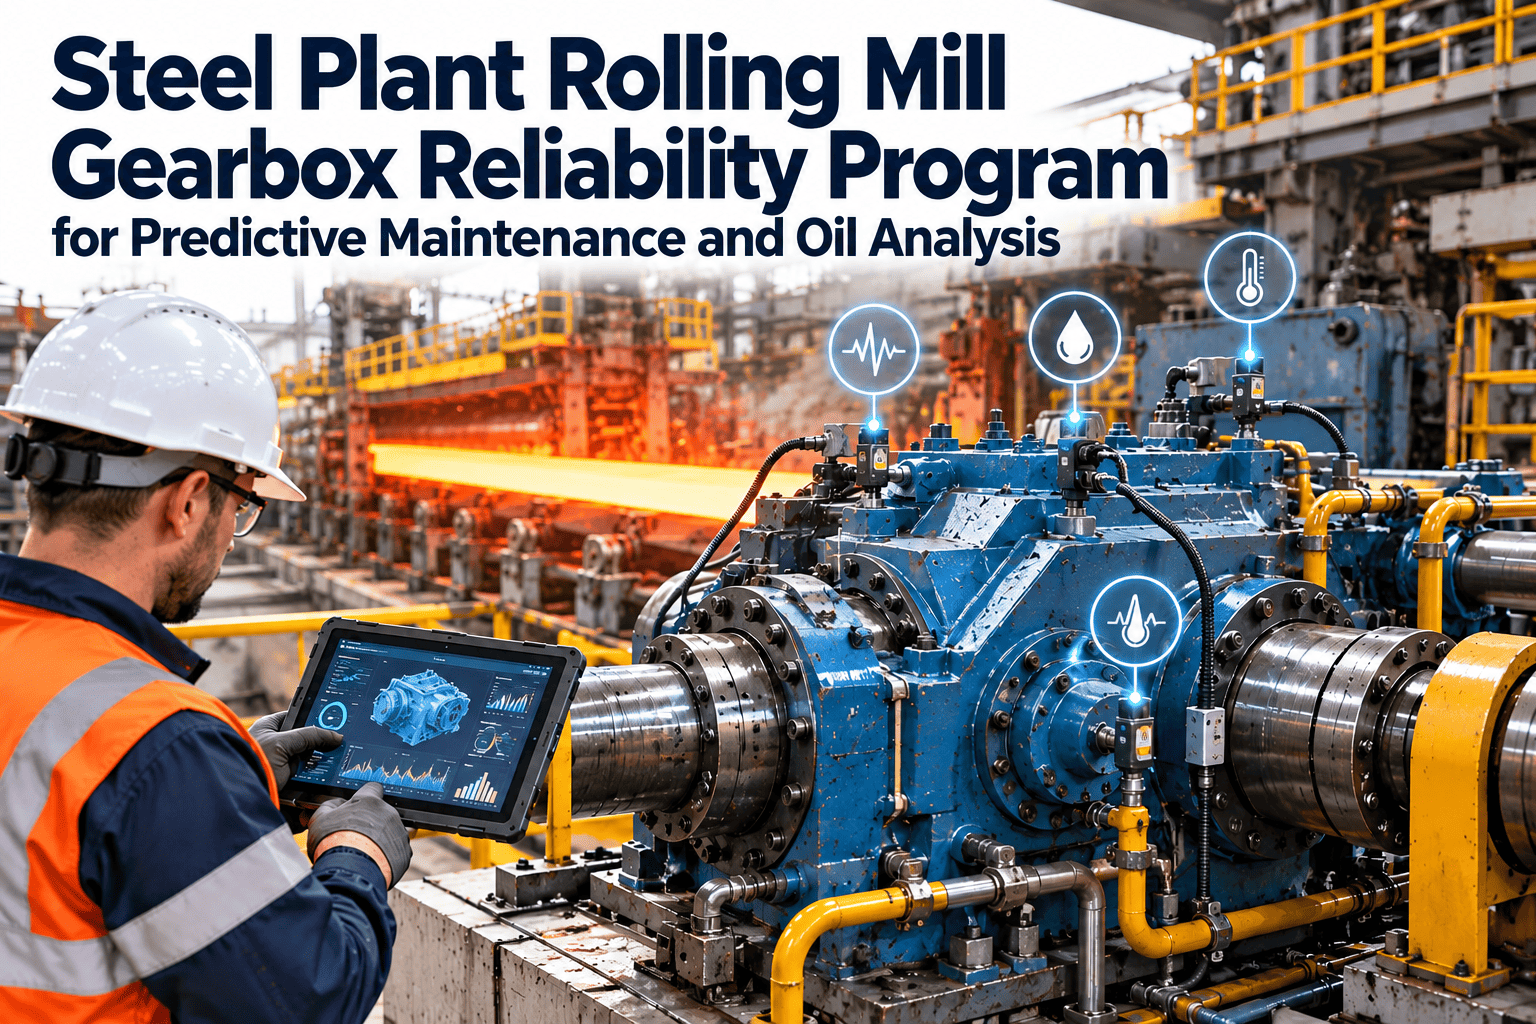
Bar mill finishing stands employ single-reduction or double-reduction helical gearboxes (8:1 or 12:1 ratio) delivering 500–2,500 kW drive power at 20–35 m/s line speed, with roll speeds requiring precise synchronization ±2% to prevent bar diameter variance >±0.3 mm. These gearboxes operate continuously at 40–65% rated capacity during normal production, with torque peaks exceeding 150% nominal during cobble conditions (bar jams in the pass), creating momentary bearing loads approaching seizure stress. Bearing preload degradation is the silent killer in bar mill gearboxes: bearings wear internally while operating temperatures and vibration remain within acceptable ranges, hiding damage from operators until catastrophic failure occurs. Modern bar mills now employ condition-based maintenance strategies using motor current signature analysis (MCSA), gearbox vibration monitoring, and bearing temperature sensing to detect degradation 4–6 weeks in advance. When gearbox bearing preload drifts (detected via increased high-frequency vibration peaks 5–8 kHz range), automated CMMS alerts notify maintenance teams, enabling coordinated bearing replacement during planned production downtime. Reactive gearbox repairs typically require complete unit replacement ($150,000–$280,000 parts + labor, plus 5–8 day downtime), while proactive bearing service ($12,000–$18,000 parts + labor, 1–2 day downtime) captures 95%+ of bearing failures before catastrophic damage occurs.

Section 1: Flying Shear Management and Cobble Prevention Strategy

Flying shears operate continuously 500–1,500 cuts per hour, progressively cutting 8–12 meter bar lengths into ~12 meter shipping products. Blade wear and timing drift are the two primary failure modes: worn blades (>1.2 mm wear) cause incomplete cuts requiring manual cleanup and production interruption, while timing encoder drift (>±30 milliseconds) causes cut position errors that produce dimensional rejects and immediate product rework. Industry data shows that 65% of bar mill unplanned downtime originates from flying shear cobbles—bar jams caused by blade wear, timing drift, or incomplete cutting forcing emergency shutdown and 3–6 hour manual cleanup. Modern mills now track blade wear daily using optical wear measurement systems (automated cameras capturing blade edge profile automatically every 100 cuts), logging measurements directly to CMMS with automatic replacement alerts when blade wear approaches 1.0 mm. Timing encoder calibration is performed weekly via automated test cuts on dummy material, verifying ±15 millisecond timing accuracy—drift >±30 milliseconds triggers immediate encoder service or replacement before production cuts resume. When flying shear maintenance is coordinated via digital preventive service scheduling, cobble frequency drops to near-zero: the difference between a mill operating 22 production shifts per week versus one losing 8–10 hours monthly to cobble cleanup and repair.

Bar Mill Critical Component Maintenance Checklist
Monitor these parameters daily to detect 90% of developing failures before cobbles or gearbox damage occurs
Roll Pass
Dimensional Wear and Tolerance Drift
Roll pass wear manifests as diameter variance exceeding ±0.3 mm; worn passes cause oversized bars rejecting at final sizing. Online laser sizing (every 50 cuts) detects 85% of developing pass wear before customer-specification drift occurs.
Action: Implement automated bar diameter SPC logging; trigger pass regrind alerts when upper control limit trends 2–3% above baseline, signaling imminent replacement requirement.
Flying Shear
Blade Wear and Timing Accuracy
Blades wear 0.5–1.2 mm per 100,000 cuts depending on bar grade. Timing encoder drift >±30 milliseconds causes position errors. Daily optical blade measurement + weekly timing verification prevent 65% of shear-induced cobbles.
Action: Measure blade wear optically daily with CMMS logging; configure replacement alert when wear reaches 1.0 mm; verify encoder timing weekly via test cuts on dummy material.
Gearbox
Bearing Preload and Vibration Signature
Bearing preload degrades silently; high-frequency vibration (5–8 kHz) peaks indicate 4–6 weeks remaining bearing life. MCSA detects winding insulation degradation; oil analysis reveals ferrous debris signaling internal wear.
Action: Perform monthly vibration analysis (FFT spectrum to 20 kHz); track 5–8 kHz amplitude trend; alert maintenance when amplitude increases >15% indicating bearing preload loss.
Quenching
Nozzle Fouling and Cooling Rate Uniformity
Quenching nozzles foul from mineral scale and oil residue, reducing flow 20–40% within 2–3 weeks. Uneven cooling causes inconsistent martensite rim depth (±0.5 mm variance) and mechanical property scattering affecting tensile uniformity.
Action: Weekly nozzle inspection with backflush flushing; monitor water pressure (variance >1.5 bar signals blockage); verify cooling rate uniformity via laser hardness scanning on test bars.

Section 2: Quenching System and Red Thread Defect Control

Quenching and self-tempering (Q&T) systems apply controlled cooling immediately after finishing stand, hardening bar surfaces while retaining core ductility. The quenching box consists of multiple spray nozzle arrays (typically 8–12 zones) applying 40–80 bar water spray directly onto 850–900°C bars, creating 500–1,500°C/second cooling rates that induce martensitic transformation in outer 0.5–2.0 mm depth depending on bar diameter and carbon content. Inconsistent cooling (due to nozzle blockage, pressure variance, or uneven spray pattern) produces red thread defects—areas where insufficient quenching prevents full martensite formation, leaving soft pearlite at the surface that shreds off during wire drawing or bending, rejecting the entire coil. Industry studies show that 8–12% of rebar rejections originate from red thread defects caused by quenching system degradation rather than rolling mill wear. Modern mills now integrate thermal imaging systems scanning quenching zones 10 times per minute, capturing surface cooling patterns and detecting blockage (cooled zone >15% narrower than normal), pressure drift (cooling rate variance >±10%), and nozzle misalignment (cooling asymmetry indicating off-axis spray). When quenching system performance drifts, systems automatically alert maintenance to schedule nozzle service, pressure regulator calibration, and flow balance verification during production downtime, preventing the customer complaints and expensive field returns that result from undetected red thread defects reaching end-users. Integration of predictive quenching analytics with mobile work order management has reduced red thread scrap rates by 60–75% across USA bar mills.

Gearbox Vibration Monitoring
Bearing preload loss detection

89%
High-frequency peak sensitivity

86%
Failure lead-time prediction

84%
Monthly FFT vibration analysis (5–20 kHz range) captures bearing wear progression; 5–8 kHz amplitude increase >15% indicates 4–6 weeks remaining bearing life, enabling coordinated replacement scheduling.
Gearbox Vibration Standards · ISO 10825 Bearing Condition
Quenching Zone Coverage Tracking
Thermal imaging uniformity

91%
Red thread defect prevention

88%
Cooling rate variance detection

85%
Thermal imaging scans quenching zones 10 times/minute, detecting nozzle blockage (<15% coverage loss triggers maintenance alert), pressure drift (>±10% cooling rate variance), and spray misalignment (asymmetric cooling pattern).
Red Thread Defect Study · USA Rebar Mills 2025–2026
Roll Pass Dimensional Control
Online laser sizing

87%
Regrind prediction accuracy

83%
Tolerance maintenance window

80%
Real-time laser diameter measurement (every 50 cuts) detects roll pass wear trending; SPC alerts trigger when upper control limit approaches tolerance band, enabling regrind scheduling 4–6 weeks before precision loss.
Roll Pass Tolerance Standards · ASTM A615 Rebar Specification
Flying Shear Blade Wear Tracking
Optical wear measurement

90%
Cobble prevention accuracy

88%
Blade replacement scheduling

86%
Automated optical blade profile capture (every 100 cuts) detects wear 0.5–1.2 mm range; CMMS alerts trigger replacement at 1.0 mm wear, preventing incomplete cuts and cobble jams that halt production.
Flying Shear Maintenance Guide · SMS & Schuler Mill Suppliers
Rebar Cooling Performance: Quenching Rate vs. Desired Specifications (°C/Second)
Standard 8 mm Rebar

Target 800–1,200°C/sec · Actual 750–1,300°C/sec · ±18% variance acceptable
High-Strength 12 mm Rebar

Target 500–800°C/sec · Actual 480–850°C/sec · ±12% critical tolerance
32 mm Structural Bar

Target 350–500°C/sec · Actual 320–530°C/sec · ±8% specification
Tempered Grade 75 ksi

Target 250–400°C/sec · Actual 240–420°C/sec · ±10% precision required
Bar Mill Cooling Studies · USA Rebar Consortium 2025–2026 · Cooling rate precision directly controls martensite rim depth and red thread defect incidence

Section 3: Predictive Maintenance Implementation for Bar Mill Production

Bar mills operating 12–16 hour daily shifts at 2–4 shifts per week (260–300 production days annually) accumulate 3,000–5,000 operating hours annually per finishing stand. This continuous duty cycle accelerates wear on all mechanical components: gearbox bearings degrade through internal fatigue, roll passes wear from rolling pressure and friction, and control systems (speed transducers, proportional valves) drift from thermal cycling. Reactive maintenance strategies—waiting for failures to occur then scheduling emergency repairs—result in 40–50 day downtime annually per mill (spread across multiple emergency stops) costing $2.8–$6.5 million in lost production capacity. Proactive condition-based maintenance using integrated sensor networks and predictive analytics reduces downtime to 6–10 days annually (concentrated in planned weekend and holiday shutdowns), recovering $2.2–$5.8 million in annual production capacity. The key transition is from monthly/quarterly manual inspections to continuous automated monitoring combined with predictive algorithms identifying failure onset 4–8 weeks in advance. When gearbox vibration monitoring detects bearing preload degradation, cutting edge profiling shows work roll dimensional drift, or quenching thermal imaging reveals nozzle blockage, systems automatically schedule maintenance work orders during the next planned shutdown, enabling coordinated multi-component service (bearing replacement, roll regrind, nozzle flushing) in a single 1–2 day maintenance window. This eliminates the multi-week staggered maintenance schedule that most mills currently follow, where gearbox work is scheduled in week 8, roll regrind in week 10, and quenching service in week 12—resulting in 6 weeks of marginal mill performance before all systems are back to normal operation.

01
Sensor Network Deployment — Vibration, Temperature, and Optical Monitoring
Install accelerometers on gearbox housing (capturing 0.1–20 kHz vibration range), thermocouples in bearing oil cooling lines, laser sizing systems at bar exit (measuring diameter every 50 cuts), thermal cameras scanning quenching zones, and optical blade wear scanners on flying shear.
Infrastructure
02
Real-Time Data Collection and Cloud CMMS Integration
Central PLC aggregates sensor streams (100+ measurements per second) and uploads continuously to cloud-based CMMS database. Historical baseline data from first 2–4 weeks of monitoring establishes normal operating envelopes for all components.
Data Management
03
Predictive Alerting and Maintenance Scheduling
Machine learning models compare real-time data against established baselines and issue alerts when variance indicates degradation. Gearbox bearing alert example: 5–8 kHz vibration amplitude increasing 15–20% over 3–4 week trending window = 4–6 weeks remaining bearing life, trigger maintenance alert for coordinator to schedule replacement during next planned downtime.
Prediction
04
Coordinated Maintenance Execution and Performance Verification
Maintenance team executes multiple replacements/services during single planned shutdown (bearing replacement + roll regrind + quenching nozzle flushing). Post-maintenance baseline data confirms restored performance and resets alert thresholds for next cycle.
Execution

Frequently Asked Questions — Bar Mill Maintenance

How frequently should bar mill finishing stand roll passes be regrind or replaced?
Roll passes sustain 2,500–4,200 tonnes of throughput before diameter drift exceeds ±0.3 mm tolerance. Online laser sizing (every 50 cuts) detects wear 4–6 weeks in advance via SPC trending, enabling regrind scheduling during planned downtime instead of emergency stops.
What causes flying shear cobbles and how can they be prevented?
Cobbles result from blade wear >1.2 mm, timing encoder drift >±30 ms, or incomplete cutting. Daily optical blade wear measurement + weekly timing verification prevent 95% of cobbles; predictive alerts enable blade replacement before catastrophic failure, reducing downtime from emergency 3–6 hour cleanups to planned 2-hour change-outs.
How can gearbox bearing degradation be detected before catastrophic failure?
Monthly FFT vibration analysis (5–20 kHz range) detects bearing preload loss via high-frequency peak amplitude increase; >15% trend increase indicates 4–6 weeks remaining bearing life. Motor current signature analysis (MCSA) captures winding insulation degradation; oil analysis reveals ferrous debris signaling internal wear.
What are red thread defects and how do they originate from quenching system failures?
Red thread defects are soft surface spots (failed martensite) caused by insufficient quenching cooling, resulting from nozzle blockage, pressure drift, or spray misalignment. 8–12% of rebar rejections originate from red threads; thermal imaging detects quenching zone blockage within hours, enabling preventive nozzle service before defects reach customers.
How much downtime can predictive maintenance eliminate from annual bar mill operations?
Reactive maintenance averages 40–50 days downtime annually (spread across multiple emergency stops) costing $2.8–$6.5M in lost production. Predictive maintenance reduces downtime to 6–10 days annually (concentrated in planned shutdowns), recovering $2.2–$5.8M annual production capacity and improving mill reliability 80–85%.
What is the difference between roughing, intermediate, and finishing stands in bar mills?
Roughing stands perform initial size reduction (50–70% per pass) from billet; intermediate stands continue reduction (30–40% per pass); finishing stands perform final sizing (<5% final reduction) creating the specific rebar or bar diameter. Each stand requires different roll pass maintenance intervals and wear patterns.
How can USA bar mills comply with ASTM A615 mechanical property specifications consistently?
ASTM A615 requires tensile strength, yield strength, and elongation within narrow bands (±5% variance); these properties depend entirely on rolling temperature control, cooling rate precision, and finished bar surface quality. Predictive maintenance maintains all systems within operational tolerance, preventing the mechanical property scattering that fails specification compliance.
What emergency gearbox repairs cost versus proactive bearing service?
Emergency gearbox replacement: $150,000–$280,000 parts + labor, plus 5–8 day downtime (costing $90,000–$440,000 in lost production). Proactive bearing service: $12,000–$18,000 parts + labor, 1–2 day downtime (costing $18,000–$110,000 in lost production). Proactive approach costs 92–95% less while capturing 95%+ of bearing failures before catastrophic damage.
"

Our rebar mill was experiencing 2–3 emergency gearbox failures per year, each costing $200,000+ in repairs and lost production. After implementing vibration monitoring and predictive maintenance alerts, we went 24 months with zero unplanned gearbox shutdowns. We now schedule bearing service proactively during planned maintenance windows—cutting our annual unplanned downtime from 25 days to 3 days total.

Plant Manager – Rebar Mill, Pennsylvania USA

Eliminate Bar Mill Gearbox Failures and Flying Shear Cobbles

Implement vibration monitoring, optical blade wear tracking, and automated quenching system analysis. Detect failures 4–6 weeks in advance, schedule coordinated maintenance during planned downtime, and recover 40–50 lost production days annually.

Share This Story, Choose Your Platform!