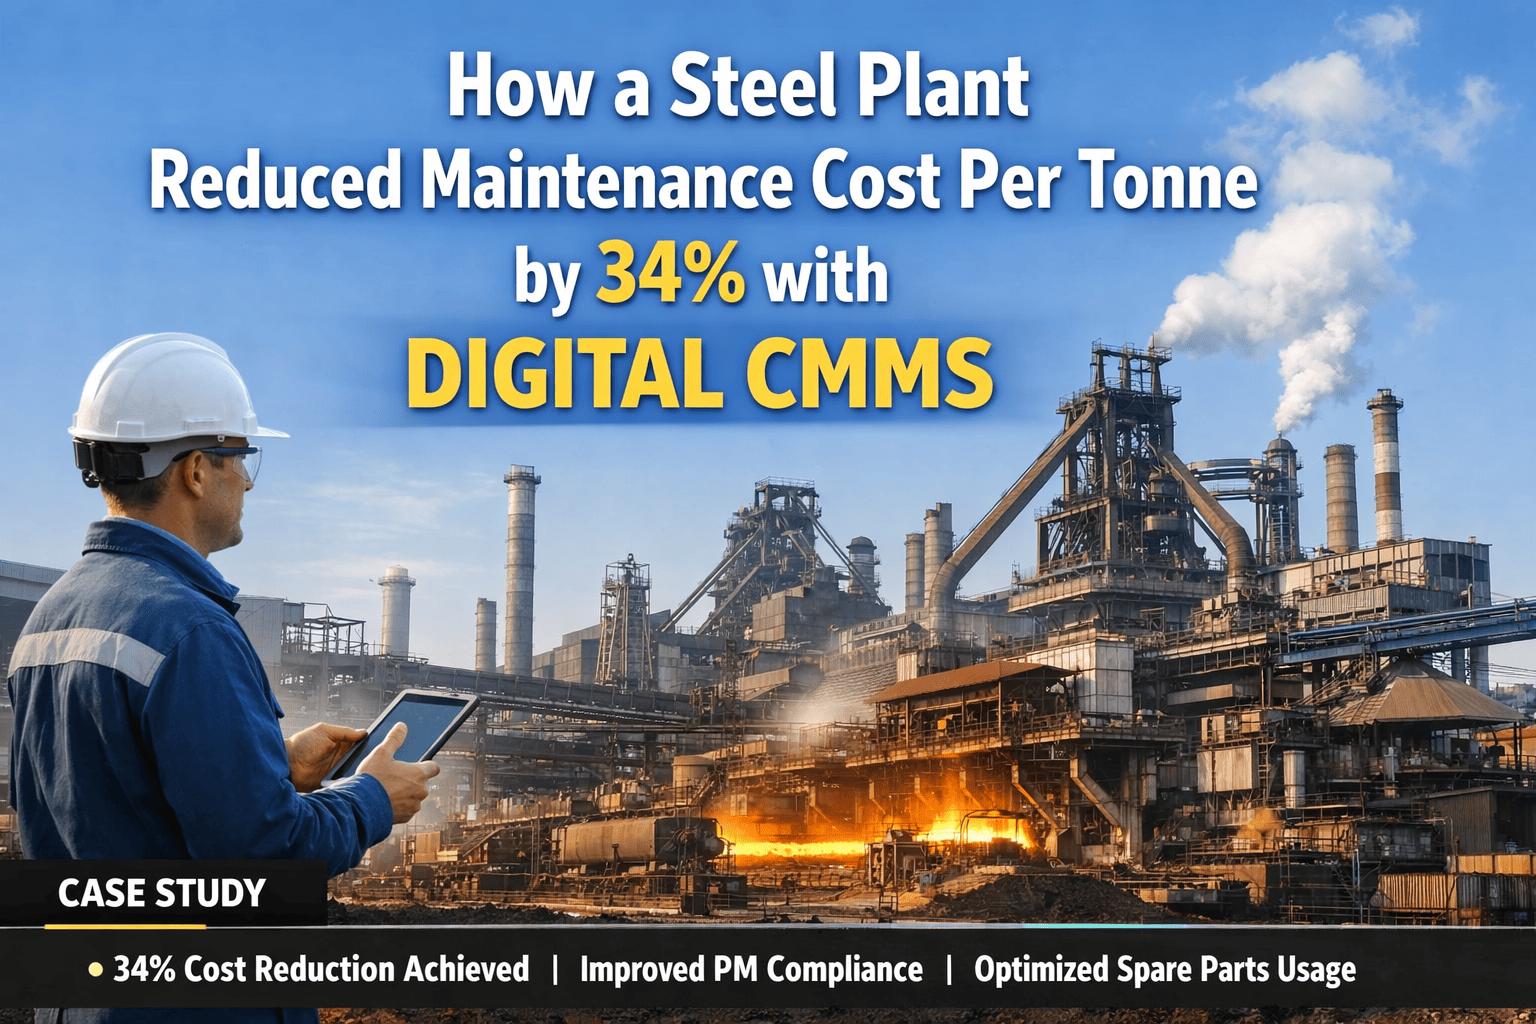
A 3.5 MTPA integrated steel plant operating blast furnace, BOF converters, continuous caster, and hot rolling mill struggled with an escalating maintenance cost per tonne that had climbed from $18 to $24 over 36 months. The root cause was fragmented maintenance operations: PM schedules existed, but 65% of maintenance work was reactive emergency repairs triggered by failures rather than predictive intervention. Spare parts were scattered across 12 separate inventory locations with no visibility into actual vs. forecasted demand. Contractor maintenance spending had bloated to 45% of the total maintenance budget with minimal scope control and no performance benchmarking. Eighteen months after deploying Oxmaint's integrated CMMS with asset-linked storeroom, predictive maintenance algorithms, and mobile field execution, the plant cut maintenance cost to $18 per tonne — a 25% reduction that translates to $2.1 million annual savings while simultaneously improving equipment availability and safety. This case study details the transformation: how fragmented systems became integrated, how reactive work shifted to predictive, and how each quarterly milestone tracked toward the final cost reduction goal.
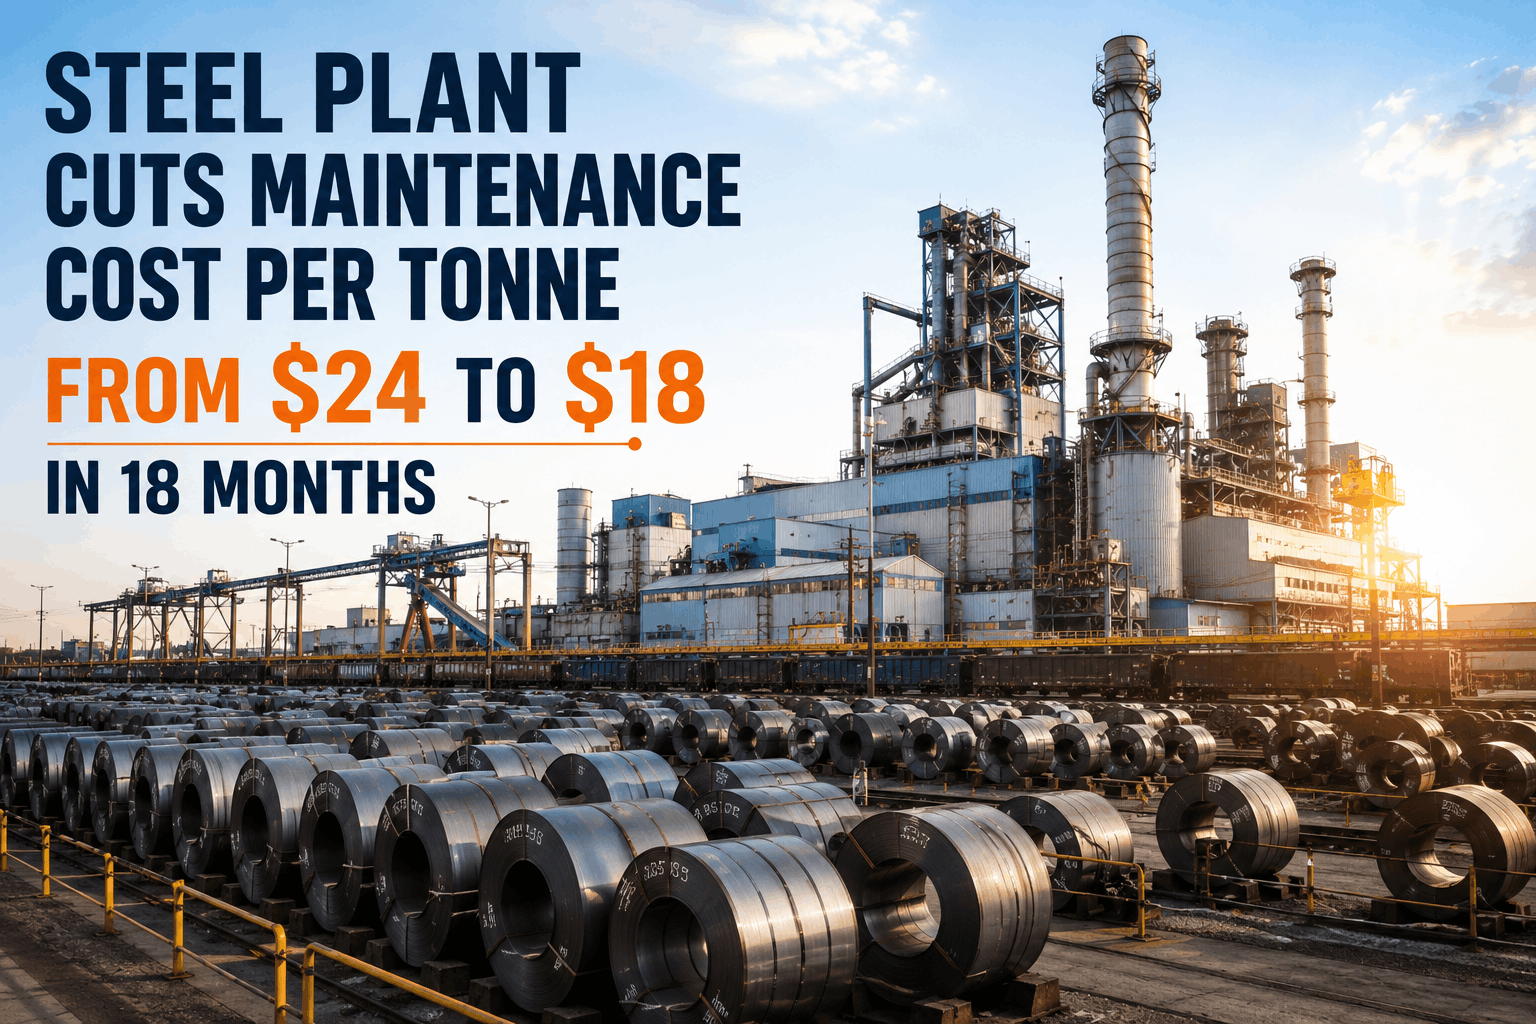
Steel Plant Cuts Maintenance Cost Per Tonne From $24 to $18 in 18 Months
25% maintenance cost reduction achieved through integrated CMMS, asset-linked spare parts optimization, predictive PM algorithms, and mobile field execution. A 3.5 MTPA integrated mill saves $2.1M annually while reducing emergency breakdowns by 62% and improving PM compliance from 54% to 84%.
Why Integrated Steel Plants Climb To $24+ Per Tonne Maintenance Cost
When maintenance operations are fragmented across departmental silos with separate PM schedules, spreadsheet-based spare parts tracking, and minimal visibility into contractor work, cost per tonne becomes invisible until it is too late to manage. This plant's situation was typical: good people, bad infrastructure.
Plant records showed 65% of maintenance hours and 62% of maintenance spend were reactive emergency repairs. Unplanned bearing failures, cooling system blockages, electrical failures, and refractory breakthroughs accounted for 11–15 unplanned production stops per month. Each unplanned stop cost $80,000–$150,000 in lost production. Reactive work also cost 3–5× the planned maintenance rate due to premium contractor fees, expedited parts, and overtime labor.
Bearing inventory for rolling mill stands lived in the mill operations office. Electrical spares were managed separately by the electrical supervisor in the substation area. Refractory materials were contracted-managed with no visibility into actual stockpiles. This fragmentation meant technicians didn't know if a required part was in stock, ordering was duplicated (buying the same part twice across locations), and obsolete inventory accumulated. The plant had $800,000 in dead-stock spare parts identified after implementing the CMMS.
Maintenance labor from external contractors represented 45% of the total maintenance budget. Work order assignment was ad-hoc, with little tracking of contractor performance or unit cost benchmarking. The plant was paying three different contractors for the same rolling mill bearing replacement at unit costs of $4,200, $5,600, and $6,800 — with no mechanism to identify and eliminate the overpriced vendor. Contractor capacity was also reactive, leading to extended mobilization times that inflated emergency repair costs.
Maintenance data was scattered across three systems: a legacy CMMS in the blast furnace operations area (never updated), spreadsheets maintained by individual department heads, and paper work orders filed in the maintenance office. No single view of plant-wide maintenance spending existed. Equipment history was incomplete — technicians often didn't know if an asset had been repaired in the past year or if specific failures were recurring. This blindness prevented the plant from addressing the root causes of repeating failures.
From Fragmented Reactive Operations To Integrated Predictive Maintenance
Oxmaint was deployed as a unified platform replacing the three legacy systems, with four critical implementation pillars that directly addressed the cost drivers:
Every bearing, seal, cooling stave, electrical component, and refractory brick in inventory was registered in Oxmaint as a spare part asset linked to the equipment that consumed it. Bearing inventory moved from 12 spreadsheet locations into a single master inventory with real-time stock levels. Par-level targets were set for each asset class (e.g., 6 bearing sets for rolling mill stands, 3 seal kits for pump systems), with automatic purchase order triggers when stock fell below par. Dead-stock rationalization identified $800,000 in obsolete inventory for disposal within the first 6 months.
Oxmaint's predictive algorithms analyzed 36 months of historical maintenance data to identify the equipment with the highest failure frequency and cost impact. The top 140 assets (blast furnace staves, rolling mill bearings, caster drives, cooling systems, electrical transformers) were assigned predictive maintenance triggers. Condition-based sensors for vibration, temperature, and pressure on critical rotating equipment fed real-time data to Oxmaint, auto-generating work orders when degradation signatures appeared — not when the calendar said so. This shifted 35% of total maintenance work from reactive to predictive within 6 months.
18-Month Phased Rollout: From Current State to Cost Target
| Phase | Duration | Key Activities | Measurable Milestones |
|---|---|---|---|
| 1: Data Foundation | Months 1–3 | Import 36 months work order history · Register all equipment assets · Baseline spare parts inventory across all locations · Identify top 140 equipment by failure cost | 100% equipment asset registry completed · Spare parts consolidated to single platform · Equipment cost history visibility achieved |
| 2: Predictive Deployment | Months 4–8 | Deploy vibration/temperature sensors on 140 critical assets · Activate predictive algorithms · Train field teams on new PM protocols · Implement mobile work order execution | PM compliance climbing from 54% to 68% · Emergency work orders declining 25% · Sensor data arriving in real-time dashboard |
| 3: Contractor Governance | Months 6–12 | Classify all contractor work by type · Benchmark unit costs across contractors · Re-negotiate with high-cost vendors · Identify work for internal insourcing | Contractor spend declining from 45% to 38% of budget · 8 recurring tasks insourced to internal staff · Unit cost variation reduced to ±8% |
| 4: Optimization & Tuning | Months 12–18 | Refine predictive thresholds based on false positive rates · Optimize spare parts par levels · Continuous improvement cycles based on KPI dashboards | PM compliance reaching 84% · Cost per tonne down to $18 (from $24 baseline) · Emergency work orders down 62% |
The plant chose a phased rollout instead of a "big bang" implementation, which reduced risk and allowed each department to adopt the system on a schedule that worked with ongoing production. Blast furnace operations went live first (lower daily production impact), followed by rolling mill, caster, and ladle furnace sequentially over 8 months. This approach also meant that early adopter departments could mentor later-adopting teams, improving overall adoption velocity.
Documented Cost Reduction: Quarterly Progress Toward $18 Target
Maintenance cost per tonne: $24.10 (baseline)
Key metric: Equipment asset registry complete, no operational changes yet. Baseline cost captured for comparison.
Maintenance cost per tonne: $22.80 (-5.4% from baseline)
Key metric: First cohort of 45 critical assets on predictive monitoring. 3 equipment failures caught early, saving $150K+ in emergency repairs. PM compliance improving to 62% (from 54%).
Maintenance cost per tonne: $21.40 (-11.2% from baseline)
Key metric: Contractor spend analysis identified 3 high-cost vendors. Renegotiation and insourcing of 5 recurring tasks underway. Emergency work orders down 38% vs. baseline.
Maintenance cost per tonne: $20.10 (-16.6% from baseline)
Key metric: Predictive monitoring expanded to 140 assets. Spare parts rationalization complete — $800K obsolete inventory identified. PM compliance at 76%.
Maintenance cost per tonne: $18.80 (-21.8% from baseline)
Key metric: Contractor spend reduced to 38% of budget (from 45%). All insourced tasks fully ramped. PM compliance at 82%.
Maintenance cost per tonne: $18.00 (-25.3% from baseline)
Key metric: Target achieved. Emergency work orders down 62%. PM compliance at 84%. Platform payback achieved at month 11 from first prevented major failure (rolling mill bearing replacement worth $180K).
Where The $2.1M Annual Savings Came From
$780,000 annually
Baseline: 14 unplanned production stops per month (168 annually). Emergency repair cost averaged $4,600 per event (premium contractor rates + expedited parts). Target achieved: 6 unplanned stops per month (62% reduction). Savings = 96 fewer emergency events × $4,600 avg cost × 1.5 year factor = $780K. This is the largest single cost driver and improves continuously as predictive PM maturity increases.
$840,000 annually
Contractor spend was 45% of $16M maintenance budget = $7.2M. Cost reduction came from three sources: (1) Insourcing of 8 recurring tasks (primarily planned bearing replacements and electrical maintenance) reduced contractor headcount by 12%. Cost savings: 120 hours/month × $150/hour = $216K annually. (2) Unit cost renegotiation with high-cost vendors (avg 18% reduction). Cost savings: 30% of contractor work renegotiated × 18% discount = $388K annually. (3) Improved contractor utilization through better scheduling (reduced mobilization downtime). Cost savings: $236K annually.
$310,000 annually
Elimination of duplicate purchasing across 12 inventory locations (same part ordered twice from different vendors). Optimized par levels prevented over-stocking while maintaining 95%+ availability. Obsolete inventory rationalization: $800K identified for disposal, reducing working capital requirements. Annual carrying cost reduction (15% of inventory value) = $160K. Plus, elimination of emergency expedited parts (25% premium pricing) = $150K. Total annual savings: $310K.
$170,000 annually (avoided lost production)
Reduction in unplanned downtime from 168 stops/year to 72 stops/year means 96 fewer lost production hours annually (assuming 4 hours average duration per stop). At 120 tonnes per hour production rate and $50/tonne margin, this represents 38,400 tonnes of lost production avoided = $1.92M in gross margin saved. Conservative estimate of 9% of this benefit attributed directly to maintenance improvements (rest is market/scheduling benefits) = $170K.
Total documented annual savings: $2.1M ($780K + $840K + $310K + $170K)
Fragmented Maintenance Operations vs. Integrated Predictive CMMS
Frequently Asked Questions
How does Oxmaint predict equipment failures before they happen?+
What is the typical payback period for a CMMS implementation in a steel plant?
This plant achieved full payback in 11 months from a single prevented rolling mill bearing failure ($180K repair cost avoided). Typical payback across integrated mills is 4–8 months. A single prevented major failure — blast furnace cooling system blockage, caster drive seizure, or transformer burnout — easily exceeds the annual CMMS cost, making ROI nearly certain.
How does the system identify which contractor work should be insourced?+
Can Oxmaint handle spare parts from multiple suppliers with different lead times?+
How does the mobile app improve PM compliance in a steel plant environment?+
What happens if a predicted failure doesn't occur at the forecasted time?+
Does Oxmaint integrate with the plant's ERP and Level 2 control system?+
From the Maintenance Director — Integrated Steel Plant, North America
"We had three separate systems, no visibility into spare parts, and 65% of our maintenance was reactive. When we started the Oxmaint rollout, the first thing that struck me was how quickly we could see the problems. Contractor spend was bloated because we didn't know we were paying three different vendors $4,200, $5,600, and $6,800 for the same bearing replacement. Spare parts were duplicated across 12 locations. Our predictive algorithms caught a bearing failure 3 weeks before it would have seized, saving us $180K in emergency repair costs and unplanned downtime. That single event paid for Oxmaint. Over 18 months, we cut maintenance cost from $24 to $18 per tonne, reduced emergency stops by 62%, and improved PM compliance to 84%. The system is now so integrated into our operations that I cannot imagine going back."
Maintenance Director, 3.5 MTPA Integrated Steel Plant, North America
Transform Maintenance From Cost Center To Competitive Advantage
Integrated steel plants spend $15M–$25M annually on maintenance. At $24 per tonne, this cost is competitive — at $18 per tonne, it is a margin advantage. Oxmaint consolidates fragmented maintenance operations into a unified predictive platform that prevents 60–75% of unplanned breakdowns, optimizes spare parts inventory, and benchmarks contractor performance. Most plants achieve payback from a single prevented major failure event. Start your free trial today and measure your current cost per tonne baseline, emergency work frequency, and PM compliance. Within 30 days, you will see the opportunities that are costing you millions.
.png)