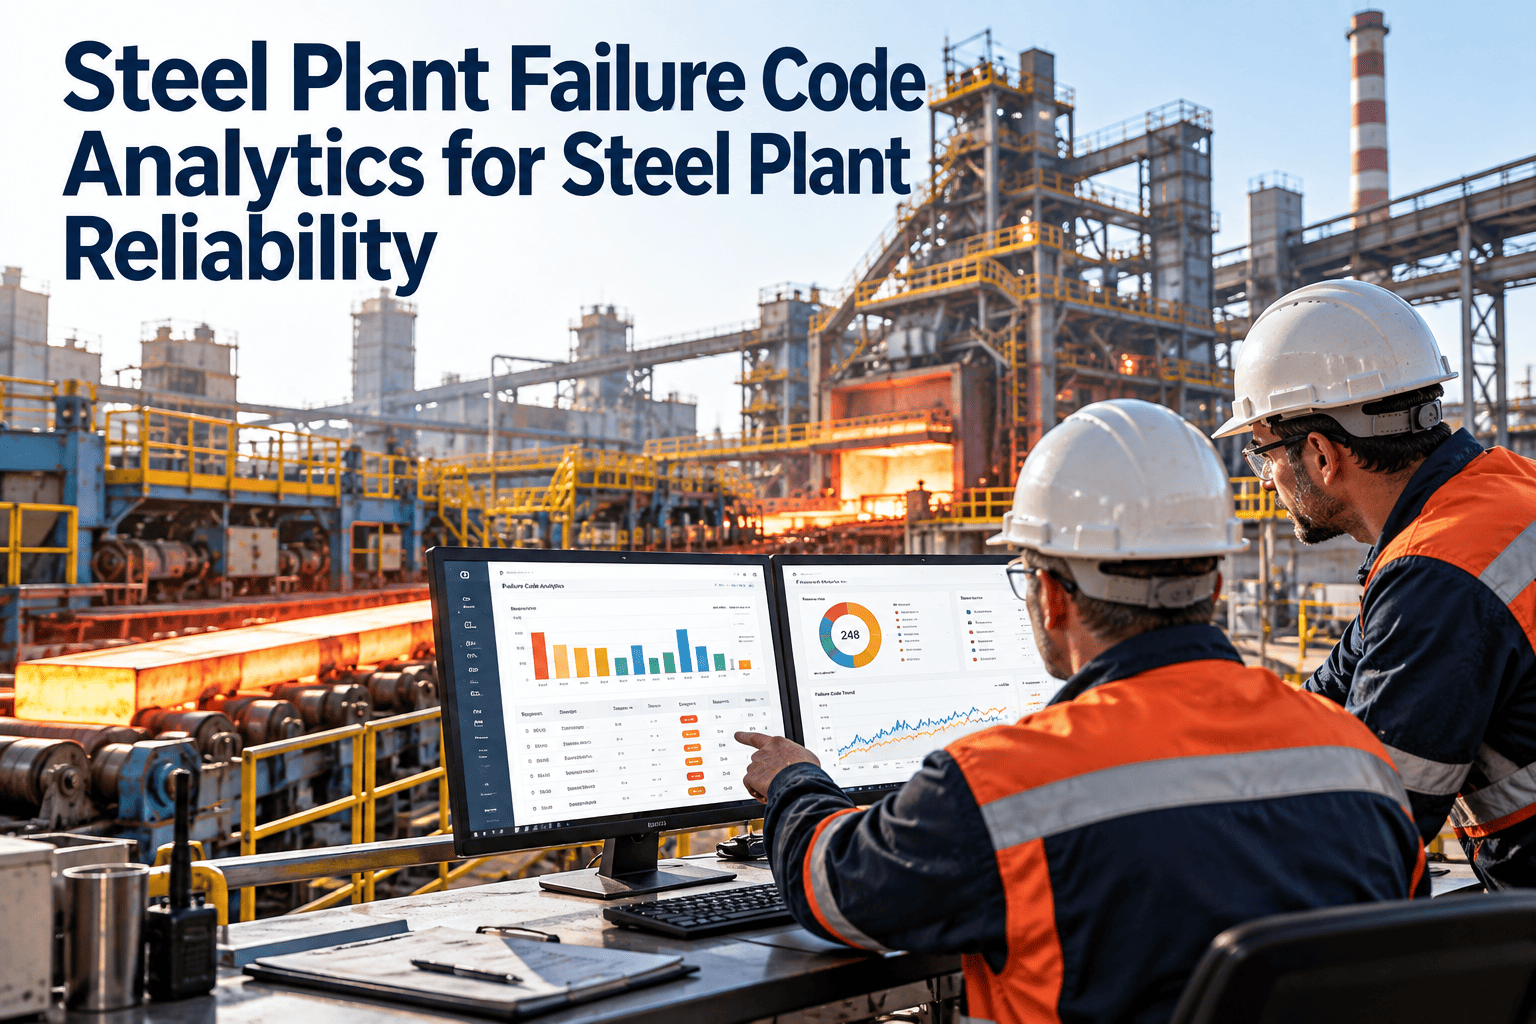
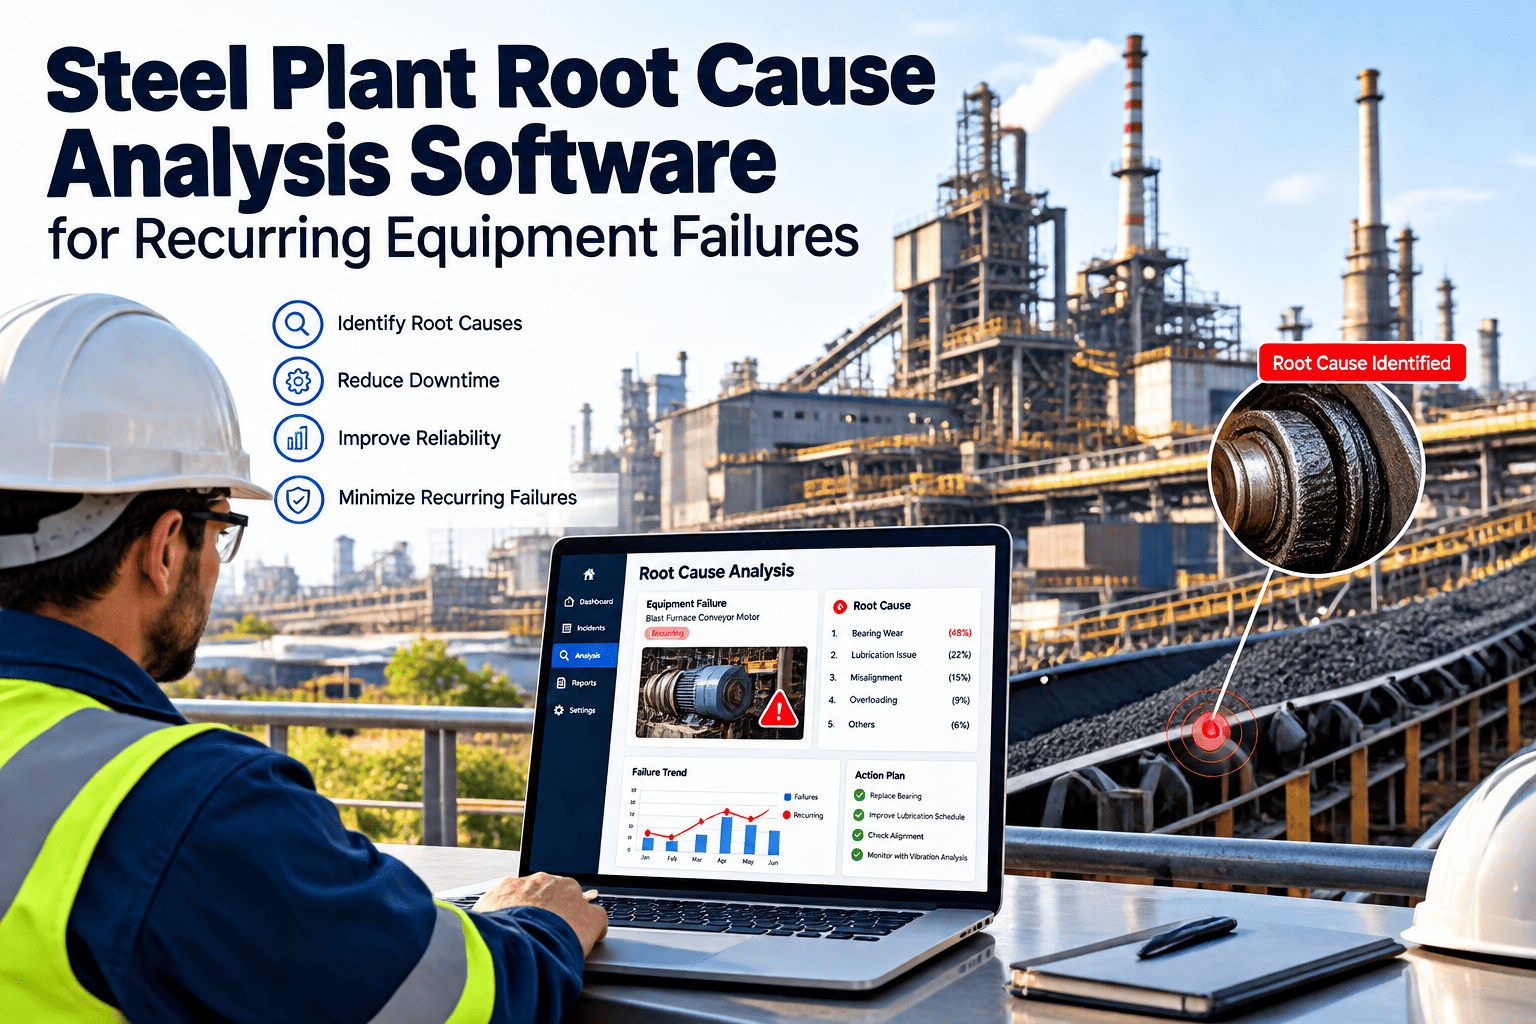
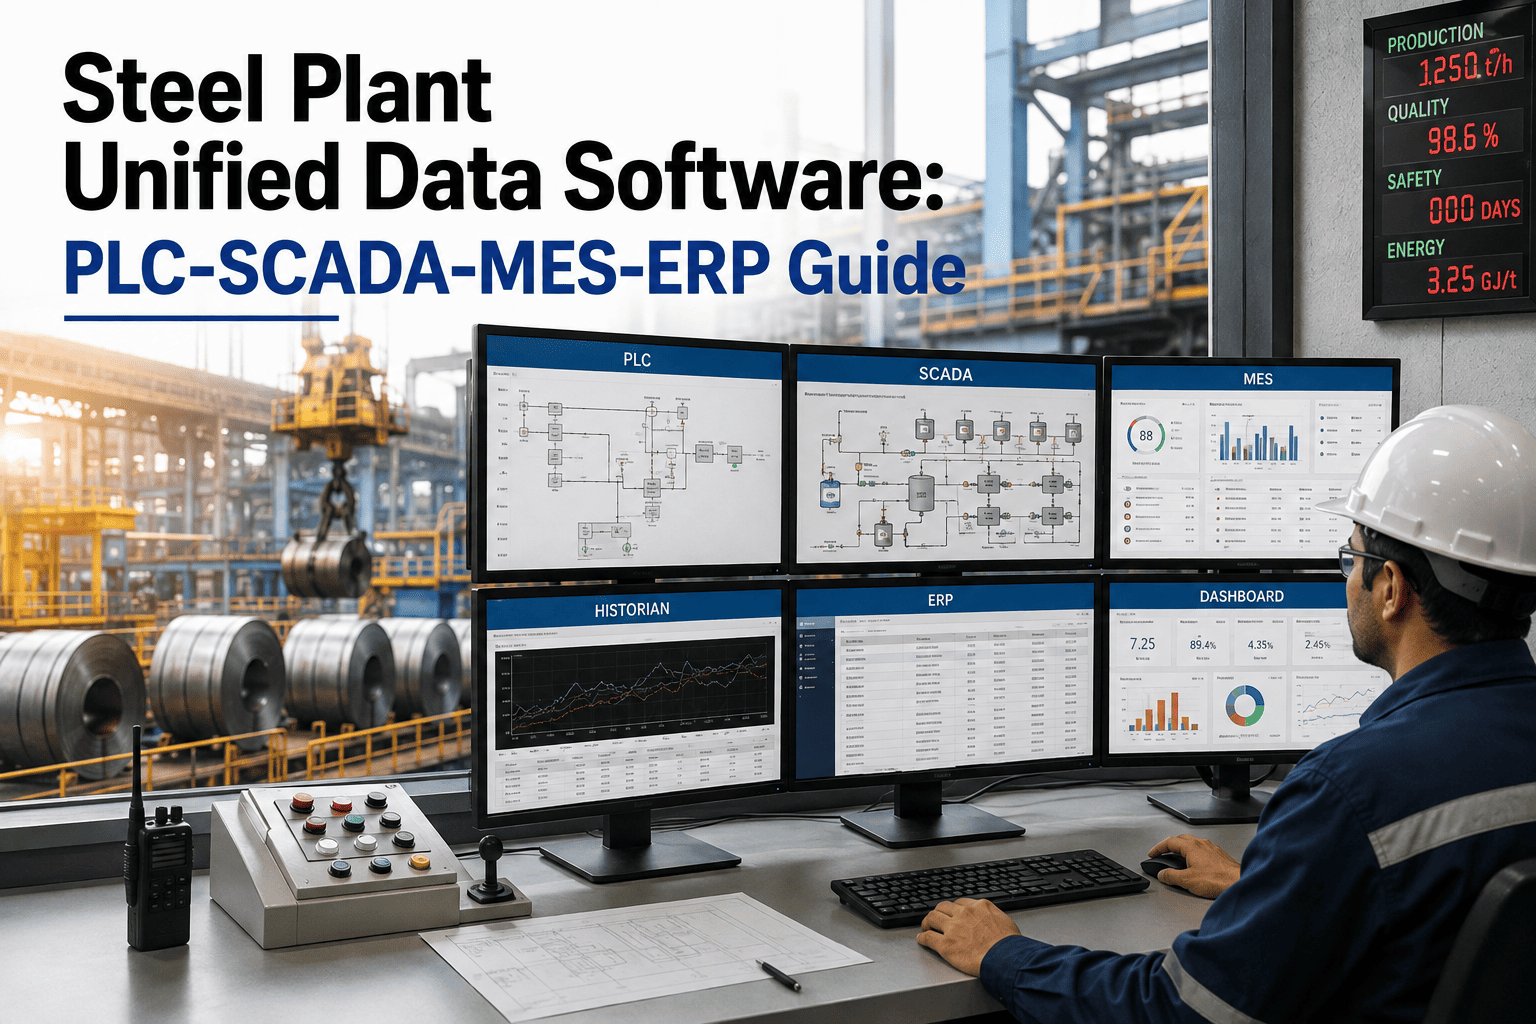
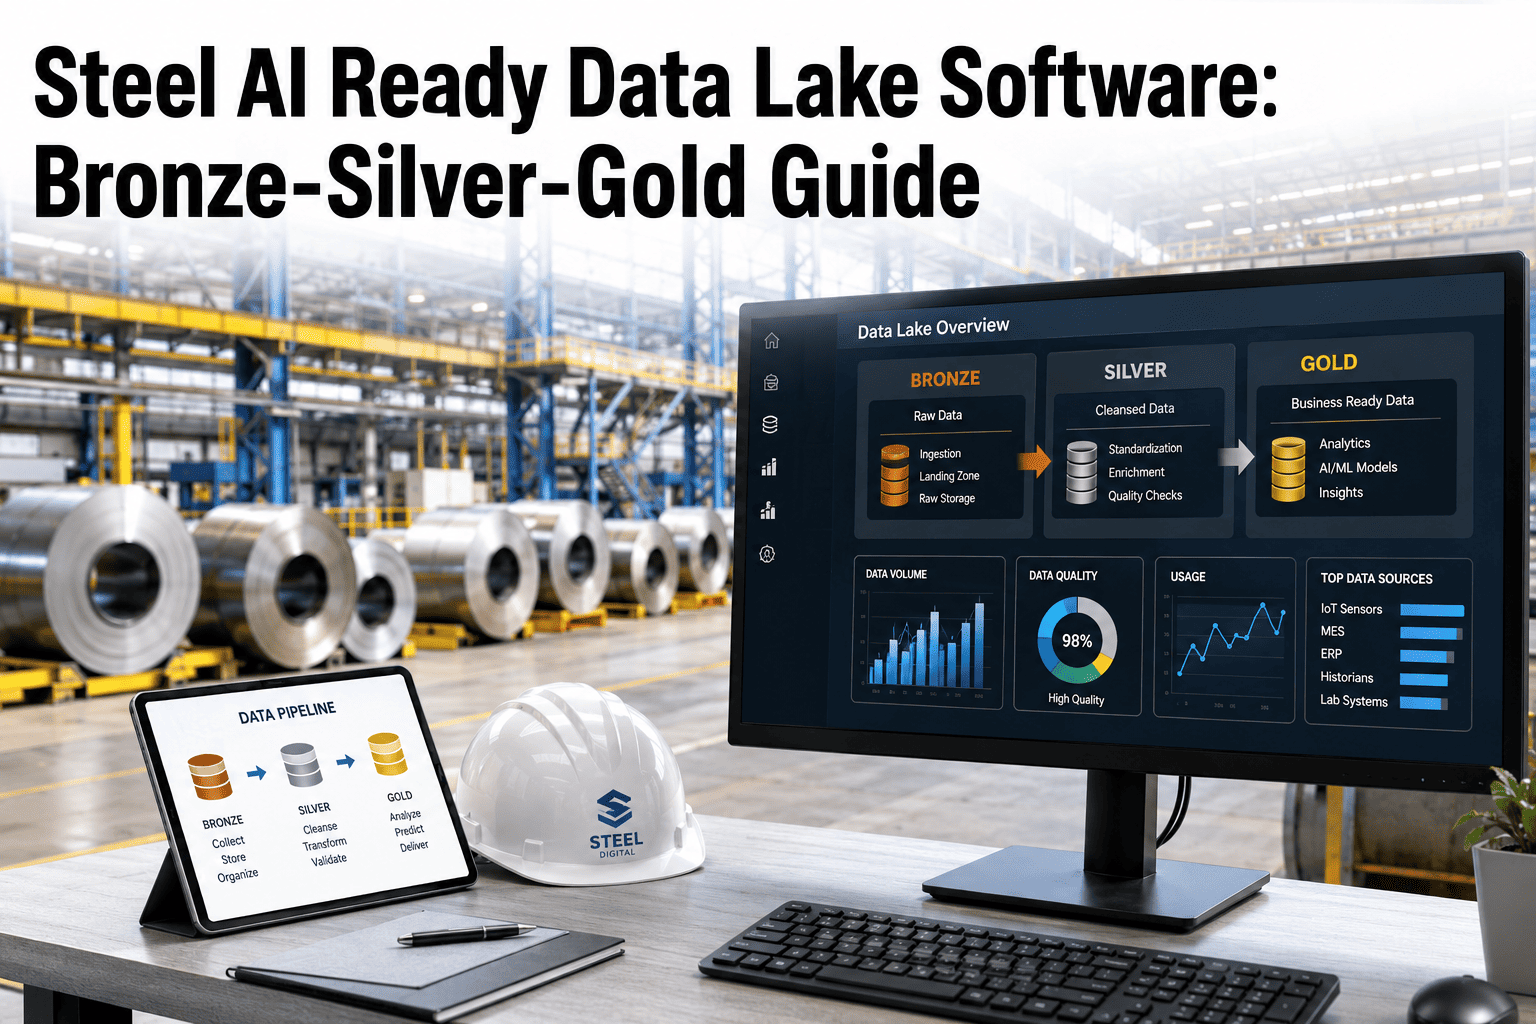
Steel plants generate over 2 terabytes of sensor and operational data every single day — yet most maintenance teams make decisions from last month's spreadsheet. OxMaint's unified analytics platform transforms scattered sensor feeds, work order histories, and failure logs into a single intelligence layer that tells maintenance leaders exactly where money is being lost and what to fix first. The global manufacturing data lake market is expanding at 22.8% CAGR, reaching $24.8 billion by 2033 — because plants that unify their data outperform those that don't. This article is your blueprint for building that foundation.
Article / Steel Plant Analytics
Steel Plant Data Lake & Analytics Platform: Unified Maintenance Intelligence
How forward-thinking steel plants are turning fragmented sensor data, CMMS records, and failure histories into one real-time intelligence engine — and cutting maintenance costs by up to 28% in the process.
$4.2B
Steel industry unplanned downtime cost in 2024
35–55%
Downtime reduction with mature analytics
91%
Plants report measurable ROI within 12 months
10x
Average ROI on predictive maintenance (US DOE)
Why Steel Plants Are Drowning in Data But Starving for Insight
The average integrated steel plant runs 340+ monitored assets across blast furnaces, rolling mills, and caster segments — each generating continuous streams of vibration, temperature, and operational data. Yet only 18% of steel plants have deployed dedicated maintenance analytics dashboards beyond basic CMMS reporting. The rest rely on spreadsheets, monthly PDFs, and gut instinct.
01
Siloed Data Sources
Sensor data sits in one system, work orders in another, and failure logs in a third. No unified view means no pattern recognition.
02
Reactive Decision-Making
Without connected analytics, maintenance teams respond to failures rather than preventing them — costing $50,000–$150,000 per downtime hour.
03
No Cross-Plant Benchmarking
Multi-site operations can't compare OEE, MTBF, or cost-per-ton across facilities without a shared analytics platform.
04
Executive Visibility Gap
Leadership sees budget reports — not real-time asset health. Maintenance remains a cost center instead of a performance multiplier.
The 4-Layer Steel Plant Data Architecture
A unified maintenance intelligence platform is built on four sequential layers. Each layer feeds the next, turning raw machine signals into strategic business decisions.
Layer 1
Data Ingestion
Vibration sensors, thermal monitors, PLCs, SCADA, and IoT devices feed raw data into a unified ingestion pipeline — structured and unstructured, in real time.
Vibration Sensors
SCADA/PLC
Thermal Monitors
Oil Analysis
Energy Meters
↓
Layer 2
Data Lake Storage
All raw data — sensor readings, work orders, failure codes, inspection logs — stored in native format. Scalable. Searchable. No data left behind.
Work Order History
Failure Codes
Inspection Logs
Parts Consumption
Labor Hours
↓
Layer 3
Analytics Engine
ML models run failure pattern mining, MTBF forecasting, and condition-based alerts — identifying bearing degradation and motor imbalance 2–4 weeks before failure.
Failure Pattern Mining
MTBF Forecasting
Anomaly Detection
RUL Estimation
Cost Modeling
↓
Layer 4
Executive Dashboards
Role-based dashboards deliver the right KPIs to the right people — plant managers see OEE and cost-per-ton, reliability engineers see MTBF trends and failure modes.
OEE Dashboard
Cost per Ton
Cross-Plant Benchmarks
Downtime Reports
Backlog Analytics
KPIs That Drive Steel Plant Maintenance Intelligence
Effective analytics starts with tracking the metrics that actually move the needle — not just activity counts. Here is the complete KPI framework for each audience in your organization.
| KPI |
Target Benchmark |
Audience |
Impact |
| Overall Equipment Effectiveness (OEE) |
85%+ (world-class) |
Plant Manager / GM |
Revenue protection |
| Maintenance Cost per Ton of Steel |
2–3% of RAV |
Finance / Executive |
Budget optimization |
| Planned vs. Unplanned Downtime Ratio |
85:15 or better |
Maintenance Manager |
Proactive culture shift |
| MTBF — Critical Assets |
Increasing trend |
Reliability Engineer |
Equipment life extension |
| MTTR |
<2 hours (target) |
Maintenance Supervisor |
Faster recovery |
| PM Compliance Rate |
95%+ |
All levels |
Failure prevention |
| Emergency Work Order Ratio |
<10% of total |
Maintenance Manager |
Cost reduction |
| Spare Parts Stockout Frequency |
Near zero |
Procurement / Finance |
Downtime prevention |
What Analytics-Driven Steel Plants Actually Achieve
These are documented outcomes from steel and heavy manufacturing plants that implemented unified maintenance analytics — not projections.
30%
Reduction in Unplanned Downtime
Midwest Steel Manufacturing / OxMaint case study
$850K
Annual Operational Savings
Achieved within 11-month ROI period
$1.5M
Annual Savings — Steel Industry Avg.
McKinsey / industry benchmark
178%
MTBF Improvement on Critical Assets
320 hrs → 890 hrs (OxMaint manufacturing data)
25%
Lower Maintenance Costs
McKinsey analytics-driven maintenance benchmark
61%
Faster Mean Time to Repair
4.6 hrs → 1.8 hrs with unified data access
See OxMaint Analytics in Your Steel Plant
Connect your sensor data, CMMS records, and failure history into one real-time dashboard — live in 30 days.
Implementation Checklist: Building Your Steel Plant Data Lake
Follow this sequence to move from fragmented maintenance data to a unified intelligence platform. Most steel plants complete Phase 1–3 within 90 days and begin seeing measurable ROI before the end of month 6.
Asset inventory with criticality classification (A/B/C)
CMMS baseline — clean asset data, standardized failure codes
Digitize legacy paper maintenance records
Establish baseline OEE, MTBF, MTTR per production line
Define KPI ownership by role (manager / engineer / supervisor)
Deploy vibration + thermal sensors on top 20 critical assets
Connect sensor feeds to OxMaint data ingestion pipeline
Integrate SCADA / PLC data streams
Configure automated work order triggers from condition alerts
Set escalation rules — overdue tasks alert supervisors at 24 hrs
Enable failure pattern mining across 6+ months of work order history
Activate MTBF forecasting per equipment class
Configure role-based dashboards (executive / manager / engineer)
Set up cross-plant benchmarking if multi-site operation
Run first monthly analytics review with department heads
Identify top 3 equipment categories driving 60%+ of downtime events
Adjust PM frequencies based on failure pattern data
Pre-position spare parts for highest-risk assets
Expand sensor coverage to secondary asset tiers
Target emergency work order ratio below 10% of total volume
"
We were generating mountains of data from our rolling mills and blast furnaces, but none of it was connected. Once we unified sensor alerts, work order history, and failure codes into a single analytics layer, we identified three equipment categories responsible for over 60% of our downtime — patterns that were invisible when data lived in separate systems. The analytics platform paid for itself in the first quarter.
— Reliability Manager, Integrated Steel Plant (2,000+ employees)
Verified OxMaint Customer Review
★★★★★
Source: Direct customer interview, 2025
Market Context: Why This Is the Right Time to Act
Manufacturing Data Lake Market
$24.8B
Projected value by 2033 at 22.8% CAGR
Predictive Maintenance Market
$82.2B
Projected value by 2031 at 34.1% CAGR
Steel Plant AI Optimization
$8.04B
Market size by 2033 at 18.4% CAGR
Analytics Adoption Gap
82%
Of steel plants still lack a dedicated analytics dashboard
Plants using analytics-driven maintenance achieve 15–25% lower maintenance costs and 20–30% higher equipment availability than those relying on traditional reporting. The 82% of plants that haven't adopted unified analytics represent the competitive opportunity for those that act now.
OxMaint Capabilities That Power Steel Plant Analytics
01
Real-Time OEE Dashboard
Availability, Performance, and Quality tracked live across every production line with drill-down to individual asset health and failure probability scores.
02
Sensor Data Integration
Vibration, thermal, acoustic, and electrical signatures ingested from any IIoT device — alerts generated when degradation patterns predict failure 2–4 weeks out.
03
Failure Pattern Mining
Machine learning analyzes historical work orders to identify recurring failure modes, enabling targeted PM adjustments that eliminate repeat breakdowns at their root cause.
04
Cross-Plant Benchmarking
Multi-facility operations compare OEE, MTBF, and cost-per-ton across sites — surfacing which plant leads in reliability and which needs the most urgent attention.
05
Automated Work Order Routing
Condition-based alerts auto-generate work orders with priority, asset history, and required parts attached — no manual handoff, no delay between detection and action.
06
Executive Reporting
Role-based dashboards deliver the right KPIs to the right people. Executives see cost-per-ton and OEE trends. Engineers see MTBF, failure mode frequency, and backlog aging.
Frequently Asked Questions
How long does it take to build a unified data platform for a steel plant?
Most steel plants complete the foundational data layer — asset inventory, CMMS baseline, and initial sensor integration — within 30 to 60 days. Analytics dashboards and failure pattern mining activate in months 2 to 3.
Sign up for OxMaint to begin your asset baseline today, and most facilities report measurable downtime reduction before the end of month 6. The full ROI cycle, including cross-plant benchmarking and advanced ML models, typically completes within 12 months of go-live.
What data sources does OxMaint connect in a steel plant environment?
OxMaint integrates with vibration sensors, thermal monitors, SCADA systems, PLCs, energy meters, oil analysis outputs, and manual inspection records — structured and unstructured. All data feeds into a unified ingestion pipeline where work orders, failure codes, labor hours, and parts consumption are correlated against sensor readings.
Book a demo to see how your specific sensor ecosystem maps to our platform. Legacy data from spreadsheets and paper logs can also be digitized and loaded as historical baseline records.
How does cross-plant benchmarking work for multi-site steel operations?
OxMaint's analytics platform supports portfolio-level dashboards that aggregate OEE, MTBF, maintenance cost per ton, and PM compliance across multiple facilities into a single executive view. Site managers see their own plant's data in detail, while plant directors and corporate leadership see normalized cross-plant comparisons that identify which site leads in reliability and which has the largest improvement opportunity. This capability is especially valuable for integrated steel groups running 3 to 10 plants under one ownership structure.
Start a free trial to configure your multi-site hierarchy.
What ROI can a steel plant realistically expect from a data analytics platform?
Industry benchmarks show steel plants with unified maintenance analytics achieve 15–25% lower maintenance costs and 20–30% higher equipment availability versus traditional reporting approaches. Documented case outcomes include $850,000 in annual savings with an 11-month payback period (Midwest Steel / OxMaint) and $1.5 million in annual savings for steel plants applying predictive analytics broadly (McKinsey benchmark). The US Department of Energy documents a 10x average ROI on predictive maintenance programs, with 91% of steel plants reporting measurable returns within their first 12 months of deployment.
Book a demo to model your plant's specific ROI scenario.
Does OxMaint require replacing our existing CMMS?
No. OxMaint is designed to function as a unified analytics and work order management layer that can ingest data from existing systems, including legacy CMMS platforms, SCADA outputs, and ERP records. Many steel plants run OxMaint alongside their existing infrastructure during a transition period, progressively migrating work order management as teams adopt the mobile platform. The analytics engine operates on historical data exported from legacy systems, meaning value generation begins immediately — even before full platform migration is complete.
Sign up free to evaluate integration compatibility with your current stack.
Stop Making Decisions from Last Month's Spreadsheet
Every day without unified analytics is another day of preventable downtime. OxMaint connects your steel plant's sensor data, work orders, and failure history into one real-time intelligence platform — and most plants are live within 30 days.