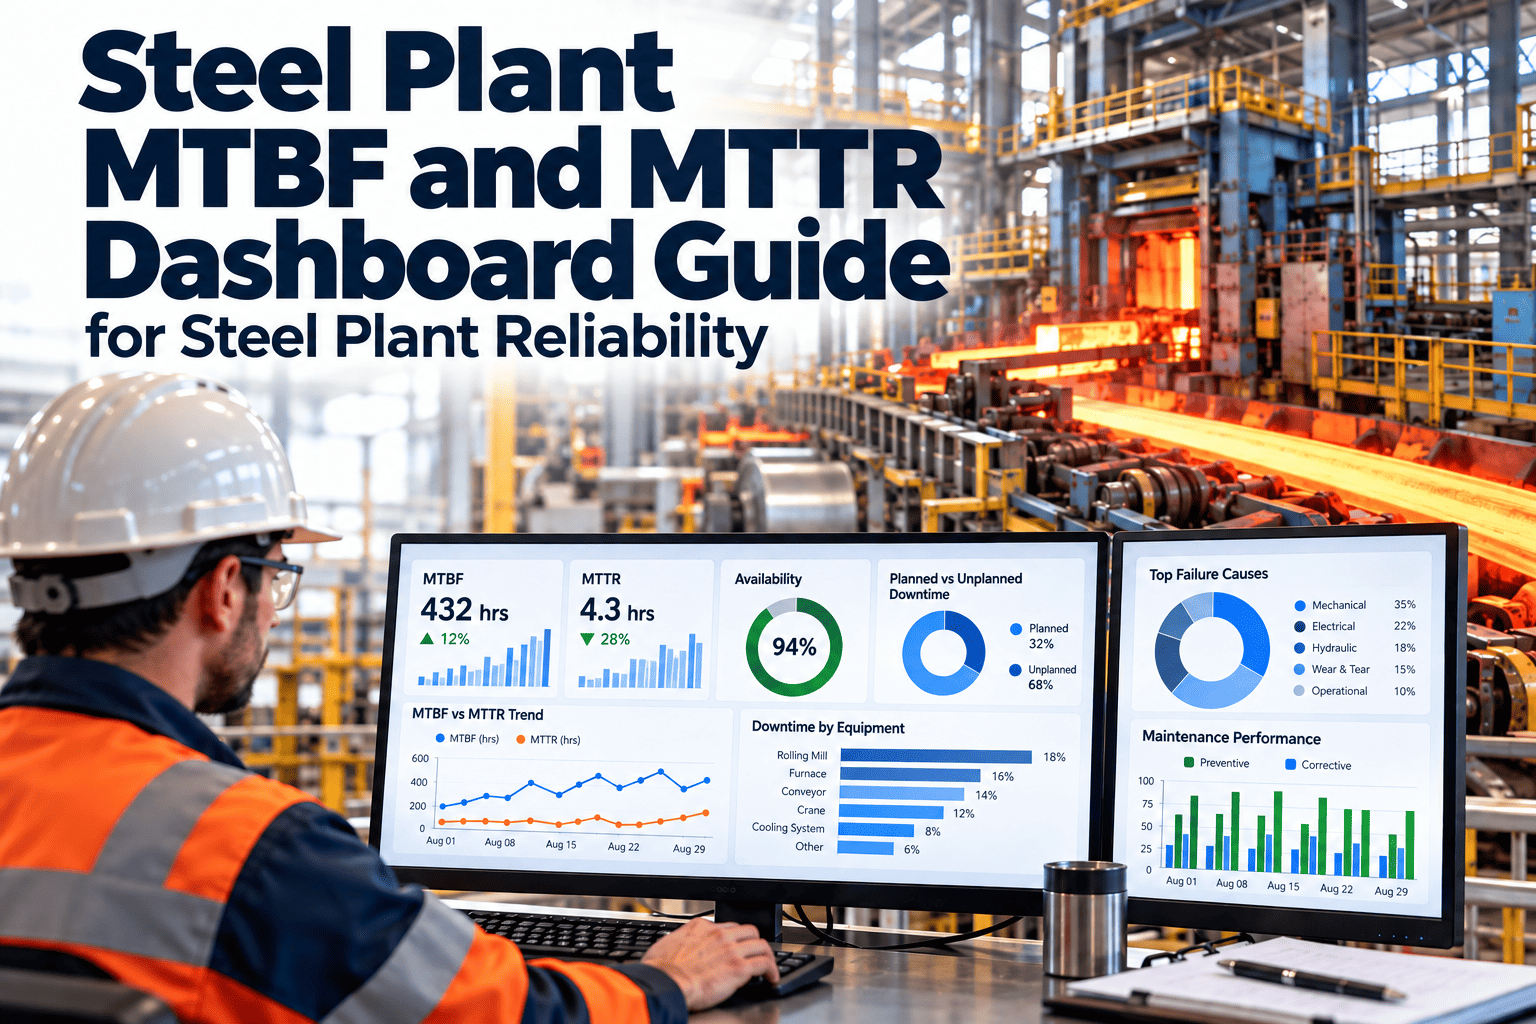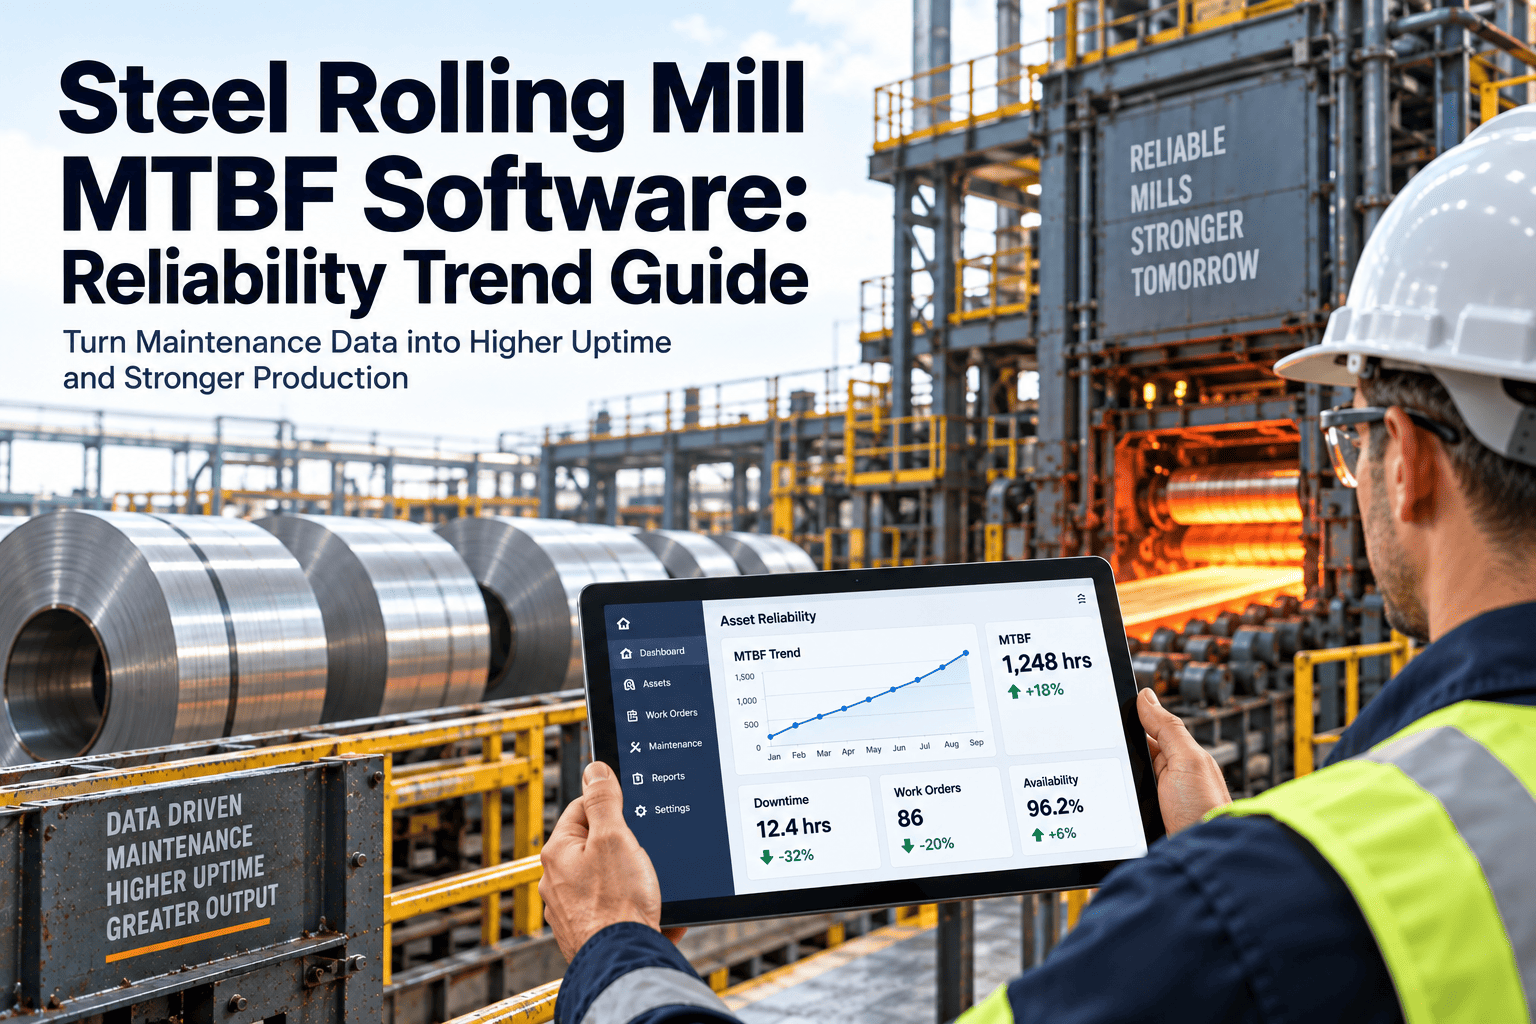
Every steel plant measures maintenance, and almost every plant argues about the numbers. The caster team says availability is fine, the hot strip mill disagrees, and the corporate report compares a blast furnace with an electric arc furnace. A steel plant maintenance benchmarking dashboard for maintenance and reliability fixes this by defining each KPI once, normalising per tonne or operating hour, and showing each audience its own view. This guide covers the formulas, the benchmarking levels and the data discipline behind them, with steel plant maintenance software as the system of record.
Steel Plant Maintenance Benchmarking Dashboard for Maintenance and Reliability
Measure downtime, maintenance cost per tonne, MTBF and MTTR, PM compliance, planned work and asset performance. Compare line to line inside your plant, plant to plant inside your group, and against external references, with fair rules and work order data you can defend in a review.
Why Steel Maintenance Benchmarks Usually Mislead
A benchmark is only as good as the definition behind it. In steel, four problems turn most comparison charts into arguments rather than decisions.
Formula Reference: The Nine Metrics Behind the Dashboard
Agree these definitions in writing before building any screen. The table also shows whether each metric leads performance or reports it afterwards, and which role should own it.
| Metric | Formula | Type | Owner | What it tells you |
|---|---|---|---|---|
| MTBF | Total operating time / number of failures | Lagging | Reliability engineer | How long equipment runs between failures; useful per equipment class, not plant wide. |
| MTTR | Total repair time / number of repairs | Lagging | Maintenance supervisor | How quickly the crew restores function, including waiting for parts and permits. |
| Availability | Uptime / (uptime + downtime), or MTBF / (MTBF + MTTR) | Lagging | Operations and maintenance jointly | Share of scheduled time the asset could run; define what counts as scheduled time. |
| PM compliance | PMs completed on time / PMs scheduled | Leading | Planner and supervisor | Whether preventive tasks are actually done inside their window. |
| Planned maintenance percentage | Planned maintenance hours / total maintenance hours | Leading | Maintenance manager | How much labour is spent on work that was scheduled rather than reactive. |
| Schedule compliance | Scheduled work orders completed / work orders planned for the period | Leading | Planner | Whether the weekly plan survives contact with the shop floor. |
| Backlog in crew-weeks | Outstanding estimated hours / weekly craft capacity hours | Leading | Planner and maintenance manager | How many weeks of work are waiting for each craft, and whether it is growing. |
| Maintenance cost per tonne | Maintenance cost / tonnes produced | Lagging | Maintenance manager and finance | Cost normalised for output so busy and quiet periods compare fairly. |
| Maintenance cost as percent of RAV | Annual maintenance cost / replacement asset value | Lagging | Plant leadership and finance | Spend relative to the size and age of the asset base; needs a credible RAV. |
Leading metrics describe how well work is being managed today. Lagging metrics describe outcomes that arrive weeks later. A dashboard that shows only lagging metrics tells you what already went wrong.
The Three-Level Benchmarking Ladder
Start at the bottom rung. External comparison is the least reliable level and should come last, after your own data survives internal scrutiny.
Fairness rules that keep comparisons honest
Benchmark From Work Orders, Not Spreadsheets
Oxmaint can be configured to capture downtime, failure codes and labour on every work order, so MTBF, MTTR, PM compliance and cost per tonne come from one record. See how it fits your units.
One Dashboard, Three Layers, Three Audiences
A single screen for everyone fails everyone. Stack the dashboard in layers, so each audience sees the metrics it can act on at its own rhythm.
Data Trust: What Must Be True in the CMMS
Benchmarks collapse the first time someone asks where a number came from. Four foundations make the answer short and convincing.
Worst-actor Pareto: the chart that earns attention
A worst-actor Pareto ranks assets or failure modes by downtime hours or maintenance cost, so effort lands on the few that dominate losses. The shape below is a concept sketch only, not data from any plant.
Read the Pareto by cause code as well as by asset. Five different assets failing for the same cause, such as lubrication or contamination, is a process problem, not five equipment problems.
Who keeps the data clean
Hold a short monthly exceptions review: assets with no failure code, work orders closed late, stoppages with no linked work order, and duplicate asset records. Clearing the exceptions list is what keeps every chart above defensible. Data quality here means completeness, consistency, accuracy, timeliness, uniqueness and validity, and each one can be checked with a simple report.
What to Watch on Each Steel Unit
The same nine formulas apply everywhere, but the story differs by unit. Use this matrix to decide which metrics lead the conversation and which context to record.
| Unit | Typical critical assets | Metrics that lead | Context to record |
|---|---|---|---|
| Blast furnace | Stoves, cast house equipment, gas cleaning, charging system | Availability, cost per tonne of hot metal, backlog in crew-weeks | Campaign stage, planned relines |
| BOF shop | Converter drives, hoods, cranes, ladle transfer | MTTR, availability, repeat failures | Heats per day, crane duty |
| EAF shop | Furnace transformer, electrodes and regulation, hydraulics, off-gas system | MTBF, MTTR, planned maintenance percentage | Power-on time, scrap mix |
| Ladle metallurgy and caster | Ladle turrets, mould oscillation, segment rolls, hydraulics | PM compliance, availability, cost per tonne | Sequence length, steel grades |
| Reheat furnace and hot strip mill | Walking beams, descaling pumps, work rolls, drives, hydraulic power packs | Downtime hours per tonne, schedule compliance, MTBF | Product mix, roll change intervals |
| Utilities | Gas mains, compressors, water pumps, motor control centers | Availability, PM compliance, overdue inspections | Demand pattern, redundancy |
About Targets: Set Them From Your Own Baseline
Figures such as 90 percent PM compliance or 85 percent planned work are commonly cited, but they circulate without a traceable primary source. Treat them as conversation starters, never as proof of world class performance, and never as measured results.
How Oxmaint Supports the Dashboard
A benchmarking dashboard is a view of maintenance records. Oxmaint maintenance management software supplies the records, and its reporting and dashboard capabilities can be configured around the layers above.
- Downtime in an operations log, repairs in another file
- Failure descriptions typed as free text
- PM status tracked in spreadsheets per area
- Monthly report assembled by hand, argued about for a week
- Predictive maintenance pilots with no work order link
- Asset hierarchy by plant, line and equipment
- Work orders with mandatory failure and cause codes
- PM scheduling and inspection checklists with completion records
- Mobile close-out by technicians at the asset
- Condition-based triggers that create work orders for steel plant predictive maintenance
Spares and inventory records add the cost side, and the audit trail supports compliance records. For steel equipment reliability work, this is the base that predictive tools need: ISO 17359 expects criticality, failure modes and maintenance action to be defined, and the CMMS is where those links live. Teams comparing the best CMMS for steel plants should test exactly this chain, from stoppage to coded work order to chart.
Frequently Asked Questions
Build a Benchmark Your Plant Can Defend
Set up your asset hierarchy, failure codes and downtime capture in Oxmaint, then let the dashboard follow from the work orders. Start with your own baseline and compare outward from there.