
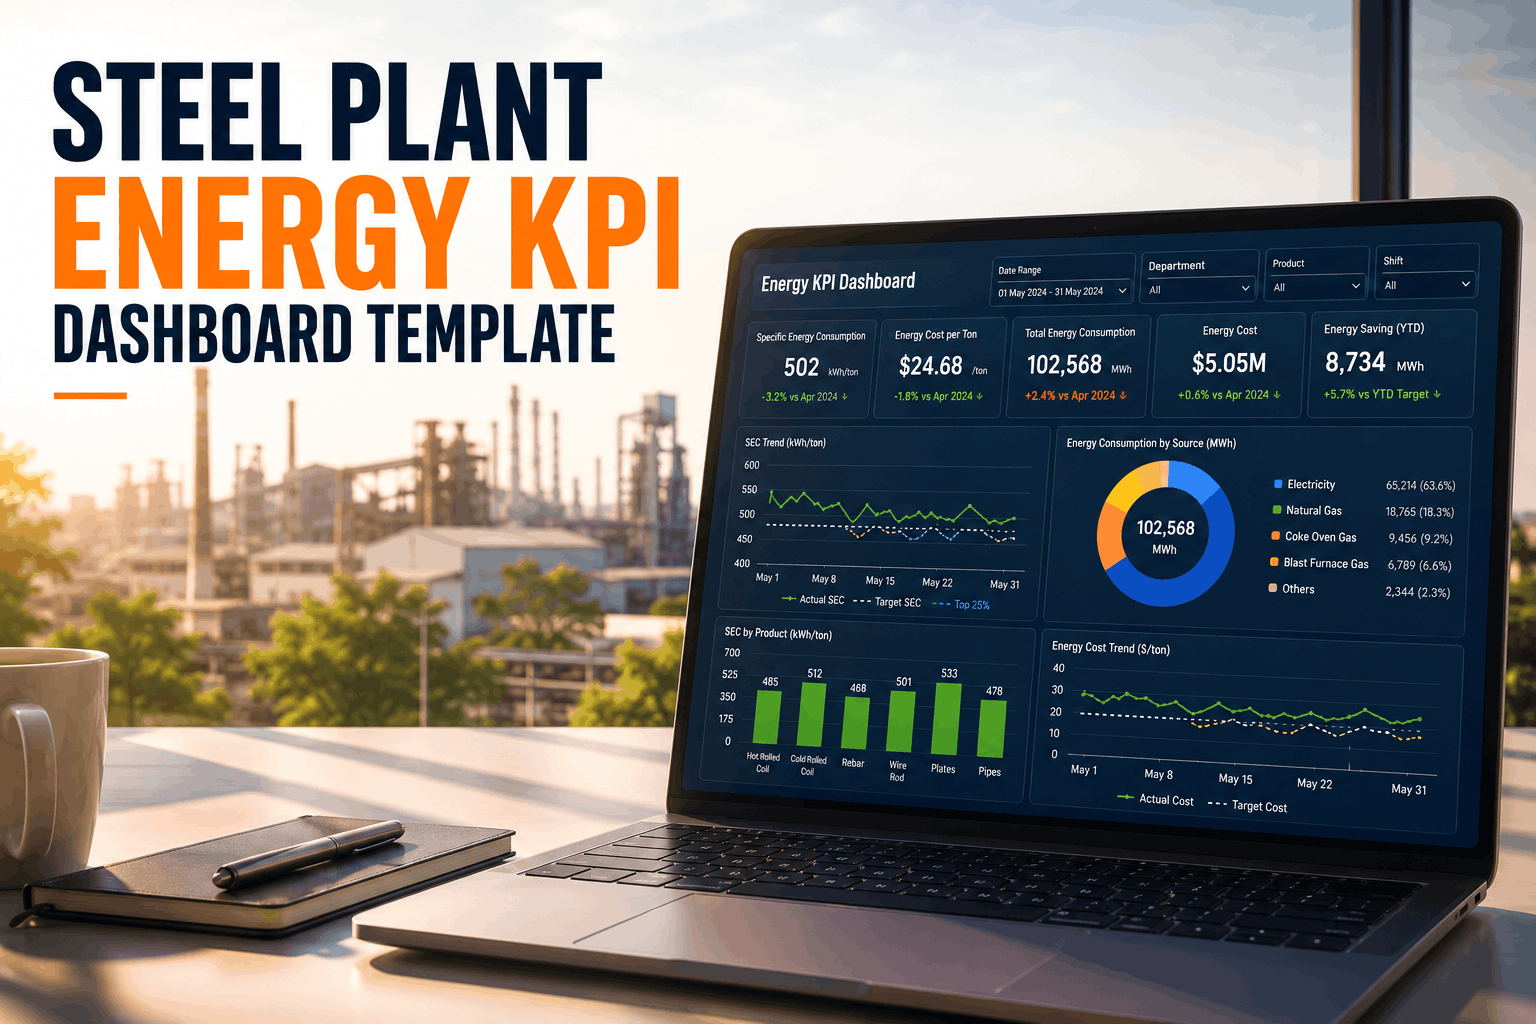
Steel manufacturing consumes more energy than any other industrial sector — the average integrated steel mill spends $40–80 million annually on electricity and fuel. Yet 82% of North American mills lack real-time energy KPI visibility, relying on monthly utility bills and disconnected spreadsheets to track consumption. OxMaint's free steel plant energy KPI dashboard template automates SEC (Specific Energy Consumption), kWh/ton, GJ/ton, and EnPI (Energy Performance Indicator) tracking — integrating SCADA data, utility feeds, and production metrics into a single audit-ready dashboard. Download now and transform energy data into predictive cost control, ISO 50001 compliance, and ENERGY STAR certification pathways — whether you're tracking blast furnace efficiency, rolling mill motor performance, or facility-wide electrical demand management across your entire steel production footprint.
Steel Plant Energy Intelligence in One Dashboard
OxMaint's free template includes SEC calculations, kWh/ton tracking, thermal intensity metrics, EnPI trends, and ISO 50001-ready compliance documentation — ready to integrate with your existing SCADA systems and CMMS today.
Why Energy KPI Dashboards Are Critical for Steel Mill Economics
Steel mill energy consumption directly drives profitability. A 5% improvement in specific energy consumption across a 2-million-ton-per-year mill translates to $4–7 million in annual fuel cost savings — equivalent to a capital project with zero implementation cost. Yet most mills have blind spots: they see monthly utility bills aggregated across the entire facility, but lack visibility into unit-level energy performance, peak demand windows, or equipment-specific efficiency trends. A blast furnace operating at 6.5 GJ/ton versus the industry benchmark of 6.2 GJ/ton wastes $200,000+ annually in excess fuel costs. Hot rolling mills with worn roller bearings consume 8–12% more electrical energy than properly maintained equipment. Continuous casting systems with inadequate thermal insulation lose millions in process heat that drives fuel consumption. Digital energy KPI dashboards surface these hidden inefficiencies — enabling maintenance and operations teams to prioritize interventions that deliver measurable energy and cost reduction. ISO 50001 certification and ENERGY STAR endorsement require documented energy baselines, trend analysis, and improvement tracking; energy KPI dashboards provide the data infrastructure that makes compliance automatic rather than scrambled.
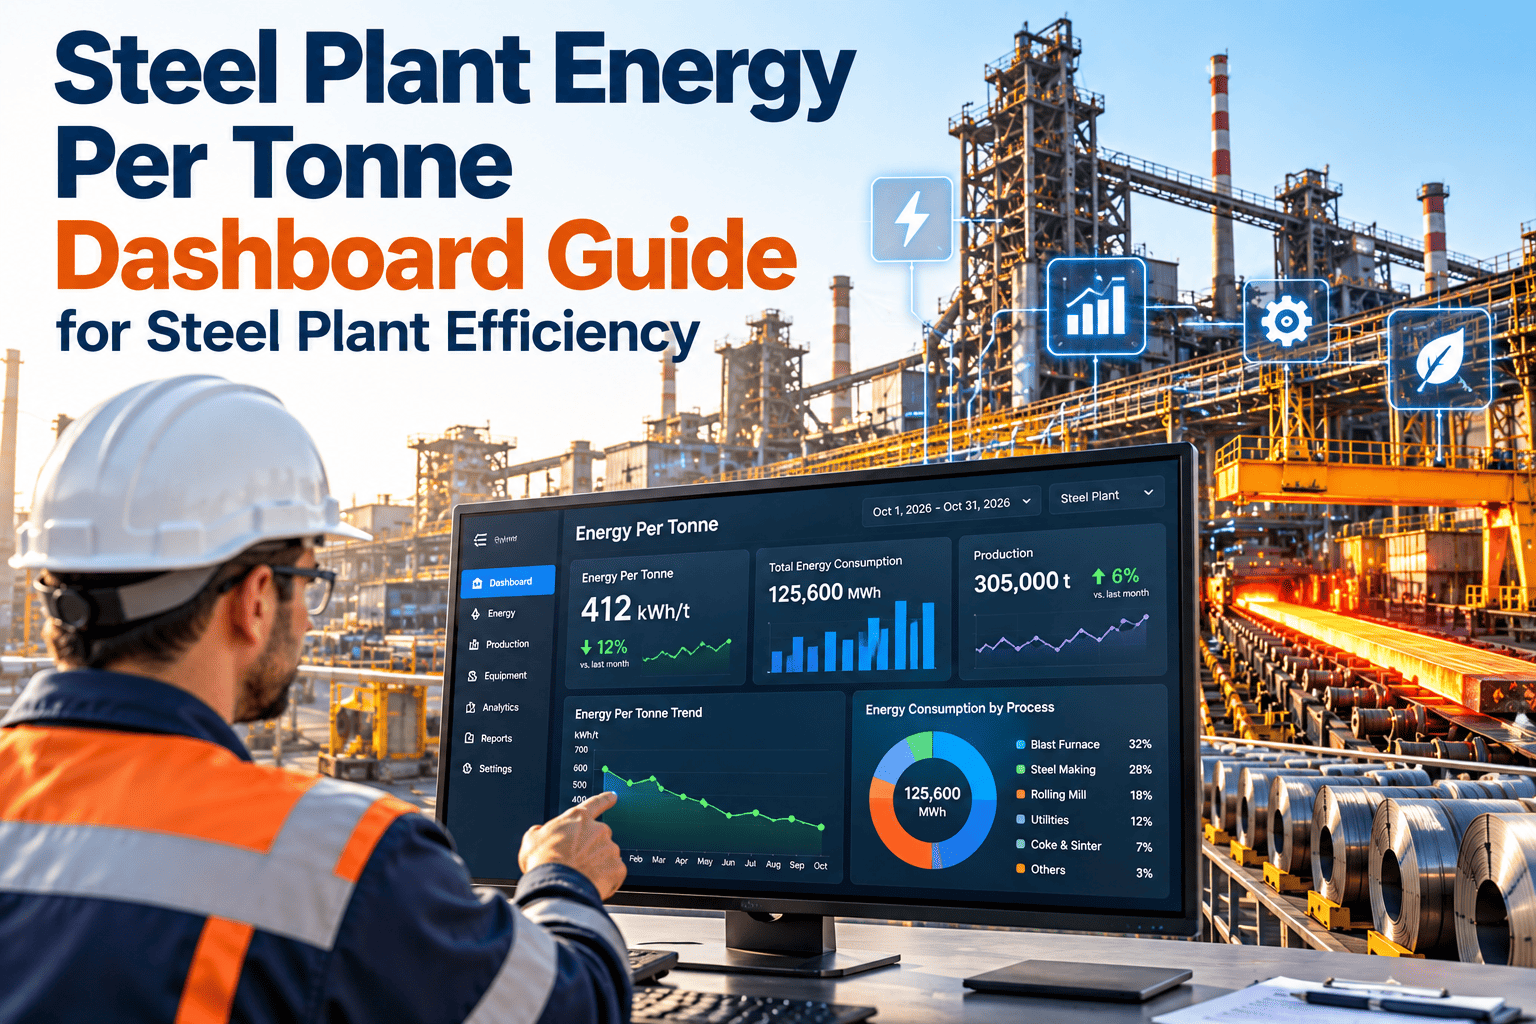
Automatically calculate Specific Energy Consumption and kilowatt-hour per ton metrics from SCADA data and production rates. OxMaint compares live performance against baseline and industry benchmarks, highlighting equipment or process windows operating above target efficiency.
Track gigajoules per ton of production for furnace operations, casting, and heating processes. Integrate fuel consumption data (natural gas, coke, coal) with production output to surface thermal efficiency degradation and combustion system inefficiencies.
Calculate EnPI as required by ISO 50001 and build monthly, seasonal, and annual trend graphs. OxMaint stores baseline EnPI, adjusts for production volume and external factors (ambient temperature, raw material quality), and flags improvement opportunities automatically.
Visualize peak electrical demand windows and identify load-shifting opportunities. OxMaint integrates utility rate structures and demand charge windows, helping operations schedule high-energy processes during lower-cost periods — reducing peak demand charges that typically represent 30–50% of electrical costs.
Assign energy consumption to specific equipment: blast furnace blowers, rolling mill motors, casting system heaters. OxMaint correlates electrical consumption with vibration data, bearing temperature, and maintenance records — flagging equipment approaching failure before energy efficiency drops catastrophically.
Auto-generate energy baseline documentation, annual performance reports, and improvement project tracking required for ISO 50001 certification. ENERGY STAR mills export compliance data directly from OxMaint dashboards, eliminating manual report compilation.
Energy KPI Benchmarks and Target Ranges for Integrated Steel Mills
Steel mill energy performance varies dramatically by process route (blast furnace vs. electric arc), equipment age, automation level, and maintenance discipline. Industry benchmarks from the American Iron and Steel Institute (AISI), International Energy Agency (IEA), and World Steel Association provide reference ranges. Leading mills operate near theoretical minimums; median performers lag significantly. Your energy KPI dashboard must compare real-time performance against industry benchmarks and your own historical baseline — enabling operations teams to identify and prioritize high-impact efficiency projects.
| Process / Equipment Class | Industry Benchmark (USA) | Best-in-Class Performance | Key Energy Drivers | Optimization Priority |
|---|---|---|---|---|
| Blast Furnace (BF + BOF) | 6.0–6.5 GJ/ton hot metal | 5.8–6.0 GJ/ton (optimized mills) | Coke rate, fuel consumption, blast air temp | Pulverized coal injection (PCI), blast temp optimization |
| Electric Arc Furnace (EAF) | 0.5–0.7 MWh/ton | 0.4–0.5 MWh/ton (ultra-efficient) | Scrap melting, electrode consumption, off-gas recovery | Scrap pre-heating, waste heat recovery, power factor |
| Hot Rolling Mill (Motor Drive) | 80–120 kWh/ton finished steel | 70–85 kWh/ton (best mills) | Stand efficiency, motor sizing, bearing friction | VFD retrofit, bearing maintenance, load optimization |
| Cold Rolling Mill (Electrical) | 30–50 kWh/ton | 25–35 kWh/ton (efficient operations) | Reduction efficiency, motor performance, lubrication system | Motor upgrade, cooling system efficiency, load sharing |
| Continuous Casting (Thermal + Electrical) | 0.8–1.2 GJ/ton | 0.7–0.9 GJ/ton (optimized) | Reheat furnace efficiency, casting speed, insulation quality | Furnace insulation, burner optimization, casting speed increase |
| Sintering Plant (Thermal) | 2.5–3.5 GJ/ton sinter | 2.2–2.8 GJ/ton (best operations) | Fuel consumption, air flow, return fines recycling | Waste heat recovery, fuel efficiency, process control |
Building Your Steel Plant Energy KPI Dashboard in OxMaint
SCADA Data Integration and Meter Configuration
Connect SCADA systems, sub-meters, and utility feeds to OxMaint via Modbus, OPC-UA, or API integration. Configure electrical meters, gas consumption monitors, and fuel flow instruments. OxMaint validates data quality and alerts on sensor failures or unusual spikes — ensuring baseline energy calculations remain accurate.
Production Rate Integration and Normalization
Link production rates (tons/hour, tons/day) from MES, PLC, or manual input. OxMaint automatically normalizes energy consumption to production volume, calculating kWh/ton and GJ/ton metrics dynamically. Adjust for process variations: production rate changes, raw material shifts, or ambient temperature effects.
Energy Baseline and Benchmark Definition
Establish energy baseline using 12 months of historical data or industry benchmarks. Define target KPIs for each process: blast furnace GJ/ton, hot mill kWh/ton, casting efficiency. OxMaint compares real-time performance against baseline and flags deviations — quantifying energy waste in cost terms.
Equipment-Level Energy Attribution and Sub-Metering
Allocate total energy consumption to specific equipment (furnaces, motors, heaters) using sub-meter data or engineering estimates. OxMaint tracks equipment-level efficiency trends, identifying high-consumption equipment requiring maintenance or replacement — enabling targeted energy reduction projects.
Peak Demand and Utility Rate Integration
Import utility rate schedules (energy cost, peak demand charges, time-of-use rates). OxMaint calculates total energy costs, identifies peak demand windows, and models load-shifting benefits. Simulate energy cost savings from demand response programs or process rescheduling.
Reporting and ISO 50001 / ENERGY STAR Compliance
Generate monthly, quarterly, and annual energy KPI reports with performance vs. baseline analysis, improvement project tracking, and sustainability documentation. Export ISO 50001-compliant baseline reports and ENERGY STAR application data directly from OxMaint dashboards.
Steel Plant Energy Optimization Best Practices from Industry Leaders
Energy KPI Metrics That Drive Steel Mill Profitability and Sustainability
What's Included in OxMaint's Steel Plant Energy KPI Dashboard Template
OxMaint automatically calculates SEC (specific energy consumption), kWh/ton, GJ/ton, and EnPI from SCADA data and production rates. Real-time dashboards display performance vs. baseline and industry benchmarks. No manual spreadsheet calculations — metrics update continuously as data arrives.
Break down total facility energy consumption to individual equipment: furnaces, motors, heaters, compressors. OxMaint correlates equipment-level energy consumption with maintenance records, vibration data, and bearing temperature — enabling predictive identification of equipment approaching efficiency loss due to degradation.
Import utility rate structures and identify peak demand windows where electrical rates are highest. OxMaint models potential cost savings from shifting energy-intensive processes to off-peak hours. Quantifies peak shaving benefits: 15-minute load reductions often save $10,000–$50,000 monthly in demand charges.
Establish 12-month energy baseline and adjust for production volume, ambient temperature, and other external factors. OxMaint calculates normalized energy performance, removing confounding variables so true efficiency improvements are visible from process changes or equipment upgrades.
Auto-generate ISO 50001-compliant energy baseline documentation, annual performance reports, and improvement project tracking. Export ENERGY STAR application data directly from OxMaint dashboards. Eliminate manual report assembly; compliance data flows automatically from operational dashboards.
Customer Success: How Steel Mills Transformed Energy Economics with Digital Dashboards
"Energy Dashboard Revealed $3.2M in Hidden Efficiency Losses"
"We installed OxMaint's energy KPI dashboard and immediately saw that two rolling mill drive motors were consuming 18–22% more electricity than baseline, while all other equipment was on target. Vibration analysis showed worn bearings — we replaced them and recovered the efficiency loss in 6 weeks. That single finding paid for our CMMS investment three times over. Now every piece of equipment has real-time energy attribution. We identify efficiency opportunities monthly that would have been invisible on spreadsheets or monthly utility bills. We've achieved 4.8% overall energy intensity reduction and locked in $4.2 million in annual savings." — Energy Manager, Integrated North American Steel Mill (2M tons/year)
Steel Plant Energy Management: FAQ for Operations and Finance Teams
What is Specific Energy Consumption (SEC) and how do we calculate it for a steel mill?
SEC is total energy input (electrical + fuel) divided by tons of product output, expressed as MJ/ton, GJ/ton, or kWh/ton depending on process. For blast furnace operations, SEC ≈ (Coke consumption + fuel + electricity) / hot metal tons. OxMaint calculates SEC automatically from SCADA data and production rates, adjusting for raw material quality and ambient temperature effects on comparison validity.
How does thermal energy (GJ/ton) differ from electrical energy (kWh/ton) in cost impact?
Thermal energy (natural gas, coal, coke) typically costs $3–$8 per GJ; electrical energy costs $40–$80 per MWh ($0.04–$0.08/kWh). On a cost-per-ton basis, furnace thermal efficiency improvements often deliver faster ROI than electrical efficiency projects. OxMaint separates thermal and electrical KPIs, enabling optimization of each independently.
What is EnPI (Energy Performance Indicator) and why is it required for ISO 50001?
EnPI quantifies energy performance relative to a baseline, adjusted for production volume and external variables (temperature, raw material quality). ISO 50001 requires documenting baseline EnPI and demonstrating continuous improvement or year-over-year maintenance of performance. OxMaint calculates EnPI monthly, stores trends, and generates compliance documentation automatically.
How do peak demand charges factor into steel mill energy cost optimization?
Utilities charge demand rates for peak electrical consumption in 15-minute intervals; peak demand fees typically represent 30–50% of total electrical costs. A 5-megawatt peak demand reduction might save $15,000–$30,000 monthly. OxMaint models peak demand windows and quantifies savings from shifting energy-intensive processes to off-peak hours.
Can we correlate equipment maintenance with energy consumption to identify efficiency degradation?
Yes — OxMaint links energy consumption data to vibration monitoring, bearing temperature, and maintenance history. Equipment with increased energy consumption compared to baseline often signals bearing wear, motor degradation, or alignment issues. Maintenance-driven energy trends enable predictive maintenance triggering before catastrophic failure.
How does ENERGY STAR steel mill certification support energy KPI reporting?
ENERGY STAR requires baseline energy intensity (kWh/ton or equivalent), annual performance tracking, and documented improvement initiatives. OxMaint generates ENERGY STAR application data automatically: 12-month baseline, annual performance metrics, improvement project tracking, and benchmarking reports — eliminating manual data compilation.
What role does waste heat recovery play in steel mill energy optimization?
Waste heat recovery (casting coolers, blast furnace top gas, EAF off-gas) can reduce facility thermal energy consumption 2–5% by capturing and repurposing rejected heat. Energy dashboards quantify waste heat temperatures and volumes; engineering teams model recovery economics. Many projects show 2–3 year payback on recovery system capital.
How do we integrate renewable energy credits (RECs) or power purchase agreements (PPAs) into energy KPI reporting?
OxMaint tracks renewable energy generation (solar, wind on-site) or renewable power purchases separately, adjusting net energy consumption and grid carbon intensity. Some mills offset 20–40% of electrical energy through renewable PPAs; OxMaint reports both absolute consumption and net carbon intensity after renewable offsets.
Energy KPI Dashboard Template: Download and Activate Today
Our free steel plant energy KPI dashboard template gives you real-time SEC, kWh/ton, and GJ/ton calculations; equipment-level energy attribution; peak demand and cost modeling; and ISO 50001 / ENERGY STAR compliance documentation. Connect your SCADA systems, import production rates, and activate dashboards. Within 48 hours, your operations and finance teams have transparent energy performance visibility and optimization opportunities quantified in dollars. No spreadsheets. No manual calculations. No missed efficiency projects.
Get Your Free Energy KPI Dashboard Template Today
Transform energy data into actionable insights, cost reduction, and ISO 50001 compliance. OxMaint's template is free to download and customize — start monitoring energy performance across your steel plant within minutes.

.png)
-and-maintenance-budget-template.png)
-justification-template.png)