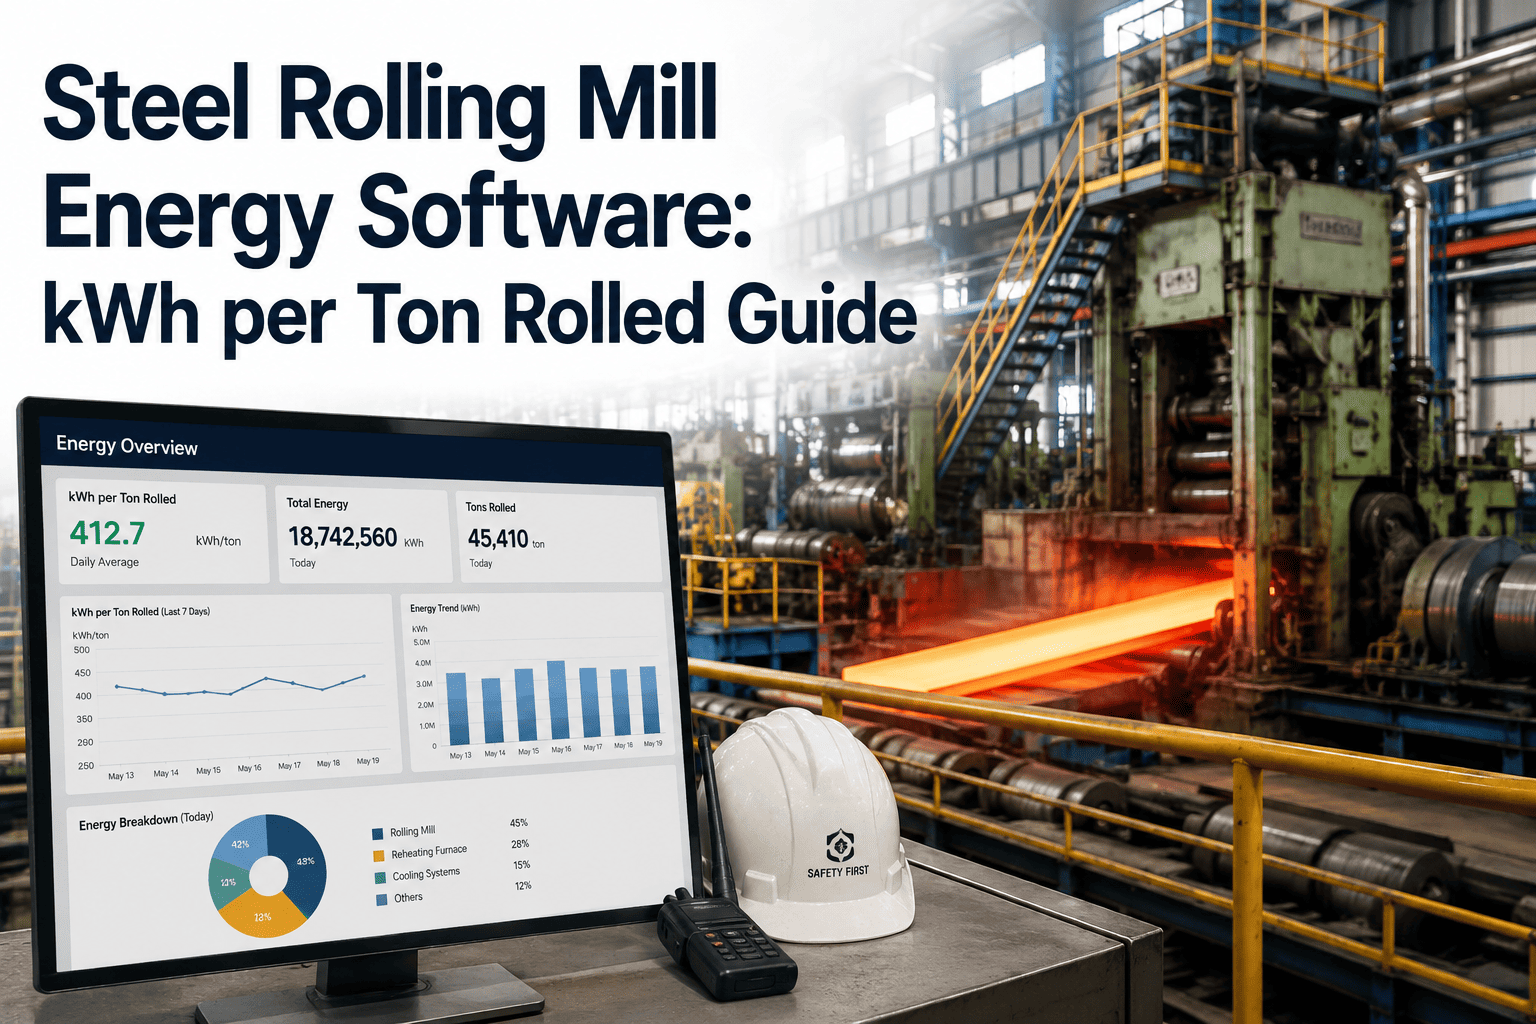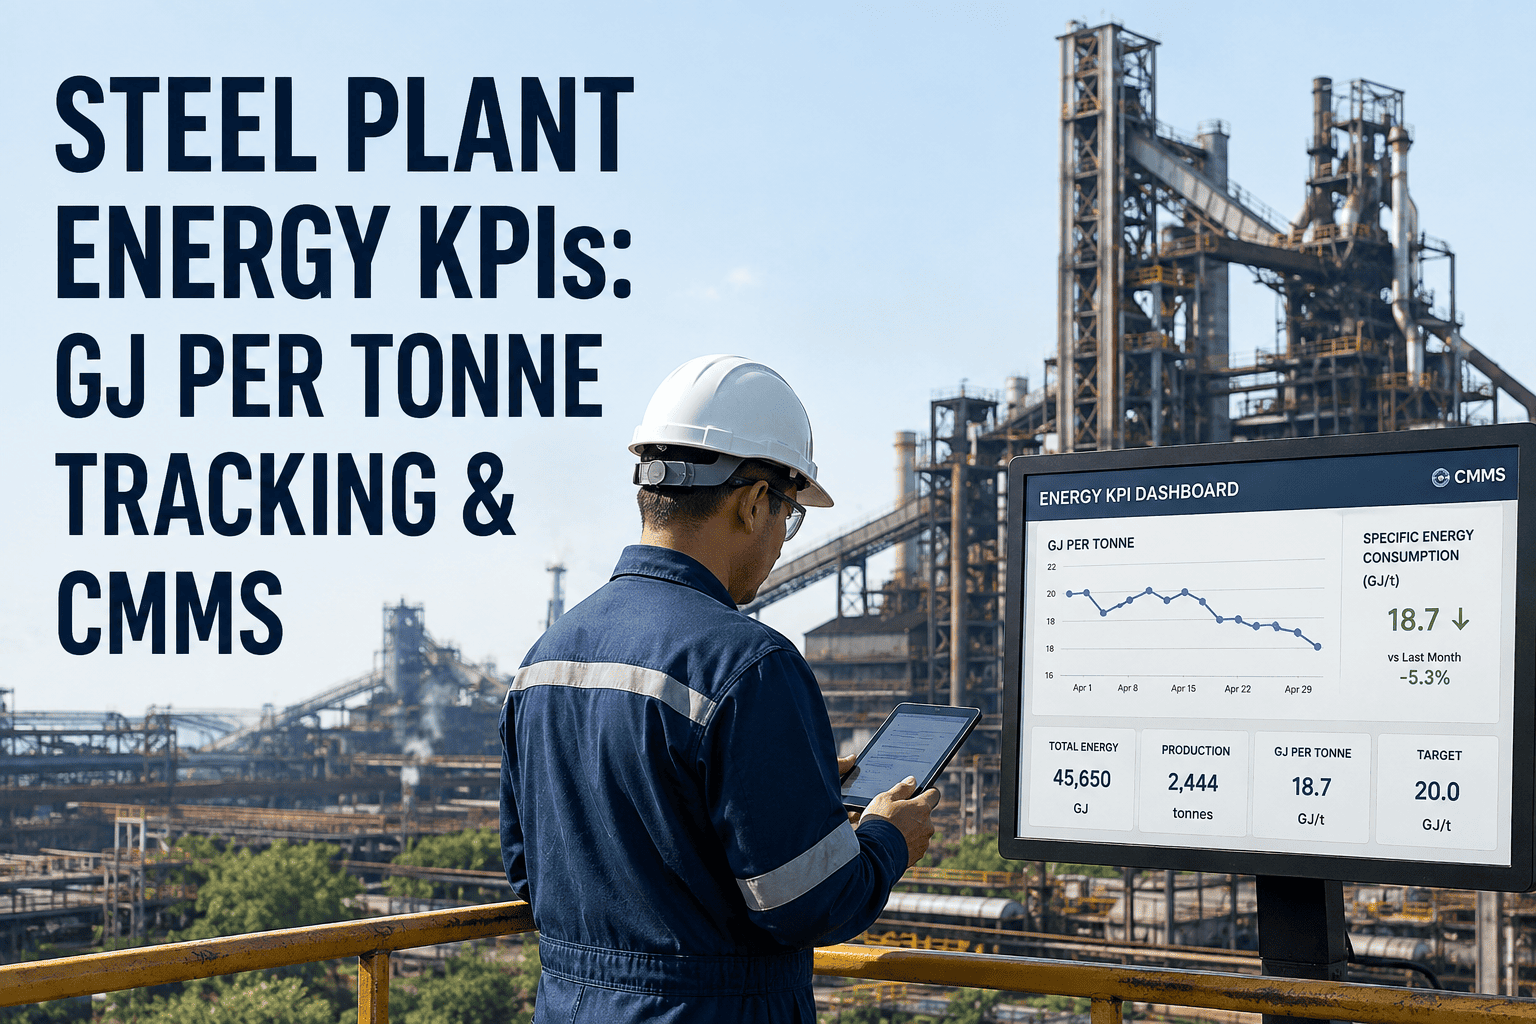
Energy is one of the largest operating costs in steelmaking, and it is also one of the easiest to misread. A plant can see its monthly electricity bill and gas totals and still not know which area, asset or shift is driving energy per tonne up. This guide explains how to build an energy per tonne dashboard that covers electricity, fuel gases, oxygen and utilities, and how to connect it to asset condition, because many energy losses start as maintenance problems. A steel plant CMMS supplies the equipment history that energy meters cannot.
Steel Plant Energy Per Tonne Dashboard Guide for Efficiency
Meter every major carrier, divide by the right tonnes, and compare each result with a baseline. When energy per tonne drifts, Oxmaint gives your team the asset history, inspections and work orders to find out why and fix it.
What Energy Per Tonne Tells You and What It Does Not
Energy per tonne divides total energy used by tonnes produced. It is a good screening metric because it reflects both process efficiency and equipment health. It is a poor diagnostic on its own, because many causes produce the same number.
Causes that sit in operations
- Product mix and grade changes
- Furnace practice and tap-to-tap time
- Charge material quality
- Production rate and campaign stage
Causes that sit in maintenance
- Worn or poorly lubricated drives drawing extra power
- Compressed air and steam leaks
- Fouled heat exchangers and degraded insulation
- Idle equipment left running
- Out-of-tune controls and failing instruments
The dashboard should help both groups. Operations needs to see the process drivers, and maintenance needs to see the equipment losses hidden inside the total.
Industry Context for Your Baseline
Published figures help you sense-check your own data, not replace it. According to worldsteel data summarized by IRENA, the blast furnace and basic oxygen route used around 24 GJ per tonne of crude steel in 2023, and the DRI-based electric arc route used about 23 GJ. Scrap-based electric arc furnace steelmaking sits far lower, and the global weighted average is roughly 21 GJ per tonne.
- These are route-level averages for crude steel. Your plant boundary, products and by-product gas accounting will differ.
- Compare against your own history by area first, then against external ranges with the same boundary.
- State the boundary on the dashboard so figures are not compared unfairly.
Define the Boundary and the Units Before Building Anything
| Carrier | Typical meter | Common unit | Note |
|---|---|---|---|
| Electricity | Substation and feeder meters | kWh or MWh | Convert to GJ when combining with fuels |
| Natural gas | Flow meter with pressure and temperature correction | Nm3 | Use a calorific value from your supplier |
| Coke oven, blast furnace and converter gas | Orifice or ultrasonic flow meters | Nm3 | Calorific value varies, so measure or sample it |
| Oxygen, nitrogen and argon | Flow meters at the plant and at users | Nm3 | Account for the electricity used to produce them |
| Compressed air | Flow meters or compressor power and output | Nm3 and kWh per Nm3 | Specific power shows compressor health |
| Steam | Flow meters with temperature and pressure | Tonnes of steam | Convert using enthalpy at conditions |
| Water | Flow meters per circuit | m3 | Pumping energy matters more than the water itself |
Decide how by-product gases and internally generated energy are counted. Whatever rule you choose, apply it the same way every period.
Dashboard Anatomy: Four Layers
Connect Energy Losses to the Work That Fixes Them
A dashboard that only shows the problem leaves the fix to chance. Oxmaint turns each energy finding into an assigned, tracked work order on the right asset.
Normalize Before You Compare
Raw energy per tonne moves with throughput, product and furnace conditions. Normalization keeps you from chasing noise or crediting luck.
Where possible, build a simple expected-consumption model for key assets and show actual against expected, not just actual against last month.
Where to Place Meters First
You do not need a meter on every motor to start. Cover the largest consumers and the boundaries between areas, then add sub-metering where the data shows a problem.
- Give every meter an asset record, a calibration schedule and an owner.
- Record meter replacements and recalibrations so step changes in data can be explained.
- Mark each meter with its area and the production measure it should be divided by.
Build a Baseline You Can Defend
Illustrative Case Flow: A Rising Compressed Air Figure
The sequence below is a hypothetical walk-through to show how the pieces connect. It does not describe a real plant result.
Who Owns Which Energy Number
| Role | Owns | Looks at |
|---|---|---|
| Energy manager | Plant boundary, baselines and reporting | Plant and area energy per tonne, carrier split |
| Operations lead | Process practice and operating modes | Normalized energy by furnace, line and shift |
| Maintenance planner | Energy-related preventive and corrective work | Open energy work orders, backlog, due dates |
| Reliability engineer | Equipment-level efficiency trends | Specific consumption, failure history, condition data |
| Instrument technician | Meter accuracy and calibration | Calibration status and data quality alerts |
A 90-Day Starting Plan
The Hidden Energy Losses Maintenance Can Remove
Specific Consumption Signals for Rotating Equipment
For compressors, fans and pumps, track energy per unit of useful output rather than total energy alone. A rising specific figure is an early signal of fouling, wear or leakage.
| Equipment | Specific measure | Rising value may indicate |
|---|---|---|
| Air compressors | kWh per Nm3 delivered | Leaks, fouled coolers, worn components, poor sequencing |
| Fans and blowers | kWh per unit of flow at pressure | Fouled impellers, damper or inlet problems, bearing wear |
| Pumps | kWh per m3 at head | Impeller wear, recirculation, blocked lines |
| Conveyor drives | kWh per tonne moved | Idler resistance, belt misalignment, empty running |
| Furnaces | Energy per tonne tapped | Practice changes, refractory or off-gas issues, extended delays |
From Energy Alert to Closed Work Order
Preventive Tasks That Protect Energy Performance
- Lubrication and alignment on high-load drives and gearboxes.
- Cleaning and inspection of heat exchangers, coolers and filters.
- Leak surveys on compressed air, steam and gas lines on a regular route.
- Steam trap and insulation checks across steam networks.
- Calibration of flow, temperature and pressure instruments that feed the dashboard.
- Inspection of refractory and heat recovery equipment at planned stops.
Schedule these as recurring work with owners and due dates, so energy performance does not rely on goodwill during busy periods.
Dashboard Mistakes to Avoid
Quick Wins for the First Month
- Run a walk-around at the end of a shift and list every machine left running without product.
- Survey compressed air and steam lines during a quiet period, when leaks are easiest to hear.
- Check that the biggest meters are in calibration and that their data reaches the dashboard.
- Compare energy per tonne for identical shifts or lines to spot unexplained gaps.
- Log each finding as a work order so progress is visible and savings can be verified later.
Reporting Energy Results Without Losing the Room
Energy reviews fail when they are a wall of charts. Keep a fixed structure so each meeting answers the same questions in the same order.
- What changed in energy per tonne since last period, by area and carrier?
- How much of the change is explained by production rate, product mix or operating mode?
- Which equipment shows rising specific consumption, and is a work order open for it?
- Which actions closed this month, and what did before-and-after readings show?
- Which meters are overdue for calibration and could be distorting the picture?
Keep a short action log with an owner and a due date for each item. Over a few months, that log becomes the best record of what actually reduced energy use in your plant.
KPIs Worth Reviewing
| KPI | Purpose |
|---|---|
| Energy per tonne by area | Primary efficiency indicator against baseline |
| Specific power of compressors, fans and pumps | Equipment health as seen through energy |
| Idle energy share | Energy used while producing nothing |
| Energy-related work orders open and closed | Whether findings turn into action |
| Verified savings per action | Which fixes actually worked |
| Meter calibration compliance | Confidence in the data behind the dashboard |
How Oxmaint Supports an Energy Per Tonne Program
Frequently Asked Questions
Make Every Tonne Use Less Energy by Fixing What Wastes It
Pair your energy dashboard with maintenance records, inspections and work orders. Oxmaint helps your team find the loss, assign the fix and confirm the result.