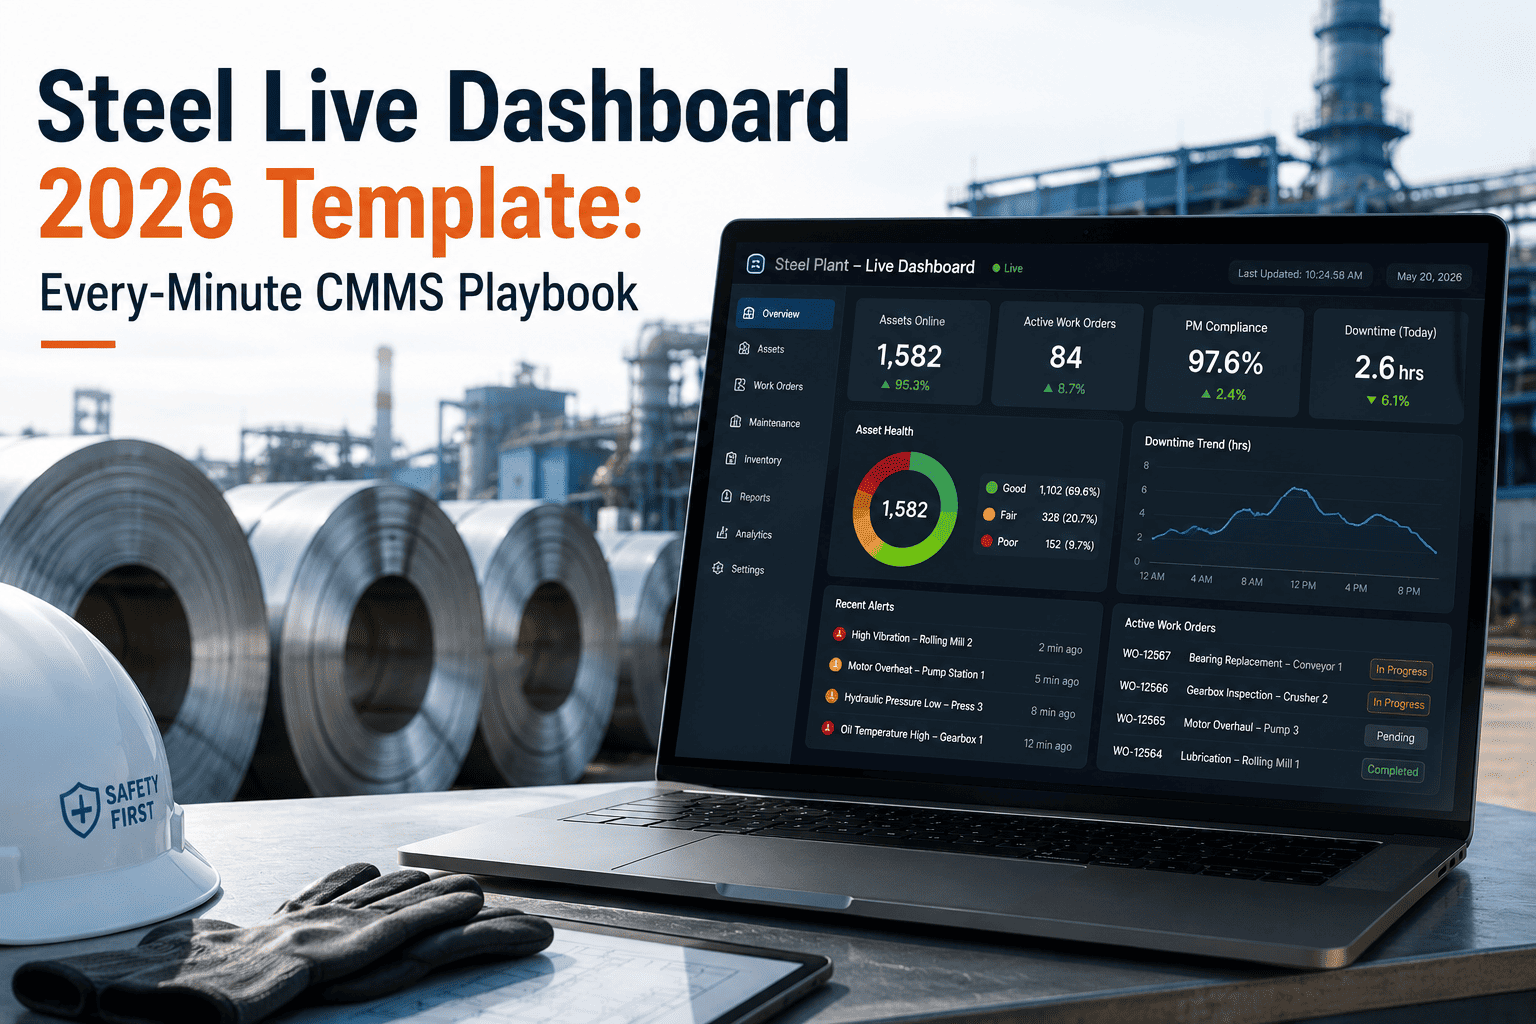
Most steel plants build a shift dashboard once, get half of it right, and never touch it again — leaving operators staring at yesterday's downtime Pareto while a caster runs 8% under target right now. A dashboard only earns its place on the plant floor when every widget refreshes in seconds, not a shift-end summary dressed up as real time. This is the literal checklist: 15 widgets across throughput, quality, and downtime, the refresh rate each one needs, and the CMMS layer that keeps every box honest, so you can tick off what your current dashboard is missing before the next shift handoff. Start a free trial with Oxmaint to deploy this template with live data from your PLCs and work order system.
Steel Live Dashboard 2026 Template: Every-Minute CMMS Playbook
A tick-box template for a steel plant shift dashboard — the 15 widgets, the data checklist to connect first, and the 90-day rollout checklist that gets it live.
What Is a Steel Live Shift Dashboard — And Why Most Plants Get It Wrong
A live shift dashboard is not a monthly OEE report on a bigger screen. It is a set of widgets that refresh from the plant's real data infrastructure — PLCs, MES, quality systems, and the CMMS — on a cadence that matches the decision each one supports. Most dashboards fail because every widget is built on the same slow cadence, so the operator-facing screen ends up as stale as the executive scorecard.
By the time a monthly report reaches a manager's inbox, the losses already happened, the root causes are buried, and the shift that caused them has rotated twice. The checklist below fixes that by tying every widget to the refresh rate it actually needs, not a single "real time" setting applied to everything.
The 15-Widget Master Checklist
Tick these off against your current dashboard build. Five widgets per category, each with the refresh rate it needs to stay useful instead of decorative.
Throughput Widgets
Running tonnage against the shift plan, updated continuously so a gap is visible while it is still forming.
Actual speed plotted against rated speed, so a creeping speed-loss event shows up before it becomes a missed target.
Cycle time segmented by grade, since a mix shift toward slower grades can look like a performance loss when it is really scheduling.
A live countdown against standard changeover time, flagging a grade or size change running long before it eats the shift.
Availability, performance, and quality multiplied into one live OEE figure per line, the number every audience recognizes.
Quality Widgets
Percentage of output clearing spec on the first pass, so a yield slip is caught while the coil is still running.
Scrap tonnage trended across the shift and week, separating a one-off rejection from a pattern that points at process drift.
Every lot currently on quality hold, with age and reason code, so held material never sits unnoticed until the audit.
Volume downgraded from prime to secondary, with the driving defect code, tying quality loss to a dollar figure.
Live alerts the moment a chemistry or dimensional reading drifts outside tolerance, before the heat is locked in.
Downtime and Maintenance Widgets
The active stoppage, its reason code, and elapsed time, visible to the shift the instant the line status changes.
Downtime causes ranked by minutes lost this shift, so the handoff conversation starts from the biggest loss, not the newest.
A running count of stops under five minutes, the category typically hiding 3-5 OEE points that never make a shift report.
Rolling reliability figures per critical asset, flagging equipment trending toward failure before it takes the line down.
Every open work order ranked by priority and asset criticality, so maintenance and production read the same backlog.
Stop Building Dashboards From Spreadsheets — Connect the Data Once
Oxmaint feeds all 15 widgets from a single CMMS and telematics layer, so the throughput screen, quality screen, and maintenance backlog all read from the same live source of truth.
Data Readiness Checklist — Confirm Before You Build
The 15 widgets are only as live as the data feeding them. Confirm these five sources are connected before wiring up a single screen.
90-Day Rollout Checklist
Stage the rollout instead of launching all 15 widgets on day one. Most plants see better adoption connecting data first and tuning thresholds last.
Rearview Mirror vs Windshield: What Changes With Live Widgets
How Oxmaint's CMMS Powers Every Widget on the Checklist
Every work order created, assigned, and closed feeds the downtime and maintenance widgets in real time, replacing the end-of-shift paper log.
Preventive maintenance triggers off actual runtime hours from telematics rather than a calendar date, so PM compliance reflects real asset use.
Technicians log time, parts, and findings on mobile at the point of work, improving MTBF and MTTR accuracy by roughly 60% over shift-end memory logs.
MTBF and MTTR calculate automatically from work order timestamps, closing the gap for the 65% of plants still tracking reliability in a spreadsheet.
Assets are ranked by criticality, so the open work order widget always shows the highest-risk job first, not just the oldest ticket.
The same 15-widget checklist rolls up across every line and site, letting plant managers compare OEE, downtime, and reliability side by side.
What Plants See After Working Through This Checklist
Frequently Asked Questions
How many widgets should be visible on one screen at a time?
None of the tiers should show all 15 at once. Operators see the five throughput widgets and current downtime, supervisors see the Pareto and quality widgets. Book a demo to see the tiered layout.
What refresh rate counts as "real time" on this checklist?
Operator-facing widgets like line speed and downtime status should update in 10-30 seconds. Supervisor widgets like the Pareto or hold queue can refresh every 5-15 minutes without losing usefulness.
Does this checklist require replacing our existing MES or historian?
No. It pulls from your existing PLC tags, historian, and quality system alongside CMMS work order data, so the infrastructure you already run stays in place.
How does the CMMS connect to the downtime and reliability widgets?
Work orders, reason codes, and timestamps flow into the downtime Pareto, MTBF, and MTTR widgets the moment a technician closes a job on mobile. Start a free trial to connect your own asset hierarchy.
Can this checklist scale across multiple mills or sites?
Yes. The same 15-widget structure rolls up across lines and sites, giving plant managers a consistent view for cross-site OEE and reliability benchmarking.
Turn This Checklist Into a Live Dashboard on Your Floor
Oxmaint connects your PLCs, historian, and work order data into the 15-widget checklist above, refreshed on the cadence each widget actually needs. Free trial, no credit card required.