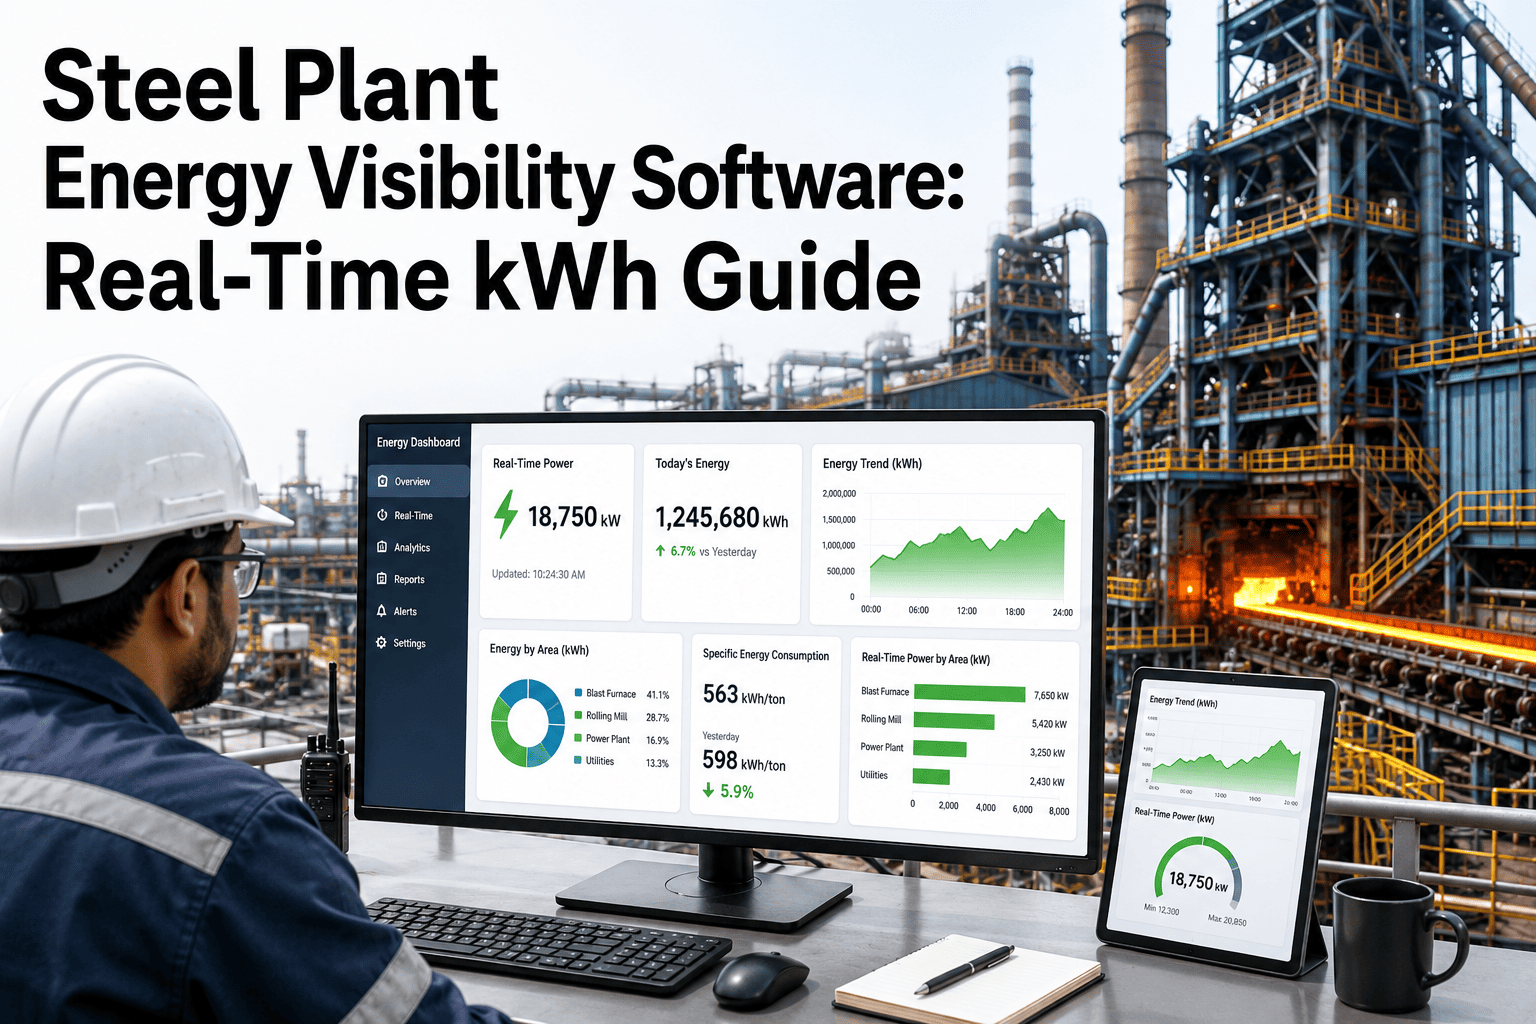
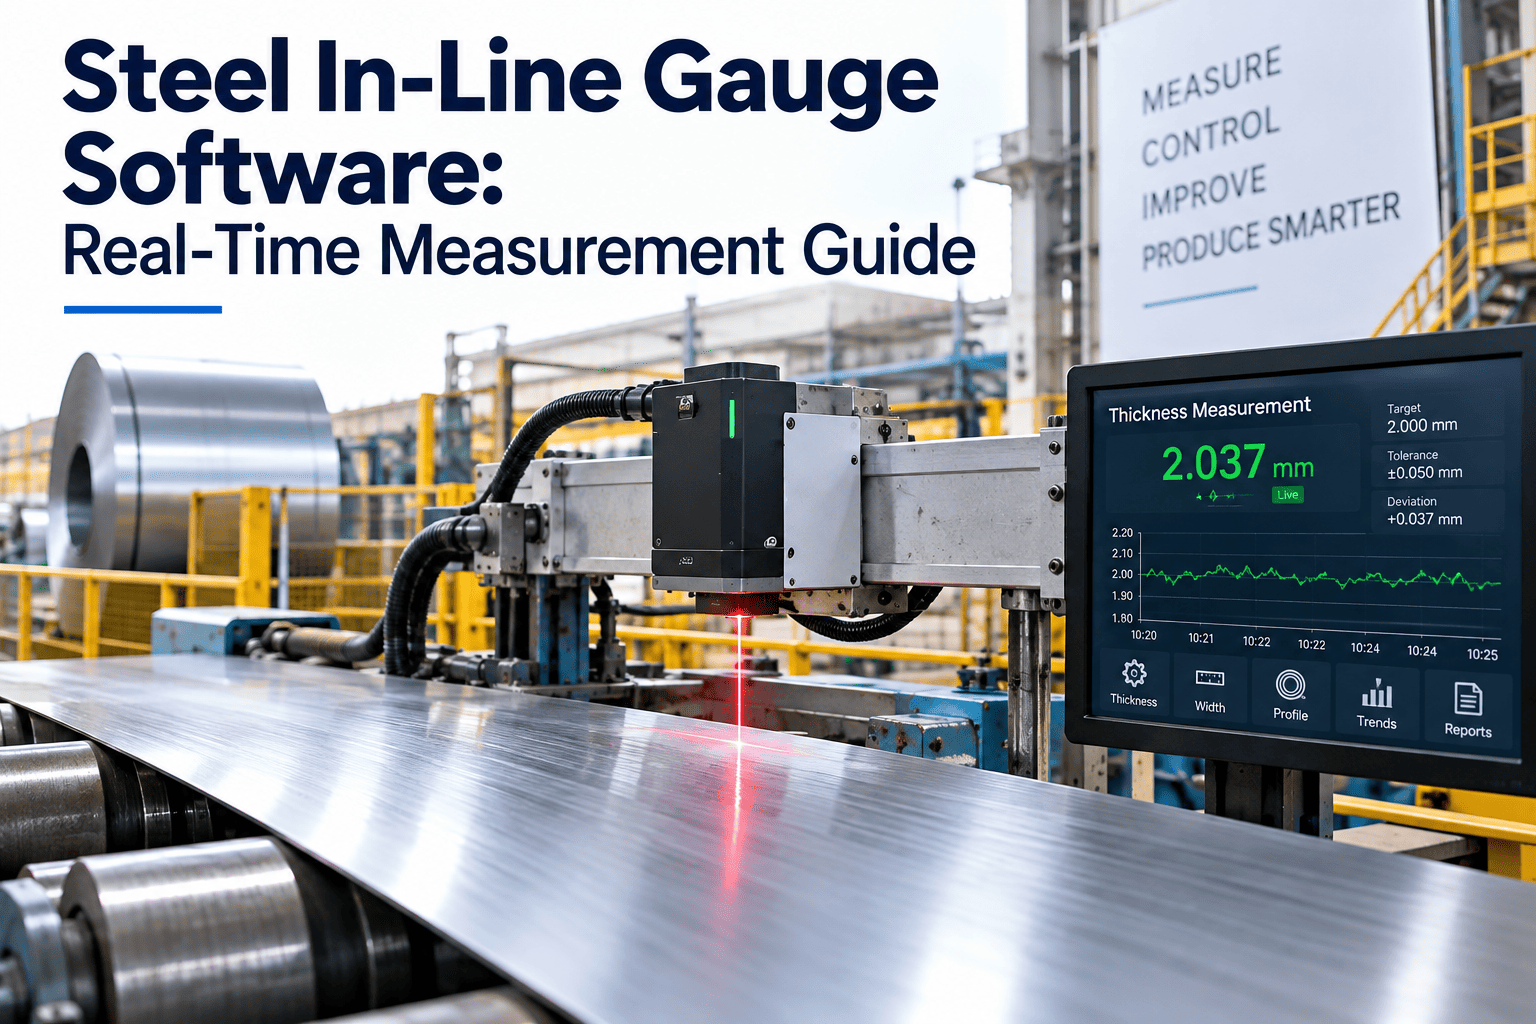
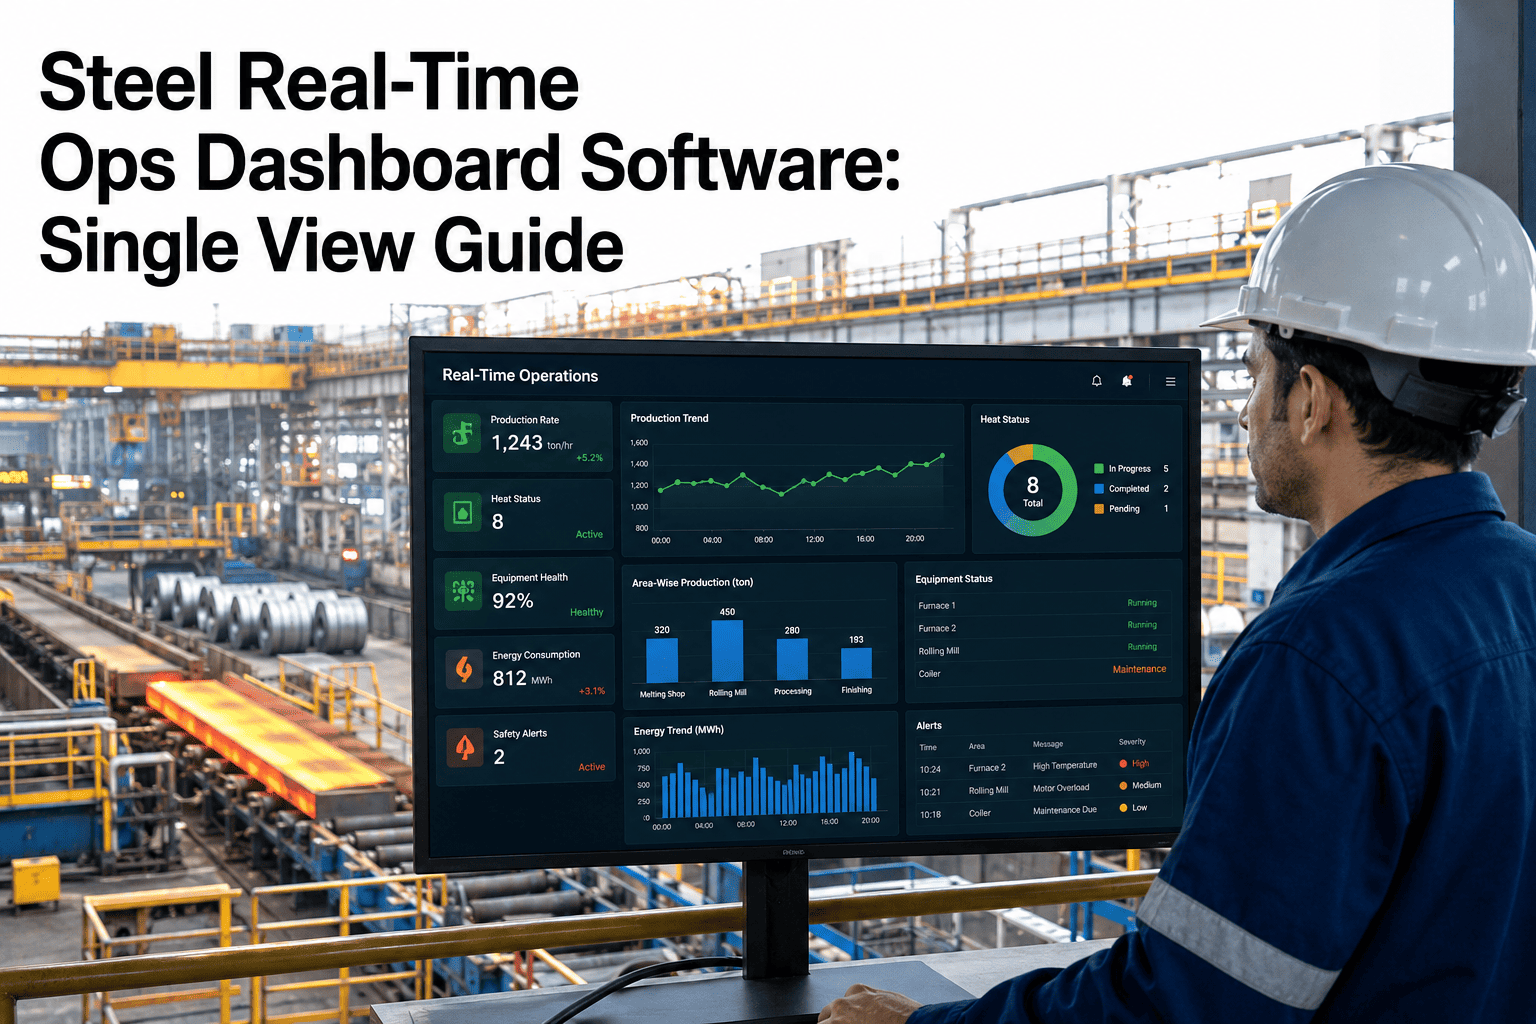
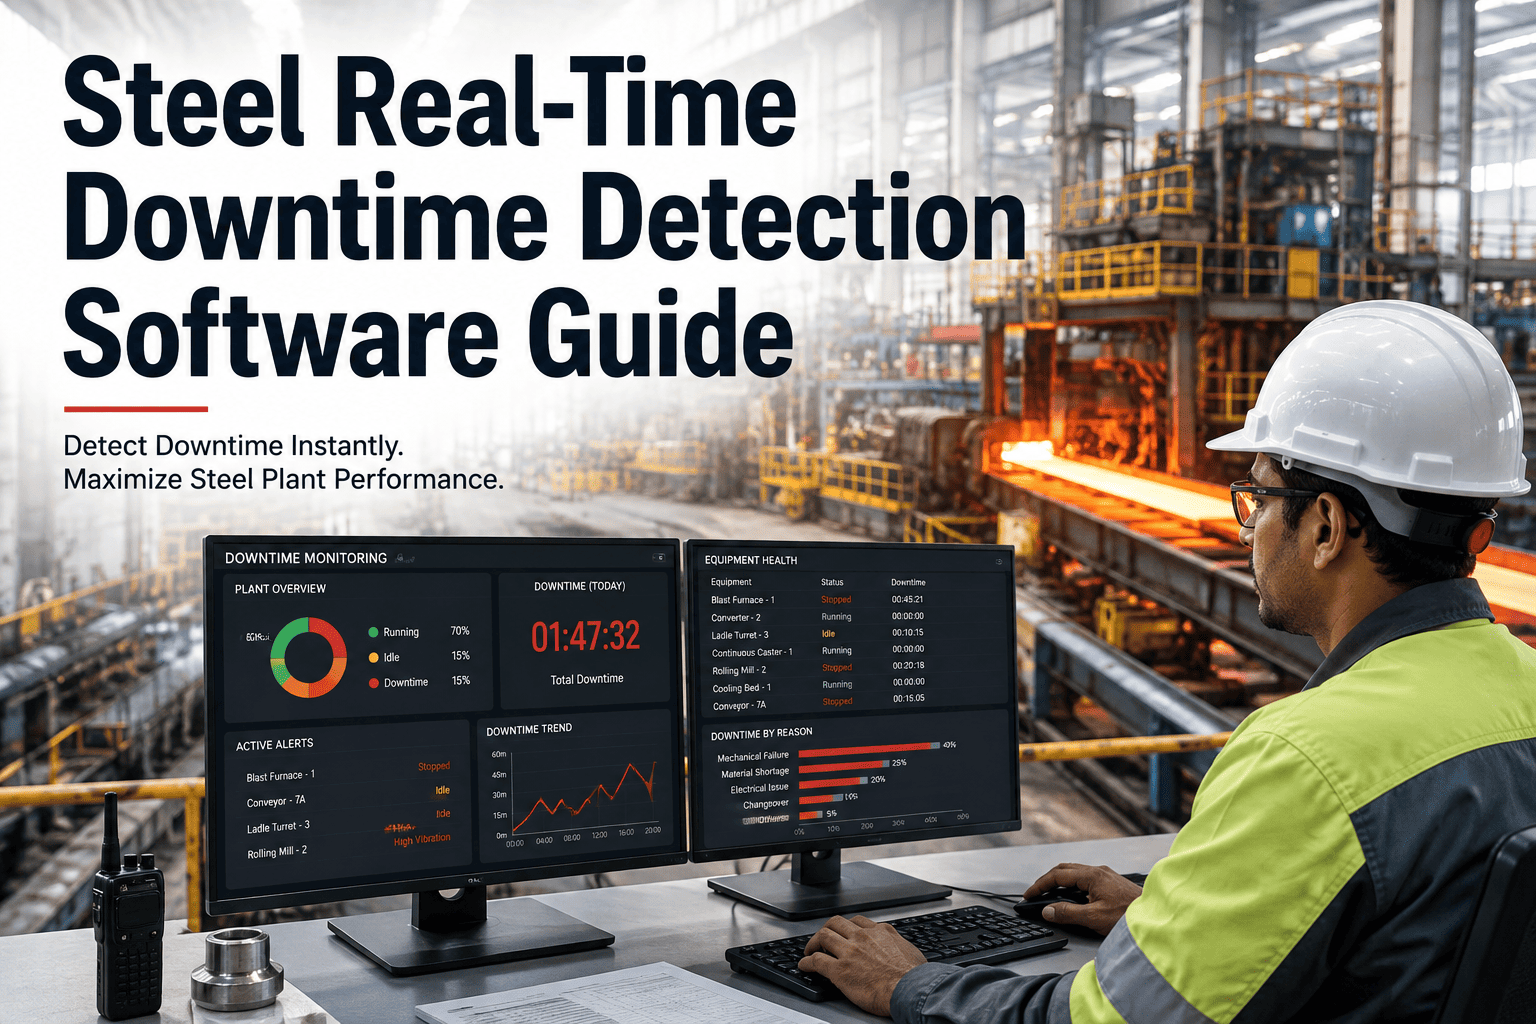
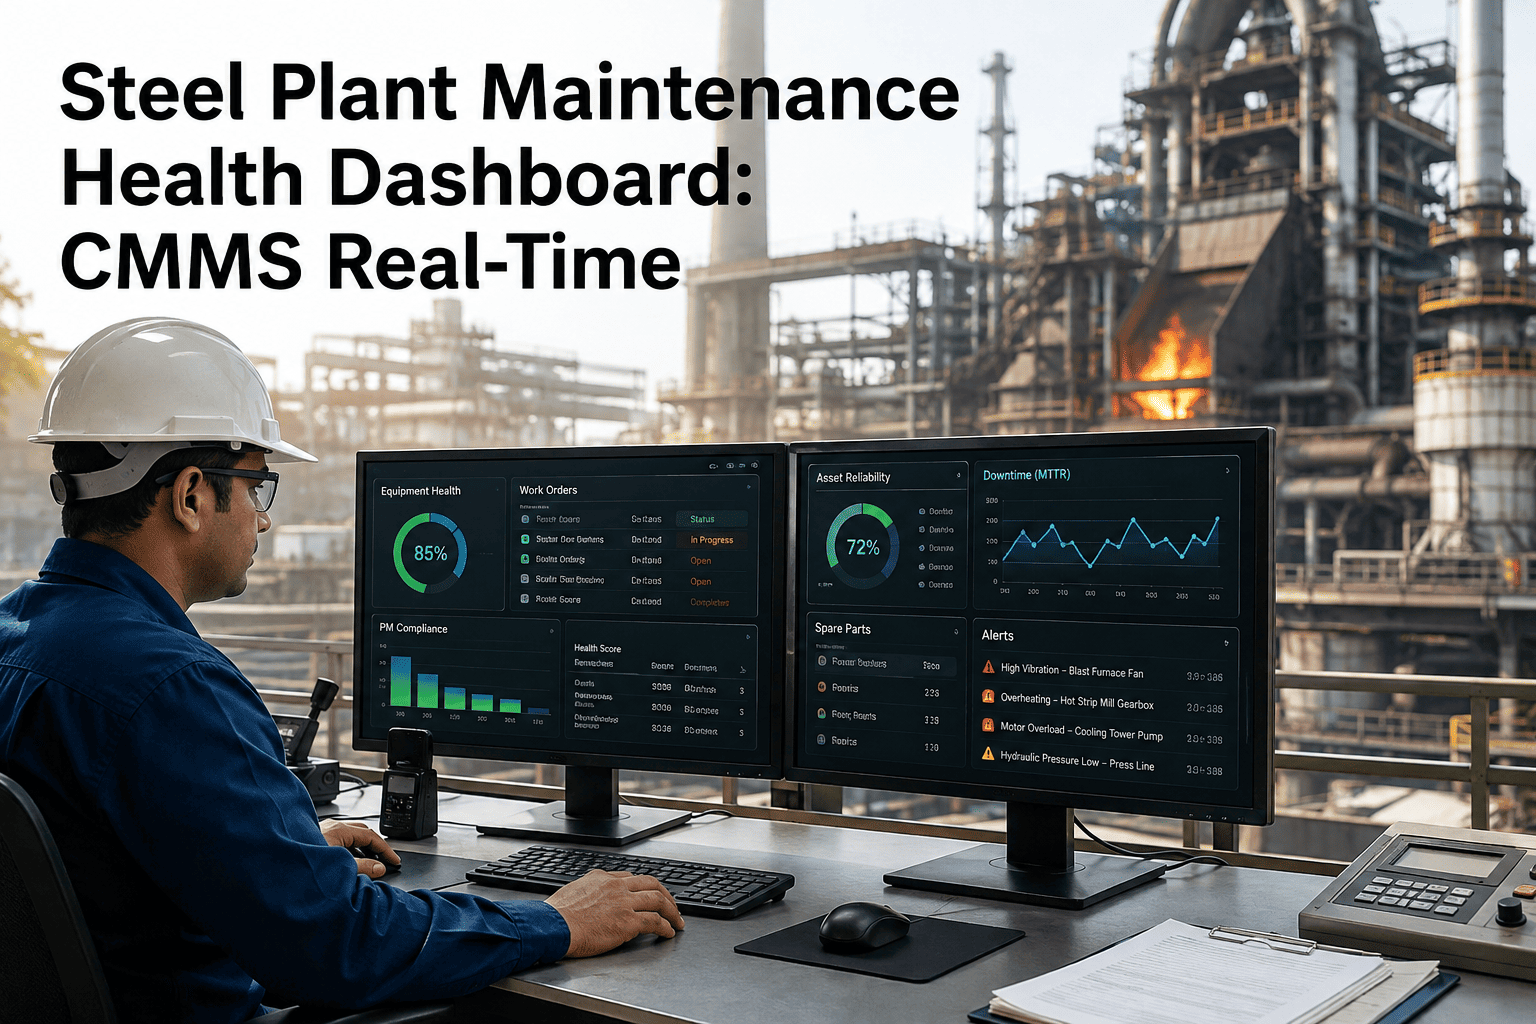
Most steel plants know their monthly electricity bill down to the last rupee, yet almost none can say how many kilowatt-hours a single reheating furnace consumed on the night shift, or how much power a rolling mill drive pulled during a delayed restart. Energy visibility is not the same thing as energy metering — a plant can own dozens of meters and still have no equipment-level, process-level, or shift-level breakdown that anyone can actually act on. Electric arc furnaces alone can draw 400 to 600 kWh per tonne of liquid steel, and a small drift in power factor, tap-changer setting, or scrap mix can move that number without a single alarm firing. The plants that control energy cost are the ones that treat kWh as a live operating signal, not a line on next month's invoice. Book a 30-minute demo to see how Oxmaint turns raw meter data into real-time kWh visibility across every piece of equipment, process, and shift on your floor.
Energy Visibility · CMMS · Real-Time kWh
Steel Plant Energy Visibility Software: Real-Time kWh Guide
A practical breakdown of where steel plant energy actually goes, why visibility collapses between the meter and the maintenance floor, and the CMMS-connected monitoring layers that turn kWh from a cost surprise into a controllable, trendable number.
400-600
kWh consumed per tonne of liquid steel in a typical electric arc furnace
20-30%
Of steel plant electricity cost tied to processes with no equipment-level metering
3-4 wks
Typical delay between an energy spike and it appearing on a cost report
2-8%
Energy cost reduction achievable once shift-level kWh visibility is established
Where the Kilowatt-Hours Actually Go — Process by Process
A steel plant's power bill is not one number — it is four or five very different consumption profiles stacked together. Treating them as a single figure is the first reason visibility breaks down, because each process needs its own baseline, its own alert threshold, and its own owner.
Electric Arc Furnace
The single largest and most volatile load in the plant. Power draw swings by shift, scrap mix, and tap-changer position, making per-heat kWh the only meaningful comparison unit.
Reheating Furnace
Fuel-heavy but with a significant electrical load on burners, blowers, and recuperator fans. Refractory condition and burner tuning both show up as a slow upward drift in kWh per tonne.
Hot Rolling Mill
Drive motors, hydraulics, and roll cooling pumps create a load profile that should track tonnage almost linearly. When it doesn't, it usually means bearing drag, misalignment, or a control loop hunting.
Utilities and Air Systems
Compressed air, water treatment, and ventilation run continuously regardless of production rate, making them the easiest place to lose kWh to leaks and oversized equipment without anyone noticing.
Five Points Where Energy Visibility Breaks Down
Every plant collects some energy data. Very few plants get that data to the person who can act on it, in time to act on it. These are the five gaps that separate a plant with meters from a plant with visibility.
01
Meter Coverage
Metering stops at the substation, not the equipment
Most plants meter incoming feeders and major transformers but stop short of individual furnaces, mills, and pump stations. Without equipment-level metering, a spike can only ever be traced to a department, never to the asset causing it.
02
Time Resolution
Monthly billing data hides shift-level cause
A billing-cycle kWh number cannot tell you whether the overrun happened on the night shift, during a specific heat, or across an entire week. Shift-level and heat-level resolution is what turns a cost report into a maintenance lead.
03
System Silos
Energy data lives in one system, work orders in another
When the energy management system and the CMMS do not talk to each other, an abnormal kWh trend never becomes a work order — it becomes an email that gets read after the shift has already ended.
04
Baseline Absence
No per-asset baseline means no way to spot drift
A kWh reading is only useful next to its own history. Without a stored baseline per motor, pump, or furnace, every reading is judged against a guess instead of the asset's actual normal operating range.
05
Alert Threshold
No automatic threshold means someone has to notice manually
Even with good data, if nothing generates a work order automatically when kWh per tonne drifts past a defined band, the visibility stops being predictive and goes back to being a report nobody has time to read.
Connect Real-Time kWh Data to Maintenance Work Orders in One Platform
Oxmaint pulls meter and sensor data down to the equipment level, builds a rolling baseline per asset, and raises a work order automatically the moment kWh per tonne or kWh per hour drifts outside its normal band — before the number reaches the monthly invoice.
Energy Monitoring Checklist — Frequency by System
A working energy visibility programme is built from small, repeatable checks tied to a clear owner and a clear trigger. The table below sets a practical minimum starting cadence for the major systems in a typical steel plant.
| System |
Monitoring Interval |
Who Owns It |
Oxmaint Trigger |
| Electric arc furnace power draw |
Per heat |
Process engineer |
Per-heat kWh deviation alert |
| Reheating furnace burner and fan load |
Continuous, trend daily |
Maintenance tech |
Daily trend log + threshold alert |
| Rolling mill drive motor current |
Continuous, trend weekly |
Maintenance engineer |
Weekly work order on drift |
| Compressed air system baseline load |
Weekly |
Utilities tech |
Weekly leak-load alert |
| Shift-level kWh per tonne summary |
Per shift |
Shift supervisor |
Shift-end deviation report |
| Sub-meter calibration check |
Quarterly |
Instrument tech |
Quarterly calibration work order |
The Four Layers of Real-Time Energy Visibility
Energy visibility is not a single dashboard — it is a stack of capability that gets built one layer at a time. Plants that skip a layer end up with data they cannot act on.
L1
Equipment-level metering
Sub-meters or current transformers placed on individual furnaces, mills, and pump stations, rather than relying only on the incoming feeder reading.
L2
Per-asset baselines
Historical kWh data stored against each asset so that today's reading is judged against that machine's own normal range, not an industry average.
L3
Automated threshold alerting
A defined deviation band per asset that raises a work order the moment kWh per tonne or kWh per hour drifts outside it, without waiting for a human to notice.
L4
Closed-loop feedback into maintenance
Every energy-triggered work order gets closed with a finding, and that finding refines the baseline — so the alert threshold gets more accurate every month the system runs.
Steel plants that get energy cost under control are rarely the ones with the newest equipment — they are the ones where a kWh spike triggers a work order the same shift it happens, not a line item on next month's report. Once maintenance owns energy drift the same way it owns vibration or temperature, the number stops surprising anyone.
Priya Nair
Energy and Reliability Consultant, Integrated Steel Operations
Frequently Asked Questions
What is energy visibility in a steel plant, exactly?
Energy visibility means seeing kWh consumption at the equipment, process, and shift level in near real time, not just as a monthly bill. It turns power draw into a signal maintenance and operations can act on.
Start a free trial to see it applied to your own assets.
How is energy visibility different from having smart meters?
Smart meters collect data; visibility means that data is broken down per asset, compared against a baseline, and connected to an alert that reaches the right person. Meters alone rarely achieve any of those three things on their own.
Which steel plant processes benefit most from real-time kWh monitoring?
Electric arc furnaces and rolling mill drives show the fastest payback because their loads are large and volatile, but reheating furnaces and utility systems often hide the most preventable waste over time.
Can energy monitoring data trigger maintenance work orders automatically?
Yes — once kWh data is tied to an asset baseline, a defined deviation threshold can raise a work order the same way a vibration or temperature alert would.
Book a demo to see the trigger logic configured for your equipment.
How long does it take to see energy cost reduction after implementation?
Most plants see their first actionable deviation alert within the first few weeks of equipment-level metering going live, with measurable cost reduction typically building over two to three months as baselines mature.
Stop Waiting for the Invoice to Find Out Where Your Energy Went
Oxmaint connects equipment-level kWh data to your CMMS, builds a rolling baseline per asset, and raises a work order the moment consumption drifts — turning energy visibility into a daily maintenance habit instead of a monthly surprise.