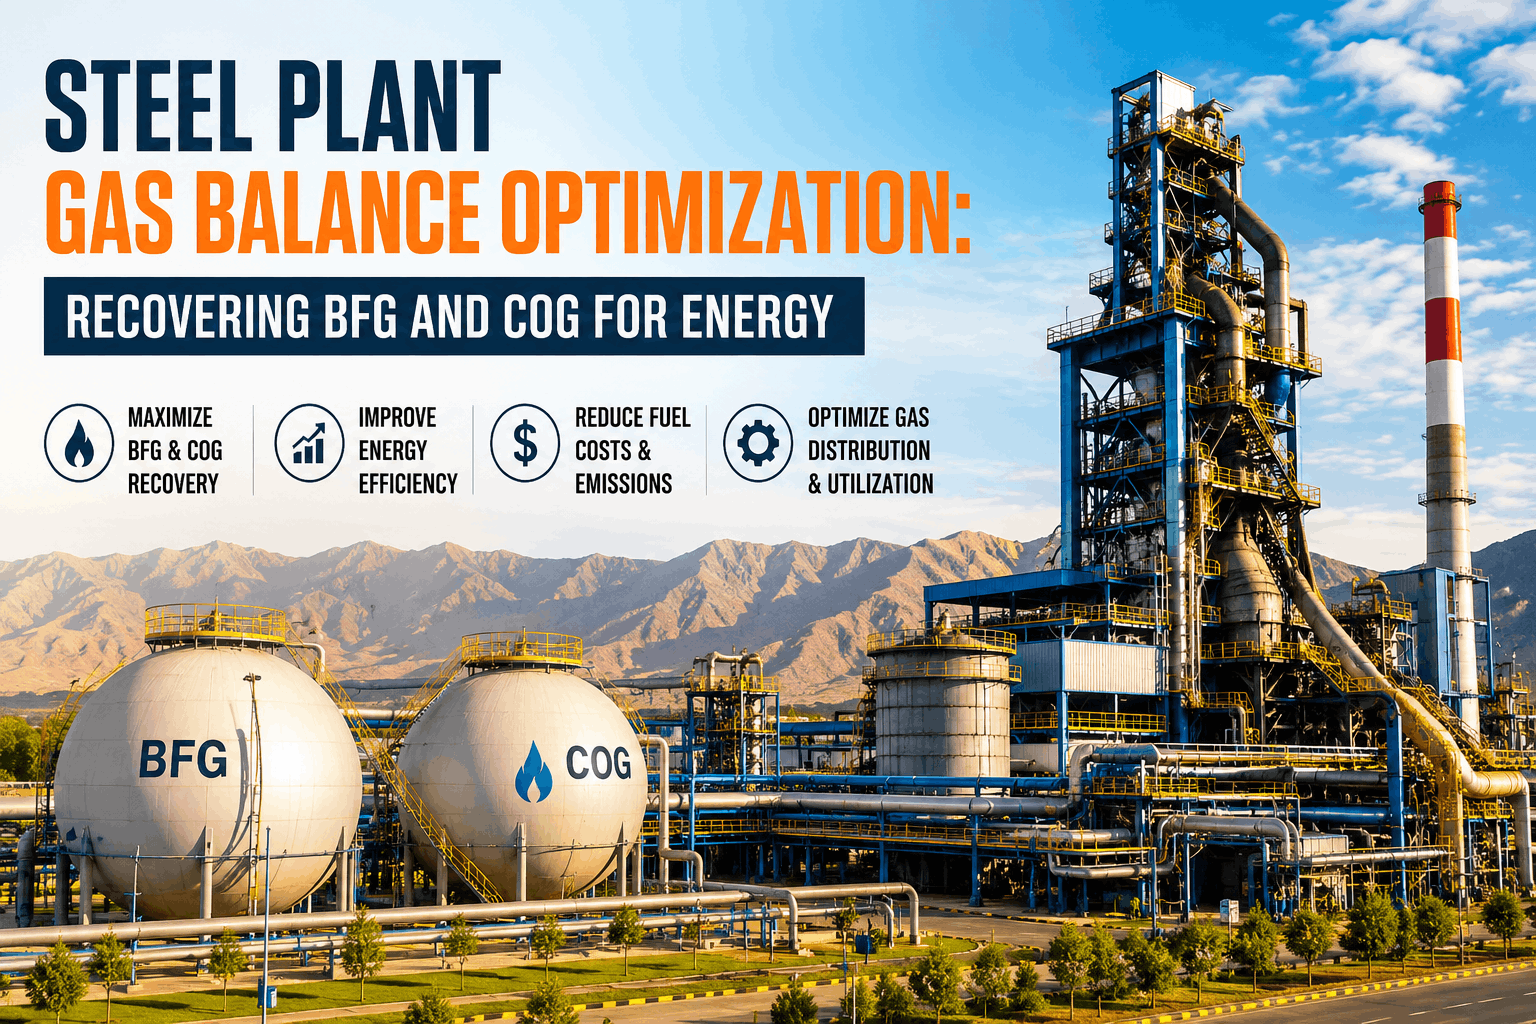
A steel plant flaring 4% of its BFG production destroys ₹8–12 crore of fuel value annually — while its energy manager reports stable coal consumption. The gas is gone before anyone looks for it. Real-time gas balance monitoring converts that invisible loss into a managed parameter with daily action thresholds. OxMaint's gas analytics dashboard makes this visible within 48 hours — start free.
Gas Balance + Energy Analytics
Steel Plant · Medium Priority
Steel Plant Gas Balance Optimisation: BFG, COG & LDG Energy Management
Covering BFG, COG, and LDG network management, gas holder operations, flare reduction strategies, calorific value optimisation, and real-time monitoring — tracked through OxMaint's AI energy analytics platform.
3–6%Energy lost to unmonitored gas flaring in a typical plant
40–60%Plant energy needs coverable by full gas recovery
30 minAI lead time to predict holder imbalance before flaring starts
<2%BFG flaring target achievable with real-time holder management
95%+COG recovery rate target with proper by-product plant monitoring
Gas Types
Three Process Gases, One Shared Network, One Energy Equation
An integrated steel plant is simultaneously a steel producer and a fuel producer. BFG, COG, and LDG have a combined calorific value large enough to cover 40–60% of total plant energy demand if fully recovered. The gap between what most plants actually recover and what is theoretically available is the primary energy saving opportunity — requiring no new equipment, only measurement, prediction, and scheduling discipline.
01
Blast Furnace Gas
BFG · 800–950 kcal/Nm³
Generation rate4–5 Nm³/Nm³ blast
CO content22–28%
Primary useStoves, boilers, TRT
Flaring target<2% of generation
02
Coke Oven Gas
COG · 4,000–4,500 kcal/Nm³
Generation rate320–360 Nm³/t coke
H₂ content55–60%
Primary useReheating furnaces
Recovery target>95% of generation
03
LD Converter Gas
LDG · 1,800–2,200 kcal/Nm³
Generation rate60–80 Nm³/t steel
CO content60–70%
Blow duration16–20 min/heat
Recovery target>90% of generation
Gas Balance
Where Gas Is Lost — and Why Most Plants Cannot See It
The gas balance is simple in theory: generation must equal consumption plus holder level change plus flaring. In practice, most plants cannot close this balance within ±5% because generation is unmetered at individual sources, consumption is aggregated at the header, holder level is read manually once per shift, and flaring is the residual that makes the equation balance on paper while hiding real losses.
Energy Loss Distribution — Integrated Steel Plant
BFG holder overflow flaring
2–4%
Predictable 30–60 min ahead
LDG emergency flaring
1–2%
Blow schedule vs holder level mismatch — schedulable
COG under-recovery
0.5–1%
By-product plant degradation — detectable weekly
Unaccounted / meter gaps
0.5%
Meter drift — detectable via daily balance reconciliation
| Loss Category | Typical Magnitude | Detection Method | Prevention Action | Lead Time |
| BFG holder overflow |
2–4% generation |
Holder level AI projection |
Dispatch standby consumer |
30–60 min |
| LDG blow mismatch |
1–2% generation |
Blow schedule vs holder level |
Pre-charge standby boiler before blow |
15–30 min |
| COG scrubber degradation |
0.5–1.5% |
Yield vs theoretical — weekly trend |
NH₃ scrubber inspection |
Weekly trend |
| Mixed gas CV drop |
+4–8% fuel cost |
Online CV analyser at mixing station |
AI blend ratio adjustment |
5 min |
Flare Reduction
Eliminating Unplanned Flaring: A Four-Layer Approach
Flare reduction to below 2% of generation requires four concurrent elements. Plants that implement only one or two see initial improvement followed by regression when operating conditions change. OxMaint manages all four layers with automated scheduling, real-time alerts, and monthly loss quantification in ₹.
01
Predict — AI holder level forecast 30–60 min ahead
Using current generation rate, scheduled production, and holder level, OxMaint projects holder level 30–60 minutes ahead and identifies the earliest point at which a standby consumer must be activated. This gives control room operators time to act without emergency response — eliminating the largest source of flaring in most plants.
5-min forecast cycle — standby consumer recommendation when projected holder >82%
02
Dispatch — ranked standby consumer list with response time
OxMaint maintains a ranked standby consumer list for each gas — ordered by CV suitability, response time, and production impact — and generates an activation recommendation with the forecast. Monthly verification confirms each named consumer can activate within 10 minutes of notification.
Monthly: standby consumer readiness test — each named consumer verified within 10 min
03
Schedule — LDG blow timing integrated with holder level
Scheduling converter blows when the LDG holder has sufficient empty volume eliminates the majority of LDG flaring. OxMaint overlays holder level projection on the steelmaking schedule so shift managers see the LDG impact of each planned heat start before committing to it.
Pre-shift: steelmaking schedule reviewed against LDG holder projection at every shift handover
04
Account — every flaring event logged, classified, and costed in ₹
Every flaring event above 500 Nm³ is auto-logged with timestamp, volume, GJ loss, and root cause classification. Monthly flare loss by root cause category reveals where prevention investment is most needed. Without this logging, flare reduction is impossible to sustain — the causes remain invisible and repeat.
Per event: auto-log from flare stack meter — root cause classification required before event closure
Monitoring Schedule
Gas Network Monitoring: Right Parameter, Right Frequency, Right Action
Monitoring frequency must match the speed at which each loss develops. BFG holder overflow develops in 20–30 minutes — a 15-minute check interval is insufficient. COG scrubber degradation develops over weeks — daily monitoring is adequate. OxMaint auto-schedules every task below and links overdue tasks to the flaring loss tracker.
RTReal-Time Critical Monitoring5-min cycle
Real-timeCritical
Gas holder levels — BFG, COG, LDG with 45-min AI projection
Continuous monitoring from dual redundant transmitters. Alert at projected 82% (activation window) and 90% (emergency action). Transmitter disagreement above 5% triggers an immediate calibration task. Projection vs actual divergence above 8% triggers a generation model review — the AI forecast is only as reliable as the generation inputs feeding it.
Real-timeCritical
Flare stack flow — all gas types, volume and duration auto-logged
Any flow above zero triggers a logged event in OxMaint within 2 minutes. Shift manager receives alert and must classify root cause before event closure. Monthly flare volume by gas and root cause is the primary KPI for gas balance performance — target below 2% of generation per gas per month.
Real-timeHigh
Calorific value — online analyser at BFG and COG holder outlets
4-hour rolling average as baseline. Alert when current reading deviates more than 40 kcal/Nm³. Mixed gas blend ratio at reheating furnace mixing station is AI-updated every 5 minutes to maintain target CV regardless of individual gas variation. BFG CV drop indicates burden change; COG CV drop indicates by-product plant efficiency loss.
DAILYDaily and Weekly ChecksShift end + Weekly PM
DailyCritical
Gas balance reconciliation — generation vs consumption vs holder vs flare
Day-end mass balance per gas. Variance above 2% triggers a meter audit task. Variance above 5% requires same-day investigation — at this magnitude the variance represents a real and large energy loss from an unmetered source or a meter failure. This daily closure discipline is what separates plants with managed gas balance from those discovering losses at year-end audit.
WeeklyCritical
Gas holder seal inspection — oil level, water seal, guide wheels
BFG piston holders: seal oil pressure and guide wheel contact. COG water-sealed holders: annular water seal level and external corrosion at waterline. LDG holders: guide wheel wear and piston levelness. Effective working volume — the buffer between low-level alarm and flare setpoint — is tracked monthly. Every 5% of effective volume lost to seal degradation directly increases flaring frequency.
MonthlyHigh
Flow meter and level transmitter calibration verification
All gas flow meters verified within ±2% of calibrated value; all holder level transmitters within ±1% of full scale. Calibration drift above these limits makes the daily balance reconciliation impossible to close and the AI projection unreliable. Instruments failing verification are replaced before the next shift — not at the next planned outage.
OxMaint Platform
OxMaint Gas Analytics: Purpose-Built for Steel Plant Gas Balance
Sign up free and have your gas balance dashboard, holder projections, and flaring loss tracker live within 48 hours. Connects to your SCADA historian or manual shift data entry — no hardware, no IT project required.
Gas Balance AI
Real-Time Holder Level Projection
5-minute holder level projection for BFG, COG, and LDG using current generation rate and scheduled consumer loads. Standby consumer activation recommendation sent when projected level exceeds 82% within 45-minute window. All projections logged and divergence vs actual tracked as model accuracy KPI.
5-min cycleAI projectionConsumer dispatch
Flare Tracker
Flaring Event Log and ₹ Loss Quantification
Every flaring event auto-logged from flare stack flow meter with volume, duration, CV, and GJ loss. Monthly flare loss report by gas type, root cause, and shift. Year-to-date flare loss in ₹ shown on energy manager dashboard at all times.
Auto-log₹ lossRoot cause
CV Analytics
Calorific Value Trend and Blend Optimisation
Online CV analyser readings logged per gas with 4-hour rolling average baseline. Mixed gas blend ratio at reheating furnace mixing station AI-updated every 5 minutes to maintain target CV. Weekly CV trend report identifies multi-day drift patterns before they affect furnace performance.
CV trendBlend AIFurnace-linked
Balance Check
Daily Mass Balance Reconciliation
Automated daily gas balance per gas type. Variance above 2% creates a meter audit task; above 5% creates a same-day investigation task. 30-day variance trend identifies systematic meter drift before it accumulates into a large unaccounted loss.
Per-gas dailyMeter auditVariance trend
Holder PM
Gas Holder Maintenance and Volume Tracking
Weekly holder inspection tasks auto-scheduled per holder type. Effective working volume tracked monthly — volume losses from seal degradation quantified in GJ/month of additional flaring risk, making the maintenance case visible to management before the annual budget cycle.
Weekly PMVolume KPISeal condition
Mobile
Offline-Ready Gas Network Field Rounds
Holder seal inspection, flare stack visual check, CV analyser sample port verification — completed on smartphone. Offline for network-dead areas around gas holders and converter platforms. Numeric readings validated against threshold on entry with photo capture for abnormal findings.
iOS + AndroidOfflinePhoto capture
FAQ
Gas Balance Optimisation: Key Questions
What is a realistic BFG flaring reduction target and how long does it take?
A plant starting from 4–6% BFG flaring can typically reach below 2% within 6–9 months. The first 2–3% reduction comes within 3 months from prediction and consumer activation discipline alone. The remaining 1–2% requires the full four-layer approach — prediction, consumer flexibility, production scheduling, and flaring accountability. The financial return from reducing flaring from 5% to 2% in a 3 MT/year plant is typically ₹6–12 crore annually at current substitute fuel cost, with zero capital investment required.
How does the AI holder level projection work and what data does it need?
The projection uses three inputs updated every 5 minutes: current holder level from level transmitters, current gas generation rate calculated from blast volume and CO conversion factor (BFG), coke push rate and yield (COG), or converter blow status (LDG), and current consumption rate from flow meter data at each end-use point. With these three inputs the model projects holder level forward using simple mass balance integration. No machine learning or training data is required — the model is deterministic. The AI component detects when actual level diverges from projection by more than 8%, indicating a meter fault or unscheduled consumer change.
How does OxMaint handle plants with incomplete gas metering?
OxMaint supports three scenarios. In the fully metered case, flow meter data at each generation and end-use point is ingested automatically and the balance is calculated deterministically. In the partially metered case, unmeasured flows are estimated from process parameters and clearly flagged as estimated with an uncertainty band. In the manual-entry case, shift operators enter total consumption per major end-use at shift end and the balance is calculated at shift resolution. Even at shift resolution, the daily balance reconciliation identifies large meter gaps and builds the instrumentation business case for management.
OxMaint · Steel Plant Gas Analytics
Your Gas Is Either in a Product, in a Boiler, or in the Atmosphere. Only One of Those Is Free.
BFG holder overflow, LDG blow mismatch, COG scrubber degradation — all are predictable and preventable with the right monitoring infrastructure. OxMaint gives your gas balance team the AI tools to catch every imbalance before the flare stack starts counting.