Steel plants consume approximately 10-15% of global industrial energy demand, with specific energy consumption (SEC) ranging from 400-700 kWh per ton of finished steel depending on production route, equipment age, and operational efficiency. Electric Arc Furnace (EAF) operations represent the most energy-intensive single process, consuming 400-500 kWh per ton of liquid steel produced. Reheating furnaces, rolling mills, and auxiliary systems (compressors, pumps, fans) add another 100-200 kWh per ton. Without systematic energy management across all process zones—melt shop, reheating furnace, rolling mill, cooling systems, compressed air networks, and facility lighting—steel plants hemorrhage operational margin, typically wasting 15-30% of energy consumption through inefficiency, uncontrolled losses, and suboptimal equipment operation. Industry leaders achieving 15% SEC reduction through structured energy management programs realize $2-8 million annual savings on a typical 500,000-ton integrated mill. Oxmaint's energy management system automates baseline energy audits, establishes zone-specific energy KPIs, tracks daily equipment-level consumption through IoT sensors and CMMS integration, identifies waste streams and loss opportunities, schedules preventive maintenance to optimize equipment efficiency, flags anomalies requiring corrective action, and maintains audit-ready compliance documentation for energy credits and decarbonization reporting.
Steel Plant Energy Consumption: Why SEC Reduction Drives Profitability in Competitive Markets
Specific Energy Consumption (SEC) measures the kilowatt-hours required to produce one ton of finished steel. Global benchmarking shows leading mills operating at 350-400 kWh/ton for EAF routes and 450-550 kWh/ton for integrated blast furnace-basic oxygen furnace routes. Median steel plants operate at 20-30% above these benchmarks, wasting energy equivalent to $2-5 million annually per 500,000-ton facility. Steel plants operate in brutally competitive global markets where margin compression forces manufacturers to optimize every controllable cost. Energy represents 15-25% of total production cost in most mills—second only to raw material. Unlike raw material costs (subject to volatile commodity markets), energy efficiency remains fully within management control. A typical 15% SEC reduction through systematic energy management, equipment optimization, waste heat recovery, and operational discipline directly improves EBITDA margin by 2-4%, equivalent to a 5-10% profit improvement on thin-margin steel operations. Energy management is not an environmental compliance initiative—it is a core profitability driver. Steel plants that fail to implement systematic energy reduction lose $10-40 per ton to competitors who do, making energy management essential for market survival. Oxmaint's energy management framework connects energy consumption tracking to equipment performance, maintenance schedules, and production volume, enabling real-time visibility into energy waste and immediate corrective action implementation.
Five Critical Steel Plant Energy Zones and Equipment-Specific SEC Reduction Opportunities
Systematic energy reduction requires identifying the largest consumption zones, understanding physics and controls of each zone, establishing baseline energy intensity metrics, and implementing targeted improvement programs with measurable KPIs. Most steel plants lack visibility into zone-level energy consumption, making data-driven optimization impossible. Oxmaint integrates energy monitoring across all five major zones, tracks consumption trends, and flags underperformance for corrective action. Each zone presents distinct optimization opportunities requiring different technical interventions and measurement approaches.
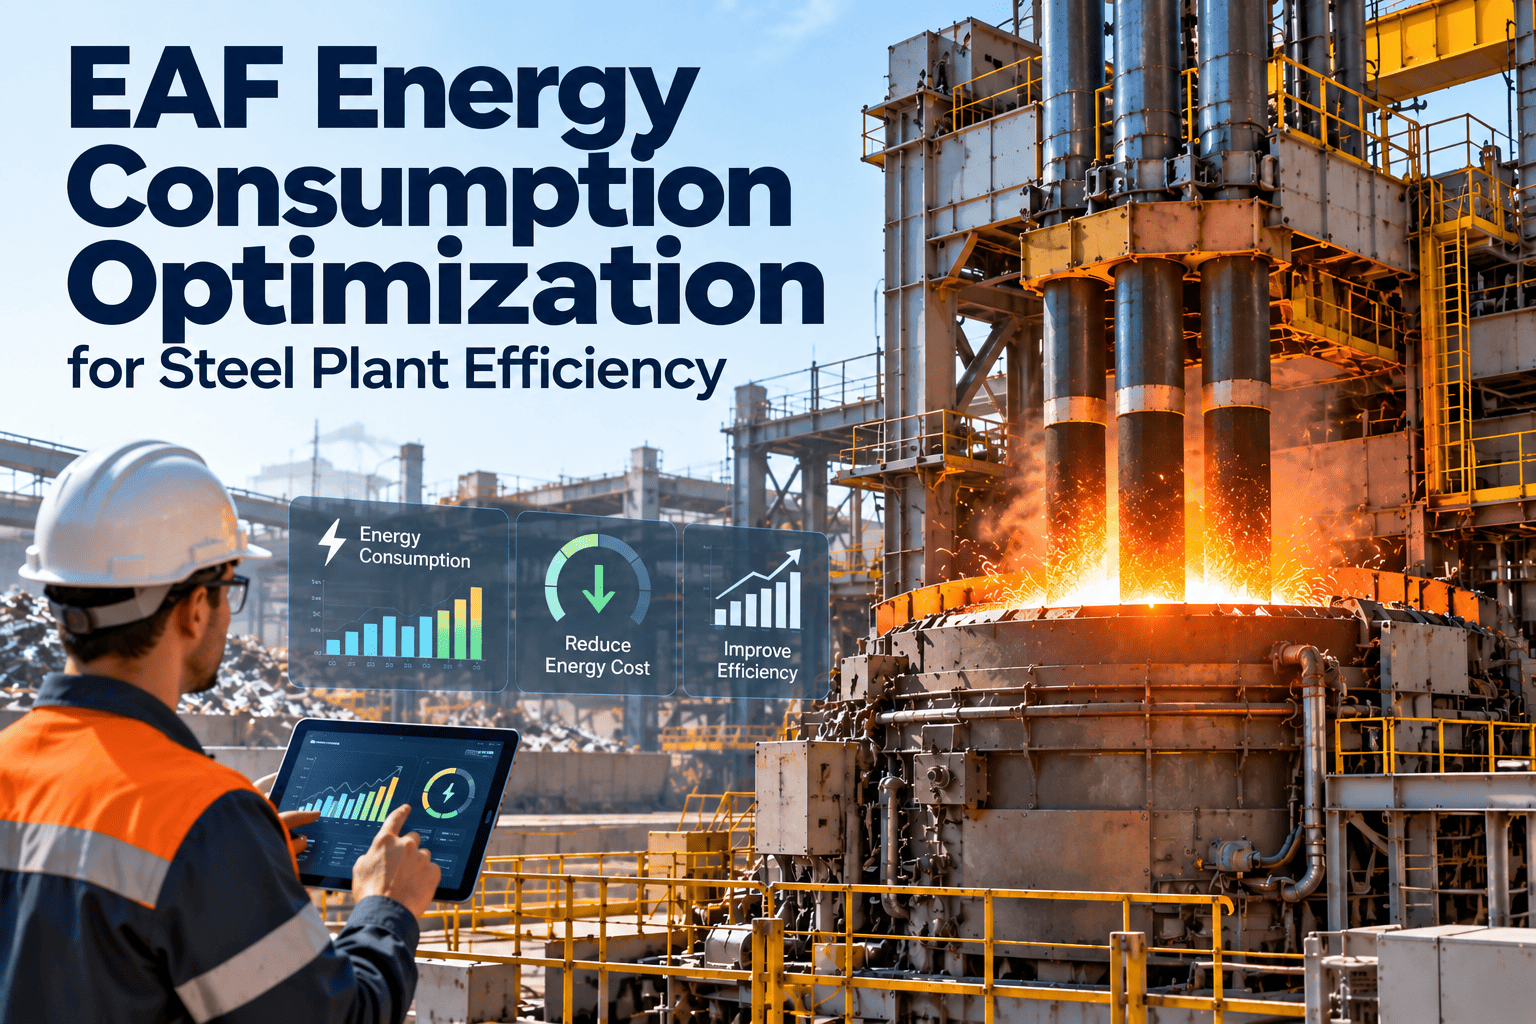
Electric arc furnaces represent 40-50% of total mill energy consumption (400-500 kWh/ton). Optimization: refractory condition monitoring (reduces heat loss by 2-5%), scrap preparation programs (reduces melt time by 10-15%), power-on time optimization, transformer efficiency tracking. Baseline: measure kWh per ton melted, per heat duration, per furnace size. Target: 5-8% reduction through improved refractory management and feed consistency.
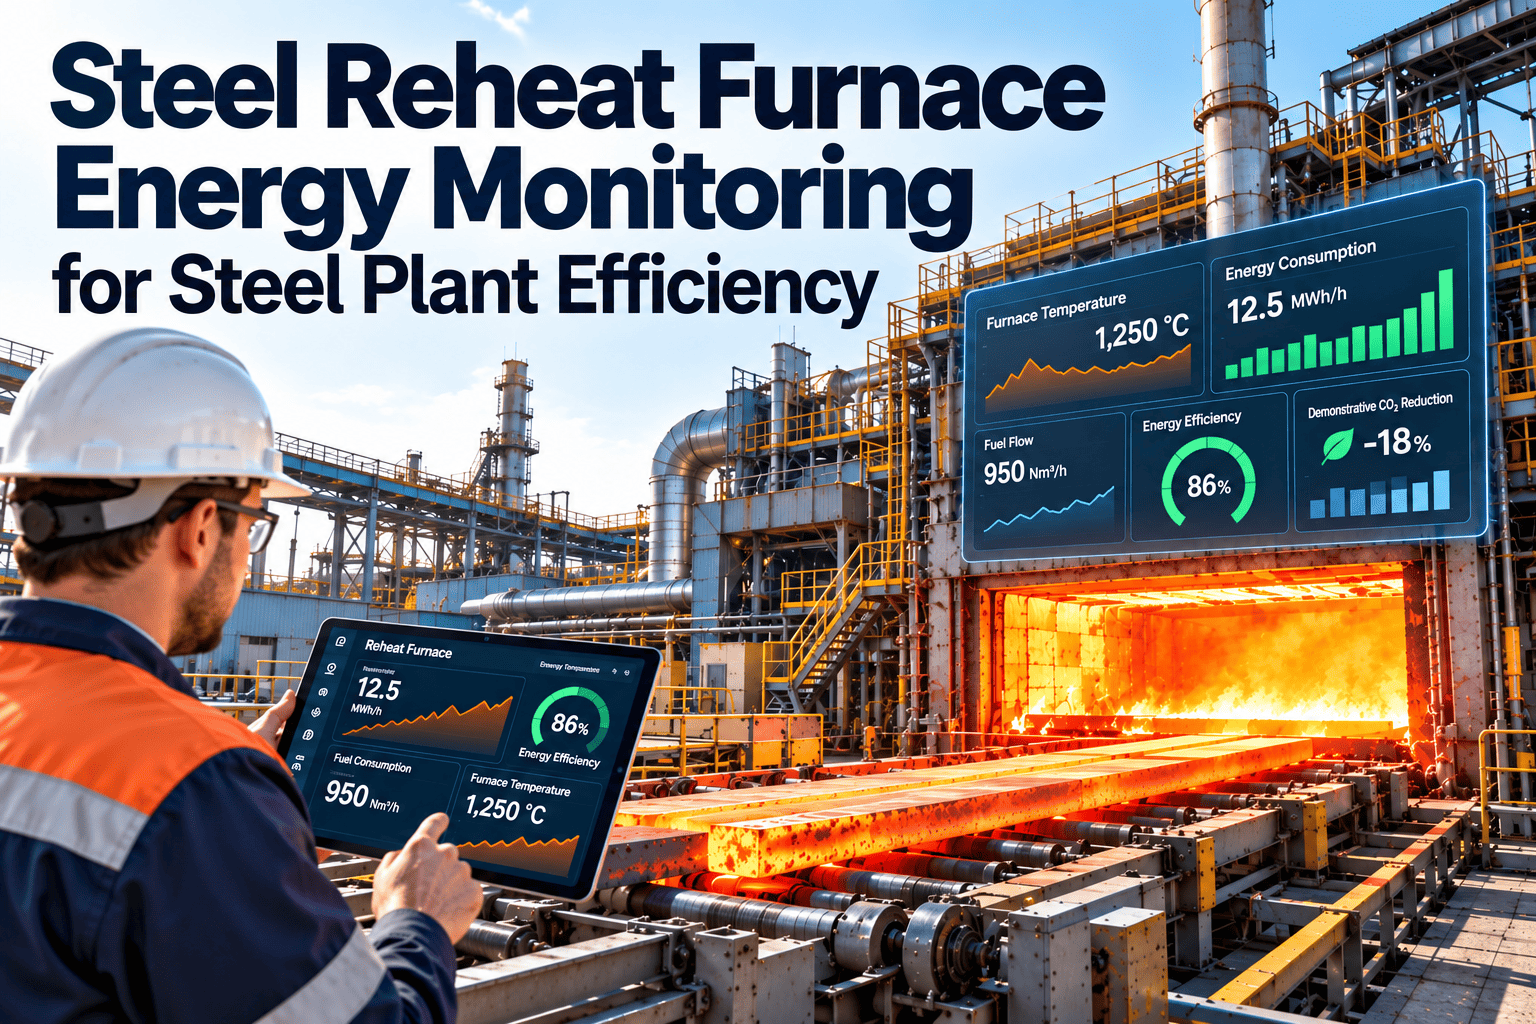
Second-largest energy consumer (100-150 kWh/ton). Optimization: burner efficiency tuning (10-15% savings), scale prevention (reduces heat loss), insulation repair (5-10% savings), exhaust heat recovery (boiler integration saves 15-25% of reheating energy). Baseline: measure fuel consumption per ton throughput, furnace temperature profile, exhaust temperature. Target: 10-15% reduction through burner optimization and waste heat integration.
Motor-driven rolling equipment consumes 50-100 kWh/ton. Optimization: motor efficiency upgrade (5-8% savings), bearing maintenance (reduces mechanical loss), drive system optimization, variable frequency drive (VFD) retrofits (10-20% savings). Baseline: measure electrical consumption per ton rolled, motor load profiles. Target: 8-12% reduction through motor upgrade and drive optimization.
Cooling water circulation, spray systems, and heat exchangers consume 30-50 kWh/ton. Optimization: pump efficiency improvement (10-15% savings), cooling tower cleaning (5-8% savings), water chemistry optimization (reduces scaling, improves heat transfer), closed-loop system upgrades. Baseline: measure pump energy, water flow rates, temperature differential across coolers. Target: 10-15% reduction through pump upgrade and system optimization.
Compressed air systems, facility lighting, and ventilation fans consume 30-80 kWh/ton. Optimization: compressor maintenance (15-20% savings), leak detection and repair (5-10% savings), pressure optimization (2-5% per bar), lighting upgrade to LED (20-30% savings), fan VFD retrofit (15-25% savings). Baseline: measure system pressure (efficiency drops 1-2% per bar above optimal), leak rate, compressed air volume. Target: 15-25% reduction through preventive maintenance and equipment upgrade.
Energy KPI Framework and SEC Reduction Tracking: From Baseline to Target Achievement
Steel plants implementing systematic energy management establish baseline SEC metrics (current-state energy intensity), define target reduction goals (typically 10-15% over 24 months), and track progress monthly through standardized KPI dashboards. Without clear baseline measurement and target-setting, energy initiatives lack focus and accountability. Oxmaint's energy management module automates baseline establishment, real-time KPI calculation, anomaly detection, and monthly reporting to management, enabling data-driven decision-making and progress visibility. Energy KPIs must align with production volume (SEC = total kWh / total tons produced), equipment type, and season to enable meaningful trend analysis and corrective action.
| Energy Zone | Baseline kWh/Ton | Industry Target (Benchmark) | Typical Quick-Win Savings | Implementation Timeline |
|---|---|---|---|---|
| EAF Melt Shop | 450–500 | 380–420 | 20–40 kWh/ton (5–8%) | 3–6 months (ops discipline) |
| Reheating Furnace | 140–160 | 110–130 | 15–25 kWh/ton (10–15%) | 6–12 months (burner tuning) |
| Rolling Mills | 80–100 | 65–75 | 10–15 kWh/ton (10–15%) | 6–18 months (VFD retrofit) |
| Cooling Systems | 40–50 | 30–40 | 5–10 kWh/ton (10–20%) | 3–9 months (maintenance, pump upgrade) |
| Auxiliary Systems | 50–80 | 35–50 | 15–25 kWh/ton (20–30%) | 3–12 months (maintenance, LED, leak repair) |
| TOTAL MILL SEC | 460–550 | 380–450 | 60–115 kWh/ton (12–20%) | 12–24 months (phased delivery) |
Energy Audit, Baseline Measurement, and Corrective Action Implementation Process
Successful energy reduction begins with a comprehensive baseline energy audit that establishes current SEC, identifies major loss streams, quantifies quick-win opportunities, and creates a phased improvement roadmap. Many steel plants skip baseline auditing and attempt reactive energy management, resulting in unfocused efforts and poor ROI. A systematic audit requires 2-4 weeks and involves metering each major process zone, analyzing equipment efficiency curves, benchmarking against industry standards, and identifying correctable inefficiencies. Once baseline is established, Oxmaint tracks progress monthly and alerts operators to deviations requiring corrective action. Energy improvement is not a one-time project—it is a continuous operational discipline requiring monthly monitoring, trend analysis, and incremental optimization to sustain and improve gains over time.
- Install temporary and permanent energy meters on major process zones (EAF, reheating furnace, rolling mills, cooling systems, compressed air). Capture 4-week baseline data at 15-minute intervals.
- Calculate baseline SEC: divide total kWh consumed by total tons of finished steel produced. Establish zone-level energy intensity benchmarks (kWh per ton by zone).
- Compare baseline against industry benchmarks (Best Practice 380-400 kWh/ton EAF, 110-130 kWh/ton reheating). Identify zones performing 20%+ above target.
- Document current equipment (furnace age, motor efficiency ratings, compressor type, cooling tower condition). Note known inefficiencies reported by operations team.
- Perform equipment efficiency analysis: test motors for efficiency deviation, measure compressor discharge pressure vs. system requirement, analyze furnace temperature profiles for setpoint optimization.
- Identify loss streams: compressed air leaks (typically 25-35% of total compressed air energy is lost to leaks), reheating furnace scale formation (reduces heat transfer efficiency by 5-10%), cooling tower fouling (reduces cooling efficiency by 10-15%).
- Quantify quick wins: operations discipline (5-8% savings, 1-2 month payback), maintenance optimization (10-15% savings, 2-4 month payback), equipment upgrades (10-20% savings, 12-36 month payback).
- Develop prioritized improvement roadmap: phase 1 (0-3 months), phase 2 (3-12 months), phase 3 (12-36 months). Align with capital budget and operational priorities.
- Compressed air system: detect and repair leaks (survey with ultrasonic leak detector, fix high-pressure drops), optimize compressor discharge pressure (reduce to minimum required for operations, save 2-5% per bar reduction).
- Reheating furnace: optimize setpoint temperature (reduce 10°F = 1-2% fuel savings if feasible for product quality), repair scale on furnace walls (improves heat transfer 5-8%), tune burners for optimal air/fuel ratio (10-15% fuel savings).
- Operations discipline: implement EAF scrap preheating (use waste heat from exhaust gas, reduce cold melt energy by 10-15%), reduce power-on time through improved scrap charge design, optimize rolling mill load profiles.
- Oxmaint tracks all improvements: log remediation actions (leak repairs, burner tuning, pressure optimization), measure post-implementation kWh/ton, calculate realized savings vs. projection. Monthly reporting shows progress toward target.
- In Oxmaint, create energy management dashboard showing: current month SEC (kWh/ton), comparison to baseline and target, month-over-month trend, zone-level energy intensity, equipment efficiency status, maintenance completion %.
- Automate monthly KPI report: distributes to plant management, chief engineer, production manager. Report includes current performance vs. target, realized savings ($/month), status of improvement projects, upcoming maintenance activities affecting energy performance.
- Alert protocol: if monthly SEC exceeds baseline by >2% OR fails to progress toward annual target, trigger root cause analysis and corrective action assignment. Common triggers: equipment breakdown reducing efficiency, operator training gap, compressor discharge pressure drift, cooling water flow degradation.
- Quarterly energy management review: assess progress against 12-month roadmap, adjust improvement timelines if needed, allocate budget for phase 2 equipment upgrades, celebrate milestone achievements (first 5% reduction, 10% target attained). Continuous improvement culture sustains long-term gains.
Energy Cost Savings and Decarbonization Benefits: From Operational Savings to Sustainability Credits
Energy reduction delivers dual benefits: immediate operational savings (reduced electricity and fuel expense) and long-term sustainability benefits (carbon credit value, regulatory compliance, ESG reporting). A typical 500,000-ton mill operating at 520 kWh/ton consuming 260 million kWh annually at $0.08/kWh (U.S. industrial average) spends $20.8 million annually on energy. A 15% SEC reduction (78 kWh/ton savings) reduces consumption to 221 million kWh, saving $3.12 million annually. Beyond operational savings, decarbonization value emerges: energy reduction also reduces Scope 1 and Scope 2 carbon emissions (approximately 0.2 metric tons CO2 per kWh for grid electricity in U.S., 0.3-0.5 tons CO2 per kWh for fossil fuel-based furnace operation). Fifteen percent SEC reduction eliminates 15,600-26,000 metric tons annual CO2 emissions—equivalent to removing 3,400-5,600 gasoline-powered vehicles from roads annually. Steel industry decarbonization is driven by regulatory mandates (EU ETS carbon pricing, U.S. Inflation Reduction Act clean steel credits), customer demand (automotive and construction sectors requiring low-carbon steel for ESG compliance), and financial incentives (green bonds, carbon credits). Mills demonstrating documented SEC reduction and decarbonization progress command price premiums (2-5% higher selling price) and capture dedicated sustainability-focused supply contracts. Energy management is therefore not merely operational optimization—it is core business strategy enabling competitive advantage, regulatory compliance, and ESG value.
Measure total mill kWh divided by total finished steel tons. Track monthly to identify trends, celebrate progress, and maintain operational discipline driving continuous improvement.
Establish and monitor zone-level baselines independently. Zone performance tracking enables targeted improvement efforts and prevents overall SEC masking zone-specific failures.
Calculate realized savings: (baseline kWh/ton - current kWh/ton) × production volume × electricity rate. Track cumulative annual savings and ROI on improvement projects.
Calculate CO2 avoided: (baseline kWh - current kWh) × 0.2-0.5 tons CO2/kWh. Document for ESG reporting, sustainability marketing, and potential carbon credit monetization.
Track execution of phase 1, 2, and 3 improvements. Delays in equipment upgrades (VFD retrofit, motor replacement, furnace upgrade) directly delay SEC reduction realization.
Energy efficiency degrades without discipline: compressor efficiency drops 2% per leak, motor efficiency drops with wear, furnace refractory degrades with thermal cycling. Maintenance completion directly correlates to SEC maintenance.