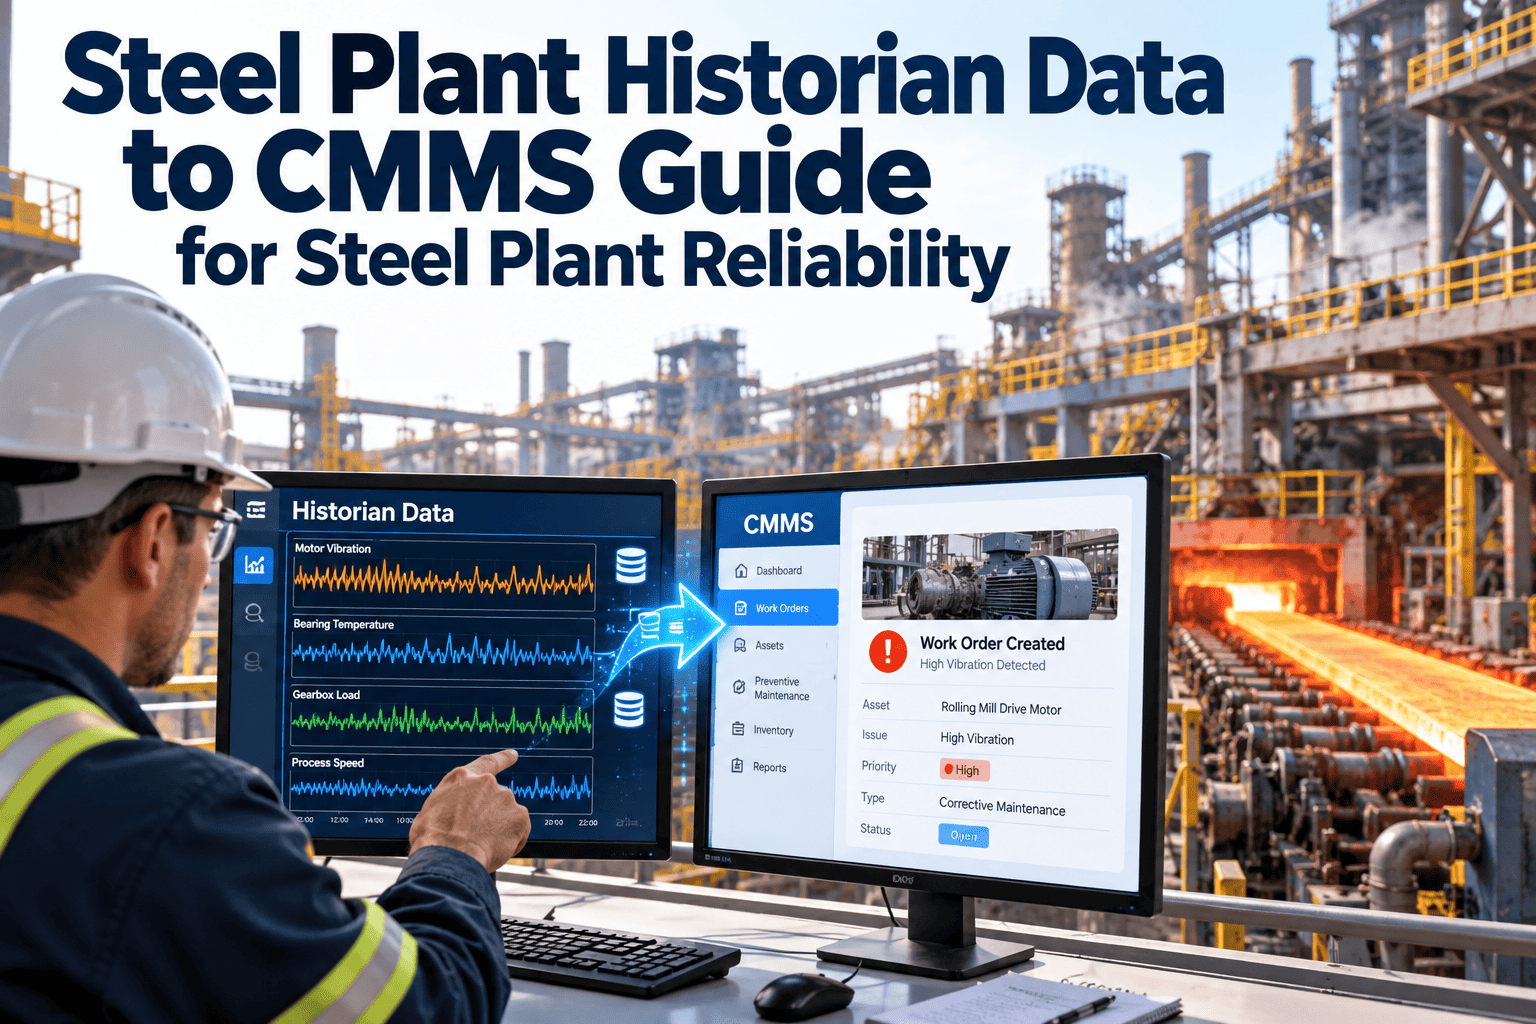
Steel plants already collect huge volumes of process data in historians and Level-2 systems, yet much of it never reaches the people who plan maintenance. A bearing temperature creeps upward on a trend screen, but no work order exists until something trips. Connecting historian data to maintenance workflows closes that gap by turning meaningful signals into alerts, asset trends and tracked jobs. This guide explains the architecture, tag mapping and alert rules involved, and how a steel plant CMMS can receive them.
Steel Plant Historian Data to CMMS for Reliability
Turn historian and Level-2 condition data into maintenance alerts, asset trends and work orders your team can act on.
Sensors and PLCs
Temperatures, pressures, currents, vibration, counters.
Level-2 and historian
Process models, stored tags and calculated values.
Alert logic
Thresholds, trends and conditions filter the noise.
Maintenance action
Notification, work order, parts and history.
The gap between data and maintenance action
Data stays in the control room
- Operators see trends, but maintenance sees nothing
- Abnormal readings are discussed verbally at shift handover
- Condition checks depend on someone opening the right screen
- Failure analysis starts after the stop, using screenshots
Data drives maintenance
- Qualifying signals create a notification automatically
- Each alert is linked to the correct asset and history
- Planners review, prioritize and schedule work
- Failure analysis uses trends saved against the asset
Why this matters in steel
Steel lines run continuously, with short windows for planned stops. Early warning from existing signals lets teams place repairs into those windows rather than react to a trip.
What data a steel plant historian typically holds
| Area | Useful signals | Maintenance meaning |
|---|---|---|
| Rolling mill | Motor current, torque, bearing temperature, stand load, vibration where available | Overload, bearing wear, drive stress |
| Hydraulic systems | Pressure, oil temperature, filter differential, pump current, tank level | Pump wear, leakage, contamination |
| Cooling water | Flow, pressure, supply and return temperature | Blockage, scaling, pump problems |
| Furnaces and melt shop | Transformer oil temperature, electrode current, panel cooling water temperature | Electrical stress, cooling faults |
| Cranes and drives | Hoist motor current, brake status, load counts, drive faults | Duty cycles, brake and rope wear |
| Conveyors and fans | Motor current, belt speed, bearing temperature, run hours | Overload, misalignment, runtime based service |
Not every tag deserves an alert
A historian may store tens of thousands of tags. Start with the signals that already correlate with known failure modes on critical equipment.
Integration architecture options
Direct interface
The CMMS or an adapter reads the historian through its API, OPC interface or database connector on a schedule.
Middleware or gateway
An integration layer collects data, applies rules and sends events to the CMMS, keeping systems loosely coupled.
Event-driven messaging
Alerts are published through a broker or message queue, which suits plants with several consuming systems.
File or report based
Exports are loaded periodically. It is simple, but it adds delay and suits only slow-changing indicators.
Choose by data rate and ownership
Operational technology teams usually own historians and Level-2 systems. Agree early who maintains the interface, credentials and tag lists.
Give your historian a maintenance outlet
Route meaningful condition signals into work orders, asset history and schedules.
Mapping tags to assets
An alert is only useful if it points to the exact machine. Tag naming in the control system rarely matches the asset hierarchy used by maintenance.
| Mapping element | Example | Why it matters |
|---|---|---|
| Historian tag | Stand bearing temperature, drive side | Source of the measurement |
| Asset record | Stand gearbox input bearing | Where the work will be done |
| Engineering unit | Degrees Celsius | Prevents misreading values |
| Normal range | Operating band at rated load | Defines abnormal behaviour |
| Alert rule | Sustained rise above band or fast rate of change | Triggers action |
| Response template | Inspect lubrication, check bearing, review alignment | Gives the technician a plan |
Maintain the mapping as equipment changes
Replaced instruments, renamed tags and modified equipment break alerts silently. Reviewing the mapping after each outage keeps it trustworthy.
Types of alert rules
Static threshold
Value stays above or below a set limit, for example a temperature high limit.
Rate of change
Value rises faster than normal, even if the limit is not yet reached.
Deviation from baseline
Reading differs from the same asset at similar load and speed.
Combined conditions
Several signals together, such as rising current with falling flow.
Add time and context
Require a condition to persist for a defined period and to occur during normal production. That removes spikes caused by start-up, changeover or sensor noise.
From signal to work order: the decision path
Detect
The rule engine evaluates a tag against its limits and conditions.
Validate
Check signal quality, operating state and whether an open job already exists.
Create
Raise a notification or work order with the reading, trend and asset reference.
Review
A planner confirms priority, scope, parts and the best time to execute.
Close the loop
Technician findings are recorded and used to tune the rule.
Automatic does not mean unattended
Many plants create notifications automatically but require a planner to approve work orders. That keeps accountability clear and limits poor-quality jobs.
Avoiding alert fatigue
Causes
- Limits copied from operating alarms
- No filtering for start-up or load changes
- Duplicate alerts for one ongoing condition
- Rules never reviewed after repairs
Controls
- Separate maintenance limits from process alarms
- Use persistence and operating-state conditions
- Suppress repeats while a job is open
- Review alert outcomes monthly
Measure alert quality
Track how many alerts led to a confirmed finding. Rules with a low confirmation rate need adjustment or removal.
Runtime and counter-based maintenance
Not every integration needs a condition alert. Historian counters can drive usage-based preventive maintenance, which is often easier to start with.
- Motor and fan running hours, to schedule lubrication and inspection
- Crane lift counts, to trigger brake and rope inspections
- Rolled tonnage between roll or bearing changes
- Pump starts and stops, to track duty and seal wear
- Heats or campaigns completed on furnace and ladle equipment
Usage fits steel plants better than the calendar
A machine that ran twice as hard last month needs attention sooner. Meter-based schedules reflect that reality.
Connecting to SAP PM and other systems
| Scenario | Typical approach | Points to agree |
|---|---|---|
| CMMS is the maintenance system of record | Historian events create work in the CMMS directly | Rule ownership and approval process |
| SAP PM remains the master for orders | Alerts raise notifications, then sync to SAP PM through integration | Field mapping, status updates and equipment IDs |
| Both systems are used by different teams | Define which holds assets, costs and history | Avoiding duplicate records |
| Level-2 holds the process model | Pass calculated indicators rather than raw data | Meaning and validity of each indicator |
Decide the system of record first
Most integration problems come from unclear ownership of asset data. Settle that before building interfaces.
Security and reliability of the integration
- Keep control networks separated from business systems, using agreed gateways or demilitarized zones
- Prefer read-only access to the historian for maintenance use
- Follow site policy and standards such as IEC 62443 for industrial security
- Use service accounts with limited rights and managed credentials
- Log interface activity and monitor for failed connections
- Define what happens when the link is down, so alerts are not silently lost
Maintenance data must not endanger production
Involve operational technology and security teams from the start. Their approval is easier to obtain when the design is read-only and clearly scoped.
Data quality checks before going live
How Oxmaint fits into the workflow
| Maintenance need | Oxmaint capability |
|---|---|
| Hold the asset hierarchy that tags map to | Asset management |
| Act on a condition alert | Corrective work orders with priority and assignment |
| Runtime or meter based servicing | Preventive maintenance scheduling |
| Capture what technicians find | Mobile inspections and work order notes |
| Reserve parts for the repair | Inventory management |
| Review alert outcomes and downtime | Reports and dashboards |
Scope the integration with your team
Interface options depend on your historian and network setup. Confirm the specific connection approach during a demo or implementation discussion.
Example use cases for steel plant equipment
| Use case | Signal pattern | Likely maintenance response |
|---|---|---|
| Mill gearbox bearing | Temperature rising at steady load, or faster than sister stands | Check lubrication, inspect bearing, review vibration data |
| Hydraulic pump wear | Rising pump current with falling pressure or longer pressure build-up | Inspect pump and relief valve, check oil condition |
| Cooling circuit fouling | Flow dropping while pump current stays the same or rises | Inspect strainers, heat exchanger and nozzles |
| Filter blockage | Differential pressure climbing across a filter | Replace element, check contamination source |
| Transformer or panel cooling issue | Oil or water temperature outside the normal band for the load | Inspect cooling system and connections |
| Fan imbalance or buildup | Motor current or vibration drifting with constant speed | Clean impeller, balance, inspect bearings |
Compare like with like
Comparing an asset with its own history, or with identical equipment at similar load, usually gives better alerts than a single fixed limit.
What a good alert contains
- The asset name, location and criticality
- The tag, current value, limit and unit
- A short trend of the previous days, not only the last reading
- The operating state and load at the time
- Related alerts on the same asset
- A suggested checklist or job plan
- The person or team responsible for review
Context saves diagnosis time
A technician who receives a trend and a checklist can start work immediately. A bare notification forces a trip to the control room to find out what happened.
Using historian trends in failure analysis
Before the failure
- How early did the signal begin to change?
- Did operators or maintenance see it?
- Was an alert configured for this failure mode?
After the failure
- Which tags confirm the cause?
- Should a new rule be added or an old limit tightened?
- Can the response be added to a job plan?
Every failure improves the rules
Saving the relevant trend with the closed work order builds a library of real failure signatures. Over time, that library makes alert limits more credible.
Roles and responsibilities
Integration is a shared project
Projects stall when only one department owns them. Naming each role early keeps tag lists, rules and work processes moving together.
Common integration mistakes
- Connecting thousands of tags before any rule has proved useful
- Using process alarm limits as maintenance triggers without adjustment
- Skipping asset mapping, so alerts reach nobody in particular
- Creating work orders automatically with no review step
- Ignoring interface failures, so silence is mistaken for good health
- Never reviewing rules after repairs, upgrades or instrument changes
Start narrow and prove the value
A small set of well-understood alerts that technicians trust is worth more than a large set that everyone ignores.
Keeping rules healthy over time
- Review each rule after a confirmed finding, a false alarm or a missed failure
- Record who changed a limit, when, and the reason
- Re-baseline after overhauls, roll changes or process changes
- Retire rules for equipment that has been replaced or removed
- Test the interface after software updates or network changes
Treat rules as maintained assets
Alert rules age just like equipment. A short review cycle keeps them aligned with how the plant actually runs today.
Phased rollout
Choose a pilot
Pick one critical asset group with known failure modes and good data.
Map and test
Link a handful of tags to assets and run rules in review mode first.
Go live with approval
Create notifications and require planner approval for work orders.
Tune and expand
Review outcomes, refine limits and add further assets.
Measures of success
- Alerts that lead to a confirmed finding
- Average warning time before failure or repair
- Share of repairs planned instead of reactive
- Duplicate and ignored alerts per month
- Unplanned downtime on integrated assets
- Time from alert to work order creation
- Tags with valid asset mapping
- Rule reviews completed after each outage
Frequently asked questions
Why connect a historian to a CMMS?
So condition data triggers maintenance action and is stored with asset history, not left on trend screens.
Should every tag create a work order?
No. Start with tags tied to known failure modes on critical assets, and filter heavily.
Can it work alongside SAP PM?
Often yes, with clear system-of-record rules. Book a demo to discuss your setup.
Is Level-2 data useful for maintenance?
Calculated indicators and process context can improve alert quality when their meaning is documented.
How do we begin?
Build the asset hierarchy first. You can sign up and prepare your assets.
Turn plant data into planned maintenance
Link condition signals, assets, work orders and parts in one maintenance system.