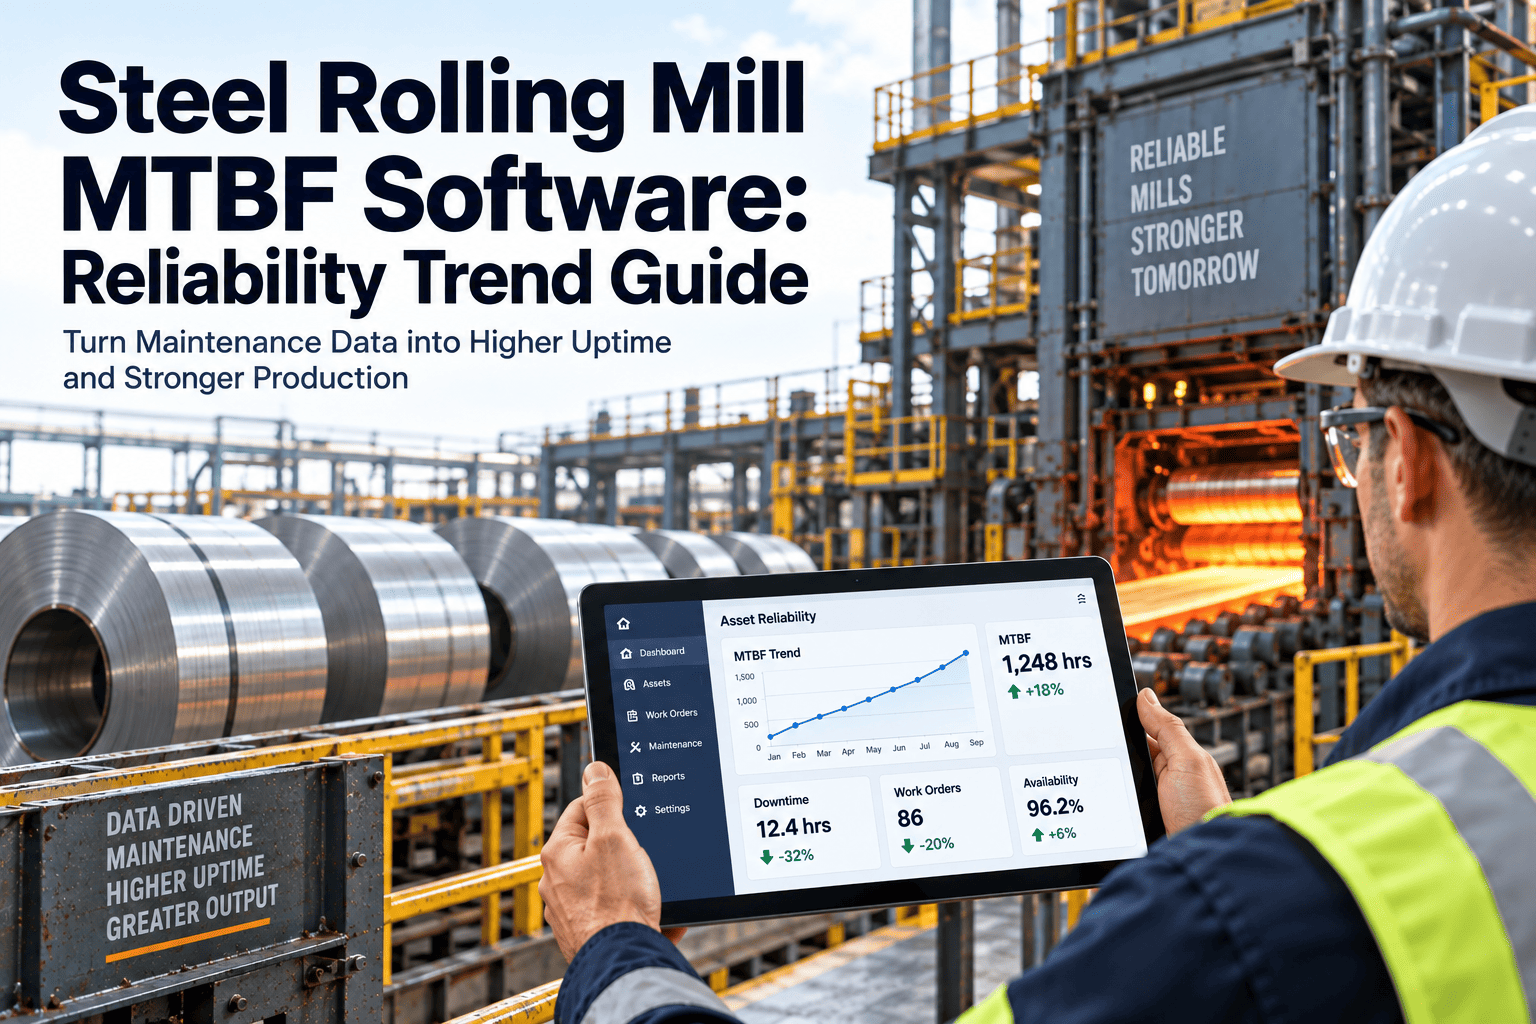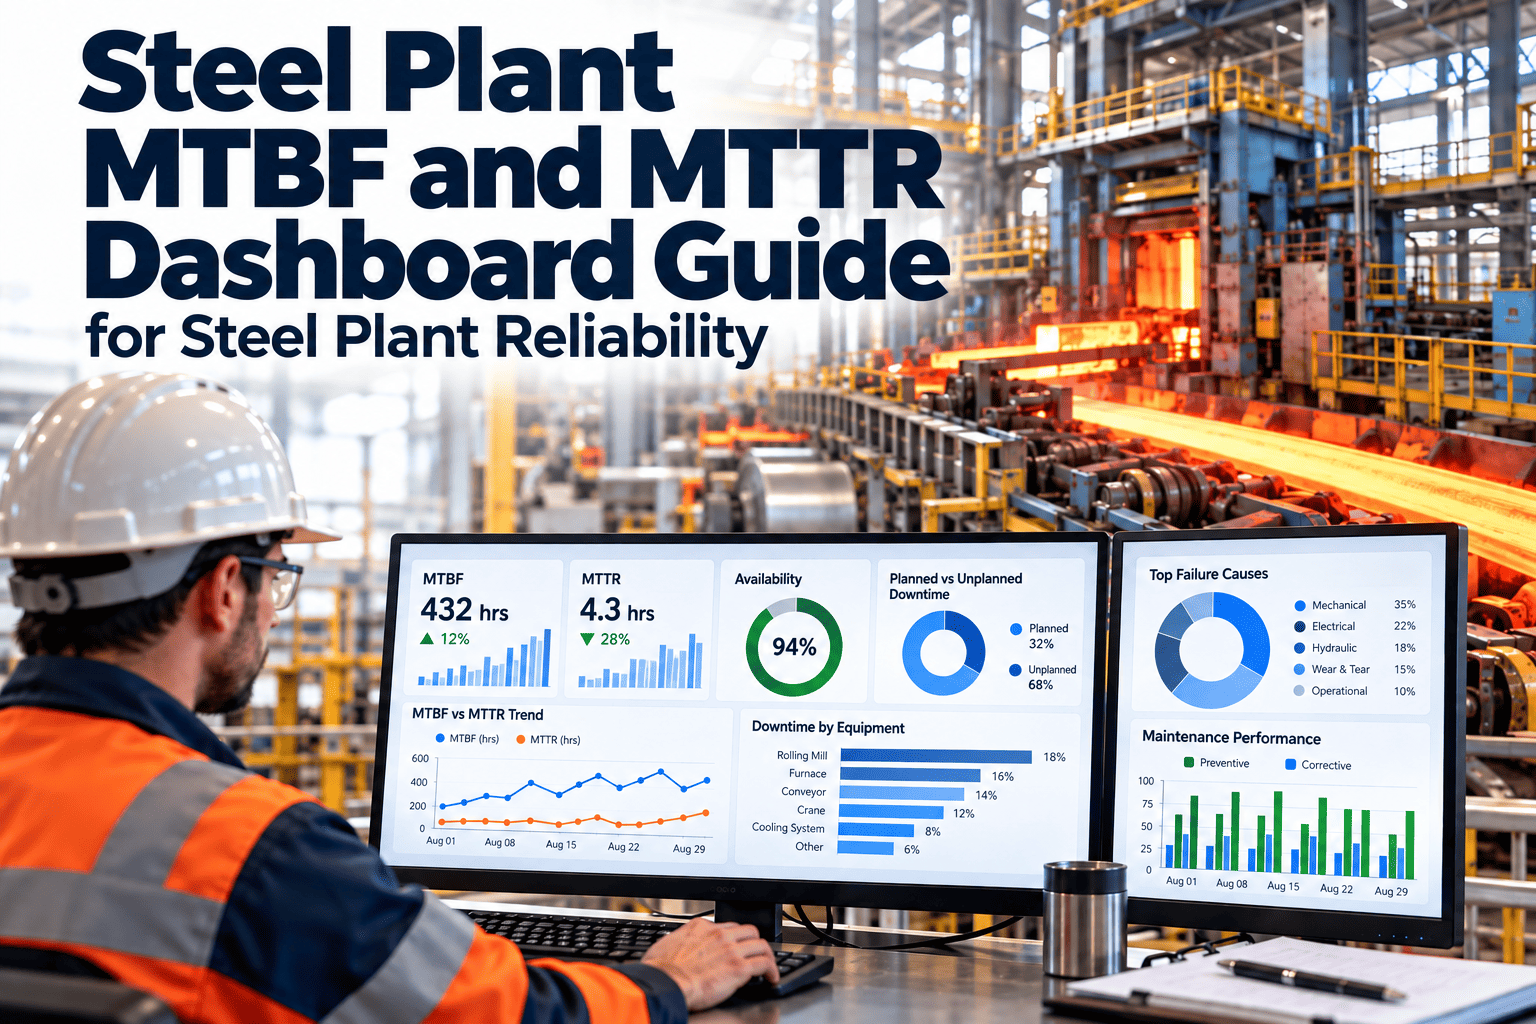
Most maintenance teams can tell you how many work orders closed last month, but far fewer can tell you which asset is quietly consuming the most repair hours relative to how often it runs. Mean time between failures and mean time to repair are the two metrics that answer that question directly, and when they are tracked on a live dashboard instead of a quarterly spreadsheet, they turn into an early warning system for chronic equipment. This guide walks through how to build and read an MTBF and MTTR dashboard for a steel plant, and how a connected system like Oxmaint keeps the underlying data accurate enough to trust.
Steel Plant MTBF and MTTR Dashboard Guide for Steel Plant Reliability
Identify chronic assets, repair bottlenecks and reliability improvement opportunities with MTBF and MTTR dashboards built on accurate work order data.
What MTBF and MTTR Actually Measure
Mean time between failures measures how long an asset typically runs before it fails again. Mean time to repair measures how long it takes to get that asset back into production once it does fail. Together, they separate two very different reliability problems that a raw downtime total blends into one number, and treating them as a single combined figure hides which lever actually needs to be pulled.
Confusing the two leads to the wrong fix. A plant with falling MTBF but stable MTTR does not need faster repair crews — it needs to understand why the asset keeps breaking. A plant with stable MTBF but rising MTTR does not need a different maintenance strategy — it needs to fix whatever is slowing down the repair itself, whether that is a parts shortage or a diagnostic bottleneck. Tracking both side by side, rather than folding them into a single availability number, keeps the team from solving the wrong problem.
Building the Underlying Data Before the Dashboard
An MTBF and MTTR dashboard is only as good as the work order data feeding it. Three data quality issues show up repeatedly in steel plants building their first version of these metrics, and each one is worth checking before trusting a single chart on the wall.
- Failure events logged inconsistently — some as a new work order, others appended to an existing one, which distorts the failure count
- Repair start and end times recorded loosely, often rounded to the nearest shift rather than the actual clock time
- Planned maintenance and unplanned failures mixed into the same total, which understates true MTBF
Cleaning these three issues up before building a dashboard matters more than the dashboard tool itself. A well-designed chart built on inconsistent timestamps will still produce misleading numbers, and a reliability engineer who chases a trend built on bad data usually loses trust in the whole exercise after the first false alarm.
Build Dashboards on Data You Can Trust
Oxmaint captures failure start times, repair completion and cause codes directly from the work order, so MTBF and MTTR calculations reflect what actually happened on the floor.
What a Useful MTBF/MTTR Dashboard Includes
A dashboard built for daily use by a reliability engineer looks different from one built for a monthly leadership review. Both have a place, but they answer different questions, and trying to serve both audiences from a single view usually satisfies neither one well.
| Dashboard View | Primary Audience | Key Question It Answers |
|---|---|---|
| Asset-level MTBF/MTTR trend | Reliability engineers | Which specific assets are degrading? |
| Process area rollup | Maintenance planners | Where should this week's crew hours go? |
| Chronic asset leaderboard | Reliability & operations | Which assets keep coming back despite repairs? |
| Plant-wide trend line | Plant leadership | Is reliability improving or slipping over time? |
| Repair bottleneck view | Maintenance managers | What is driving MTTR up — parts, labor or diagnostics? |
Reading a Chronic Asset Pattern
A chronic asset is one that shows a falling MTBF trend over several consecutive periods, even if each individual failure looks minor in isolation. The pattern below illustrates how this typically shows up before anyone flags the asset for a deeper review, often hiding in plain sight across several routine work orders that nobody had reason to connect.
What Drives MTTR Up in a Steel Plant Environment
Repair duration on steel mill equipment is shaped by factors that are less common in lighter manufacturing environments, which is part of why MTTR benchmarks from other industries translate poorly.
MTBF and MTTR by Process Area
Because failure modes differ so much by process area, plant-wide MTBF and MTTR figures tend to average away the signal that matters most. Breaking the metrics out by melt shop, caster, hot mill and finishing usually reveals a very different reliability story in each area.
| Process Area | Dominant MTBF Driver |
|---|---|
| Melt shop | Thermal cycling, campaign length, cooldown time before repair |
| Caster | Mold and segment wear, breakout severity |
| Rolling mill | Product mix, grade and gauge changeovers |
Melt shop assets — electrode systems, tap-hole equipment, cooling panels — often show shorter MTBF cycles tied directly to thermal cycling and campaign length, with MTTR heavily influenced by cooldown requirements before repair work can begin safely. Caster MTBF tends to track mold and segment wear closely, with breakout events representing the most severe end of the failure distribution. Rolling mill MTBF is often the most sensitive to product mix, since grade changes and gauge changes place different loads on rolls and bearings than steady-state production, and a schedule with frequent product changeovers will naturally show a different reliability profile than one running long campaigns of a single grade.
Connecting MTBF and MTTR to Capital Planning
MTBF and MTTR are operational metrics, but they translate directly into capital planning conversations once the trend is clear enough to act on. A caster segment with steadily declining MTBF and climbing MTTR is not just a maintenance problem — it is evidence for a rebuild or replacement business case that a single repair invoice never provides on its own.
- Declining MTBF over multiple consecutive periods supports a capital replacement case more convincingly than a single expensive repair
- Rising MTTR alongside stable MTBF points toward a maintainability fix — parts stocking, access design or diagnostic tooling — rather than replacement
- Comparing cumulative repair cost against replacement cost, using MTBF trend as the timing signal, keeps the decision grounded in data rather than urgency
- Sharing the trend with finance and operations ahead of the failure, not after it, gives capital planning more lead time to work with
This is where a live dashboard earns its keep over a static report: the trend is visible months before the asset would otherwise force the conversation through an emergency outage, and the plant gets to choose the timing of the intervention instead of having it chosen for them.
Setting Realistic MTBF and MTTR Targets
Targets set without reference to an asset's own history tend to be either meaningless or discouraging. A more useful approach sets targets relative to each asset's baseline rather than a single plant-wide number.
- Establish a twelve-month MTBF and MTTR baseline per asset before setting any target
- Set improvement targets as a percentage change from baseline, not an absolute industry figure
- Separate targets for Tier 1 assets from Tier 3 and Tier 4 support equipment
- Revisit targets after major events — a reline, a rebuild or a design change — since the baseline shifts
- Review targets with both maintenance and operations, since operating practices influence both metrics
Before and After: Acting on Dashboard Signals
- Chronic assets identified months after the trend started
- Root cause work happens only after a major failure
- Spare parts stocking based on guesswork, not repair frequency data
- Falling MTBF flagged within weeks, not months
- Root cause review triggered by trend, not by failure
- Spare parts stocking aligned to actual repair frequency by asset
How Oxmaint Supports MTBF and MTTR Tracking
Oxmaint captures the work order timestamps, cause codes and asset links that MTBF and MTTR calculations depend on, without requiring maintenance teams to fill out a separate reliability form on top of the repair itself.
Rolling These Metrics Out Without Overwhelming the Team
Introducing MTBF and MTTR tracking plant-wide on day one usually produces more resistance than adoption, particularly if technicians feel the numbers are being used to score individuals rather than improve the process. A narrower rollout tends to land better.
- Start with the ten to fifteen assets already known to be problematic, where the data will confirm what the team already suspects
- Frame the metrics as a tool for prioritizing engineering time, not a scorecard on technician performance
- Review the first few months with the maintenance team directly, so they see the dashboard catch something useful early
- Expand to full Tier 1 and Tier 2 coverage only once the initial group shows the dashboard is trusted and used
- Keep the calculation method visible and consistent, so nobody questions whether a number was adjusted after the fact
Plants that skip this staged approach and roll MTBF and MTTR out everywhere at once often end up with technicians logging timestamps loosely just to avoid scrutiny, which quietly undermines the data quality the whole exercise depends on and can take months of rebuilt trust to fully correct.
We had MTBF and MTTR in a spreadsheet that someone updated once a quarter, which meant we were always looking at old news. Once the numbers updated automatically from the work orders themselves, we caught a caster segment trending down two months before it would have shown up in the quarterly review.
Frequently Asked Questions
Turn Work Order Data Into Reliability Insight
Oxmaint calculates MTBF and MTTR automatically from the work orders your team already logs, surfacing chronic assets before they become the next capital emergency.