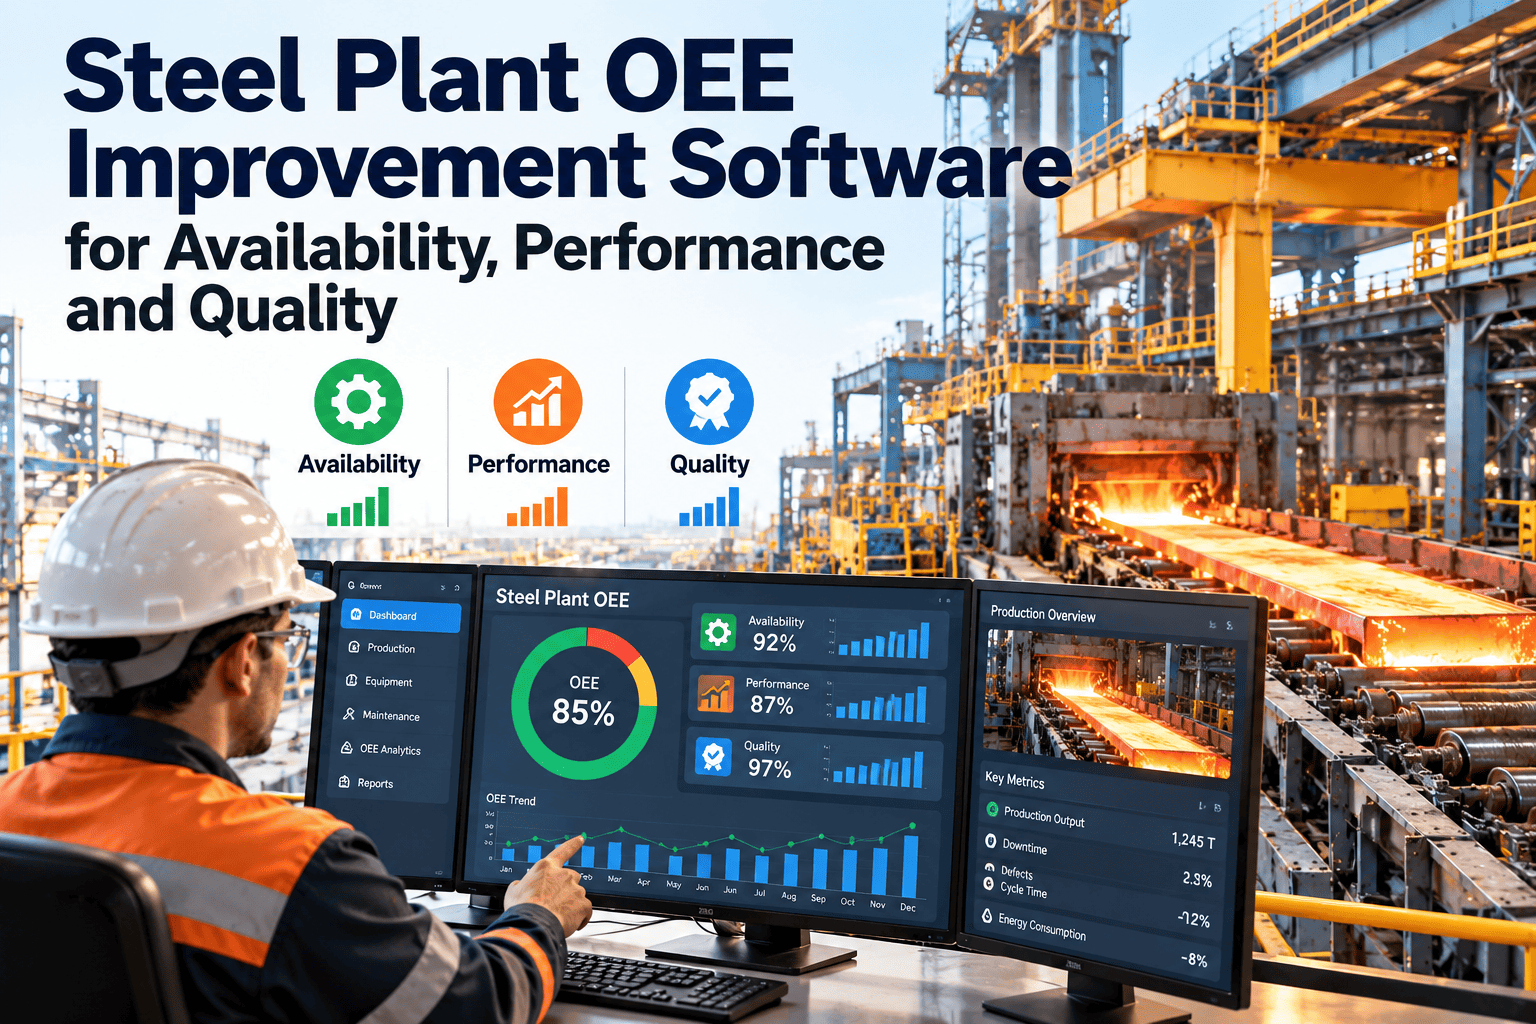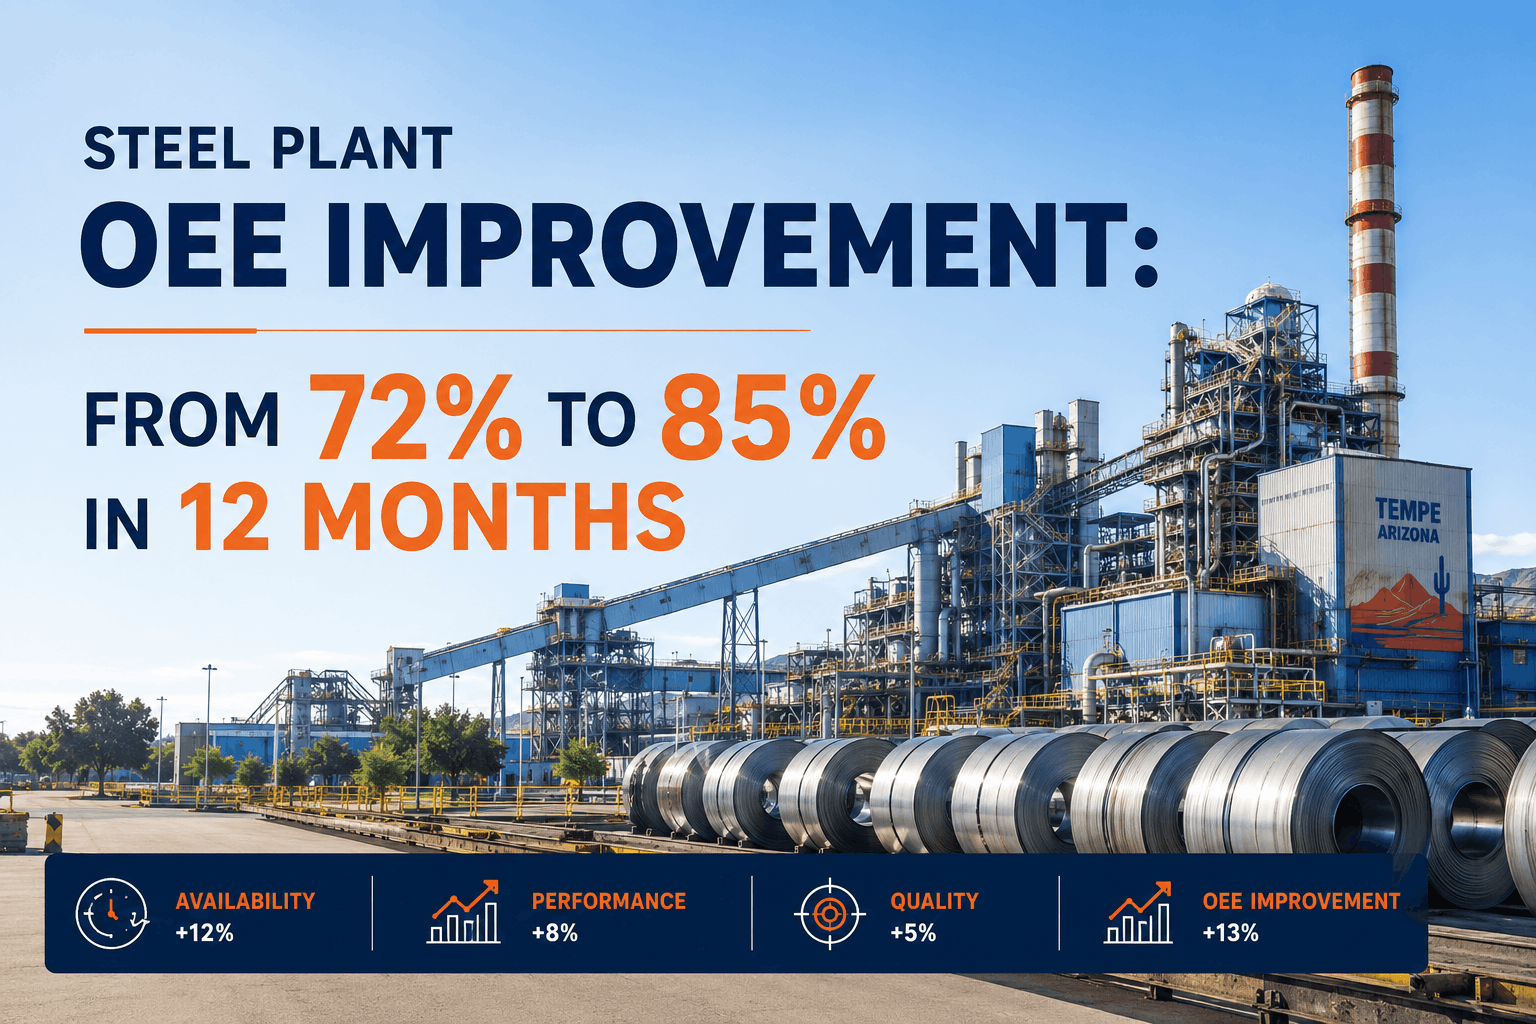
Steel plant Overall Equipment Effectiveness (OEE) scores of 65-72% are painfully typical — the result of chronic downtime, performance losses, and quality defects that plants accept as inevitable. But 15-18 percentage-point OEE improvements are demonstrably achievable within 12-18 months through systematic tracking of the "Six Big Losses," prioritized equipment intervention, and real-time visibility into equipment performance data. A steel mill improving from 72% OEE to 85% OEE experiences 18% increase in production volume from the same installed equipment capacity — eliminating the need for $15-30M capital investment in new mill capacity. The path to world-class OEE (85%+) requires breaking down equipment performance into measurable loss categories, identifying the specific equipment and operating shifts where losses concentrate, and deploying maintenance and operational improvements targeted at the highest-impact loss drivers. Sign Up Free to track OEE performance by equipment, identify the Six Big Losses driving your downtime, and measure improvement progress toward world-class reliability targets.
From 72% to 85% OEE in 12 Months: A Proven Improvement Framework
Systematic OEE improvement programs targeting availability, performance, and quality losses deliver 13-18 percentage-point OEE gains within 12 months — increasing production volume by 18-25% from existing equipment and preventing $15-30M in unnecessary capital expenditure.
OEE Fundamentals: Why 72% Performance Hides $30M in Lost Capacity and How to Unlock It
Overall Equipment Effectiveness is calculated as Availability × Performance × Quality — three independent loss categories that compound their impact on total production capacity. A 72% OEE steel mill (the typical benchmark for the industry) breaks down roughly as 82% availability (18% downtime), 88% performance (12% running at reduced speed or utilization), and 99% quality (1% scrap/rework). This means a single shift on a rolling mill with 100 metric ton/hour design capacity only produces 58 tons/hour of sellable material — 42 tons per hour of theoretical capacity sits unused. The $30M cost calculation becomes obvious: if that 42 tons/hour can be recovered and sold at $800/ton, the annual production value gain from an 18-point OEE improvement (achieving 85% total OEE) totals $295-330M for a typical large facility. The challenge is that small improvements to each loss category produce dramatically higher OEE results than intuition suggests: a 4-point availability improvement (82% to 86%), a 5-point performance improvement (88% to 93%), and a 2-point quality improvement (99% to 101%, which is impossible, so capped at 100%) combine to create an 18-point total OEE gain (72% to 85%). This nonlinear sensitivity means that focused intervention on the highest-loss categories delivers accelerated results. Steel mills using Book a Demo can see exactly which loss categories are dominating their OEE performance and which equipment classes represent the highest-value improvement targets.
The Six Big Losses in Steel Mill Operations: Understanding Your 28-Point OEE Gap
Unexpected equipment failures that stop production entirely — failed bearing, ruptured hydraulic line, electrical failure on a drive system, burner shutdown. Typical loss is 8-15 hours per month per major equipment item, costing $80K-250K in lost production per event.
Time spent preparing equipment for new product runs, adjusting mill parameters, calibrating sensors, or stabilizing product quality after a change. A rolling mill change-over can consume 2-4 hours of lost production while the process parameters stabilize.
Scheduled maintenance windows for preventive work, equipment overhauls, or inspections. Typical mills schedule 40-60 hours per month in planned maintenance — some necessary, some potentially deferrable with better predictive maintenance.
Brief interruptions from sensor faults, product jams, misfeeds, or control system glitches that stop production for 5 minutes to 30 minutes multiple times per shift. Cumulative loss across all minor stops frequently totals 3-6 hours per day on high-speed lines.
Running equipment below design capacity due to material constraints, quality issues, or partial equipment failures — rolling mill running at 85 tons/hour instead of design 100 tons/hour, or blast furnace operating at 90% draft rate. Loses 10-20% of theoretical capacity daily.
Production of out-of-spec material requiring rework, downgrade, or scrap — surface defects, dimensional variation, chemical composition variation, coating issues. Quality losses typically represent 1-5% of production — the easiest loss category to quantify and improve.
OEE Performance Benchmark Data: Where Your Steel Mill Stands and the Path to 85%
| Steel Equipment Class | Availability Target | Performance Target | Quality Target | Combined OEE Target | Annual Capacity Gain vs 72% OEE |
|---|---|---|---|---|---|
| Blast Furnace | 90-94% | 96-98% | 98-99% | 85-90% | 22-30% more iron production |
| Continuous Caster | 92-96% | 94-97% | 98-99.5% | 84-92% | 18-25% more ingot/bloom volume |
| Hot Rolling Mill | 88-92% | 92-95% | 97-98% | 80-87% | 16-22% more rolled steel |
| Cold Rolling Mill | 90-94% | 93-96% | 98-99% | 82-88% | 14-20% more cold rolled material |
| Galvanizing Line | 85-90% | 90-94% | 96-98% | 74-82% | 8-15% more coated capacity |
| Finishing Lines (Shearing, Packing) | 92-96% | 95-98% | 99-99.5% | 86-93% | 20-28% more finished output |
Four Operational Strategies That Deliver 13-18 Point OEE Improvement Within 12 Months
Unplanned downtime typically consumes 15-18% of available production time on a typical 72% OEE mill. Deploying predictive maintenance (condition monitoring + failure prediction) on the 5-8 highest-downtime equipment items shifts 50-70% of failures from reactive crisis to planned maintenance. A blast furnace that would normally experience 2-3 unexpected shutdowns annually can achieve near-zero unplanned stops when critical components (hot blast main valve, stove valves, tuyere blocks) are monitored and maintained on predicted failure timeline. The availability gain: 82% baseline → 88-90% target (8-point gain). When multiplied across all six loss categories, this 8-point availability improvement contributes 8 points directly to OEE. Sign Up Free to identify your highest-downtime equipment and start predictive maintenance tracking immediately.
Performance losses (12% baseline, 88% performance target) typically come from two sources: equipment running at reduced speed due to partial failures or constraint (bottleneck equipment, sensor faults), and inefficient changeovers that lose 2-4 hours per product change. By identifying the specific equipment, product transitions, and operating shifts where performance losses concentrate, maintenance and operations teams can focus intervention on bottleneck relief. If a continuous caster is the throughput bottleneck running at 85% capacity due to a thermal constraint, fixing the constraint (upgraded cooling system, improved refractory, optimized spray pattern) increases caster capacity to 95%+ and removes the bottleneck. The performance gain: 88% baseline → 94-96% target (6-point gain). For a typical 2M ton/year mill, a 6-point performance improvement increases annual output by 180K tons.
Quality losses typically represent only 1-3% of production value directly (scrap, rework), but they interact with availability and performance: a quality issue that forces production stop and rework sequence consumes availability time and performance losses time simultaneously. By deploying automated inspection systems (AI vision on hot table, cold rolling exit, or finishing lines), mills can detect quality issues in real time and segregate defective material immediately. The quality improvement: 99% baseline → 99.5-99.8% target (0.5-0.8 point gain). While this seems small compared to availability and performance gains, quality improvements often unlock availability and performance gains because they eliminate firefighting: when defect escapes are nearly zero, production planning becomes more reliable and equipment can operate at design capacity more consistently. The cumulative OEE impact: 0.5-3 points depending on quality rework patterns. Book a Demo to see how quality improvement integrates with availability and performance tracking.
OEE improvements are sustained only when real-time OEE tracking creates accountability: if operators and maintenance teams can see current shift OEE vs daily target, they actively work to eliminate minor losses. If OEE is only calculated monthly and reviewed quarterly, the connection between daily actions and results is invisible. By deploying digital dashboards showing hourly availability, performance, and quality metrics, combined with weekly reviews of loss trends, mills create the feedback loop that drives continuous improvement. Real-time visibility also enables rapid detection and correction of new loss patterns: if availability suddenly drops from 88% to 82% on a specific shift, the team immediately investigates and identifies the root cause before the pattern persists. OEE improvement programs with real-time tracking achieve results 40-50% faster than programs relying on historical data and monthly reporting. Steel mills using Sign Up Free can track OEE by shift, by equipment, by operator, and by loss category in real time.
The 12-Month OEE Improvement Implementation Roadmap
Steel Plant OEE Improvement: Frequently Asked Questions
How is OEE calculated and why does it matter for steel mills?
OEE = Availability × Performance × Quality, where Availability measures equipment uptime, Performance measures speed utilization, and Quality measures defect-free production. A 13-point OEE improvement (72% to 85%) increases production volume by 18-25% from existing equipment capacity, eliminating need for $15-30M capital investment.
What is the typical cost to implement an OEE improvement program?
Predictive maintenance systems cost $150K-400K depending on scope, automated inspection systems cost $80K-250K, and real-time OEE tracking software cost $20K-60K annually — total program cost typically $250K-700K for a 2M ton/year facility.
How long before an OEE improvement program delivers measurable results?
Availability improvements from predictive maintenance become visible within 4-8 weeks, performance improvements from bottleneck resolution within 2-3 months, quality improvements from automated inspection within 6-10 weeks — cumulative 13+ point OEE gains are typically achieved within 12-18 months.
Can smaller steel mills (under 500K tons/year) achieve 85%+ OEE?
Yes. OEE improvement principles are scalable — smaller mills face fewer equipment interdependencies and often achieve faster improvement velocity. A 300K ton/year mill can achieve 85%+ OEE with focused intervention on 3-4 critical equipment items and simplified predictive maintenance.
What role does operator training and culture change play in OEE improvement?
Cultural adoption is critical — operators who understand OEE targets and can see real-time progress actively work to reduce minor losses and support maintenance teams. OEE improvement programs with strong operator engagement achieve results 35-45% faster than technical-only programs.
How frequently should OEE be reviewed and updated?
Daily shift OEE review creates accountability and enables rapid loss-pattern identification; weekly equipment-level OEE tracking identifies trending issues; monthly loss-category analysis informs maintenance and operational decisions; quarterly business review measures progress toward annual improvement targets.
What is the financial ROI of achieving 85% OEE from a 72% baseline?
For a 2M ton/year facility, the 13-point OEE improvement increases output by 260K tons annually — generating $120-180M in additional revenue (assuming $460-700/ton), with program cost of $250-700K and annual software cost of $50-100K. Payback period is typically 2-4 weeks from go-live.
How do OEE improvements at individual equipment levels translate to plant-wide production gains?
Equipment-level OEE improvements only translate to plant production gains when the improved equipment is not the bottleneck — improving a non-bottleneck asset's OEE doesn't increase plant output. The OEE strategy must prioritize the bottleneck equipment first, then expand to other equipment classes after plant throughput is optimized.
Start Your OEE Improvement Program Today
OxMaint tracks availability, performance, and quality losses at the equipment level — identifying exactly which loss categories are holding back your steel plant OEE and which intervention will deliver the fastest improvement trajectory.