Your CMMS already contains the data that could unlock your Scope 3 emissions reduction strategy — the problem is that 87% of steel plant managers never analyze their supply chain data for carbon hotspots. Every supplier invoice, every raw material delivery, every transportation log your procurement team has processed over the past 24 months contains emissions patterns that repeat with statistical regularity across material types, supplier regions, and logistics routes. A 2025 study found that Scope 3 emissions account for approximately 70% of the total carbon footprint for Electric Arc Furnace (EAF) stainless steel production, with upstream raw material production driving roughly 80% of those emissions [citation:4]. The ferroalloy shipment from a supplier with 5.5 tons of CO₂ per ton of material is not a random variation — it is a pattern sitting in your procurement data right now, invisible because nobody has built the supply chain carbon analysis that surfaces it. Oxmaint's Scope 3 tracking module turns your procurement and logistics data into a supply chain emissions engine — automatically calculating upstream carbon footprints, flagging high-emission suppliers, and generating supplier engagement reports that drive decarbonization. The data is already yours, and the analysis that reduces your Scope 3 footprint takes minutes to configure, not months. If your steel plant is still treating Scope 3 emissions as an accounting exercise instead of a supply chain optimization opportunity, start a free trial or book a demo to see how Oxmaint surfaces Scope 3 reduction opportunities from your existing supply chain data.
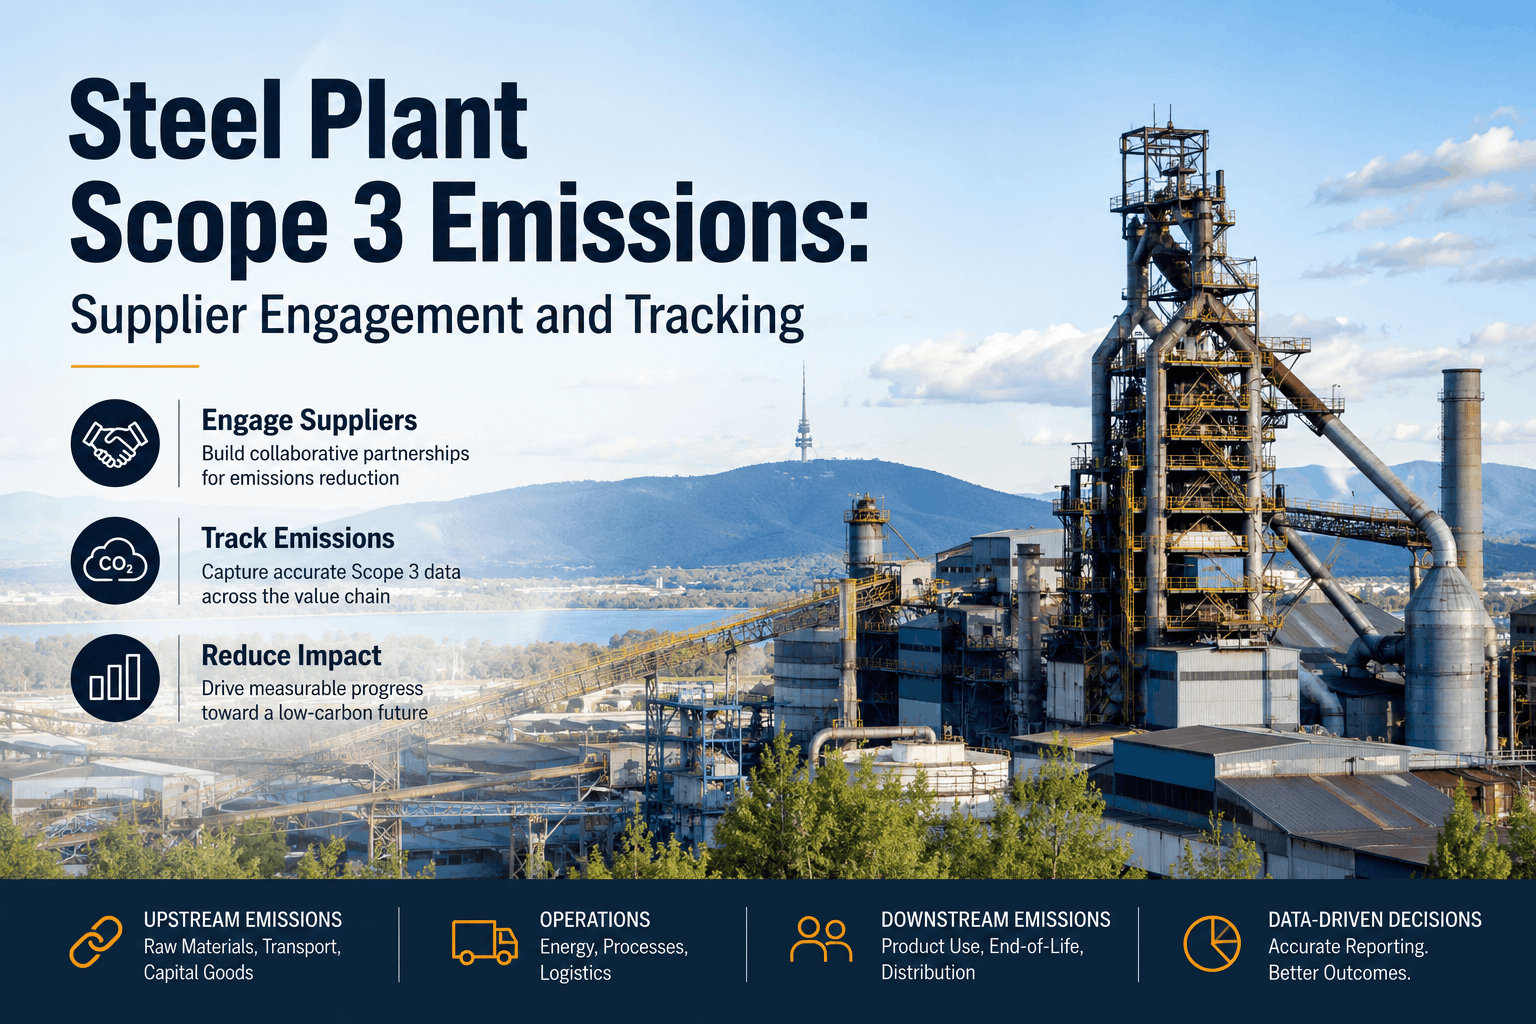
Steel Plant Scope 3 Emissions: Supplier Engagement and Tracking
Track and reduce Scope 3 emissions through supplier engagement — a comprehensive guide to supply chain carbon accounting, upstream emissions reduction, and supplier collaboration for steel plant decarbonization.
You Already Have the Supply Chain Data — You Just Need the Carbon Analysis
Every supplier invoice, material delivery, and logistics record in your procurement system is a carbon data point. Oxmaint does not require new sensors or carbon consultants — it analyzes the supply chain data you already collect and surfaces the Scope 3 reduction opportunities that drive decarbonization. Steel plant leaders ready to tackle Scope 3 emissions can start a free trial or book a demo to see how Scope 3 analysis works on your plant's actual supply chain data.
Why Scope 3 Emissions Are the Steel Industry's Defining Challenge
Scope 3 emissions are defined as all indirect emissions that occur in a company's value chain, excluding Scope 2 emissions from purchased energy. For the steel industry, Scope 3 emissions account for 60-80% of the total carbon footprint of a typical manufacturing enterprise [citation:11]. According to CDP, supply chain emissions in the materials sector can be, on average, over 11 times higher than a company's direct operational emissions [citation:4].
For Electric Arc Furnace (EAF) steelmaking — generally less carbon-intensive than primary production routes — Scope 3 emissions constitute approximately 70% of the total carbon footprint for stainless steel, with upstream raw material production driving roughly 80% of those emissions [citation:4]. The International Stainless Steel Forum reports that Scope 3 emissions can account for approximately 60% of the total carbon footprint for stainless steel, shifting the focus from the steel plant itself to its supply chain [citation:4].
The Scope 3 Hotspots in Steel Plant Supply Chains
Scope 3 emissions in steel plants originate from multiple upstream and downstream categories. The most significant hotspots are raw material production, transportation, and energy supply [citation:4].
Scope 3 Emissions Variation — The Supplier Differentiation Opportunity
A case study combining satellite data with supply chain models revealed significant variation in emissions across facilities and countries. The average electric arc furnace in the U.S. generates less than 1 metric ton of CO₂ for every ton of crude steel, while a blast furnace in India produces close to 4 tons [citation:1]. For one automotive component studied, embodied carbon varied by a factor of almost four depending on which U.S. steel mill was used [citation:1].
Steel production emissions vary dramatically by country based on production technology, grid carbon intensity, and fuel mix. U.S. EAF steel generates <1 t CO₂/t crude steel; Indian blast furnaces generate ~4 t CO₂/t [citation:1]. This creates immediate Scope 3 reduction opportunities through strategic supplier selection.
Even within the same country, individual steel facilities show significant emissions variation. Embodied carbon in automotive components varied by a factor of four depending on which U.S. steel mill supplied the material [citation:1]. Satellite data enables identification of low-emission facilities for strategic procurement.
Ferroalloy emission factors vary dramatically: Fe-Cr: 1.8-5.5 t CO₂/t; Fe-Mo: 3.16-14.79 t CO₂/t; Fe-Ni: ~6 t CO₂/t [citation:4]. The carbon footprint of ferronickel sourced in Indonesia is over four times higher than Canadian material [citation:10]. Supplier-specific emissions data enables informed procurement decisions.
The Regulatory Landscape — Why Scope 3 Tracking Is Now Mandatory
Three overlapping EU regulations are forcing steelmakers to treat procurement data as regulatory infrastructure. Together, they set a compliance baseline many current systems cannot meet [citation:10].
| Regulation | Requirement | Steel Plant Impact | Timeline |
|---|---|---|---|
| CSRD | Digital Scope 3 disclosures tied to specific materials and suppliers | Requires documented emissions data from tier-one and upstream suppliers | 2024-2026 |
| CBAM | Carbon price at point of import for iron and steel | Directly ties market access to transparent accounting of embodied emissions [citation:4] | 2026 (full implementation) |
| CSDDD | ESG due diligence beyond tier-one suppliers | Requires upstream visibility across the entire supply chain [citation:10] | 2027-2029 |
Supplier Engagement Strategies — Three Approaches to Scope 3 Reduction
For steelmakers looking to future-proof their business model, three approaches to tackling Scope 3 emissions have been identified [citation:6]. Each approach addresses a different dimension of supply chain decarbonization.
Leverage emissions data to select suppliers with lower carbon footprints. Satellite data combined with supply chain models enables identification of emissions hotspots and low-emission facilities [citation:1]. Companies can use facility-level emissions data to guide procurement strategies that reduce Scope 3 emissions. Platforms like Metalshub integrate emissions and ESG data directly into procurement workflows [citation:10].
Work with suppliers to reduce emissions through shared investments and technology adoption. A cooperative game-theoretic model showed that full coalition formation between suppliers, manufacturers, and distributors generated the highest net payoff ($1.89 million), with the manufacturer as the major beneficiary (97.6%) [citation:11]. Collaborative governance, enhanced circularity, optimized logistics, and renewable energy integration collectively offer a high-impact pathway for Scope 3 decarbonization [citation:9].
Higher scrap quality and increased recycled content can significantly decrease upstream embodied emissions [citation:11]. The Scrap Quality Index (SQI) and Material Circularity Index (MCI) demonstrate that scrap quality directly impacts upstream carbon footprint. Enhanced scrap quality and increased recycled content deliver measurable emissions reductions [citation:9].
Best Practices for Supplier Engagement on Scope 3
Leading steel companies are adopting specific practices to engage suppliers on Scope 3 emissions reduction. These practices create transparency, drive improvement, and build competitive advantage [citation:2][citation:10].
Implement supplier sustainability scoring systems that evaluate ESG performance and carbon transparency. One Indonesian steel manufacturer partnered with a platform to access vendor databases with transparent sustainability and ESG scores, building a roster of partners aligned with their net-zero pathway [citation:2].
Procurement teams must be able to compare offers by carbon intensity and generate audit-ready documentation that meets disclosure standards [citation:10]. Verified transaction data for flat steel products with embedded emissions below 800-1000 kg CO₂e/t have shown price premiums of €100-300 per tonne [citation:10].
WWF's Toolkit for the Procurement of Lower Emission Steel empowers corporate buyers with strategies to accelerate steel industry decarbonization [citation:7]. With over 70% of the world's blast furnaces approaching reinvestment age by 2030, corporate procurement decisions can be a major force in shifting the industry onto a 1.5°C-compatible path [citation:7].
Implementing Scope 3 Tracking — A Step-by-Step Framework
Implementing Scope 3 emissions tracking requires a structured approach that builds on existing procurement and logistics data. The framework below provides a step-by-step process for Scope 3 quantification and reduction [citation:11].
Collect primary operational data from upstream suppliers, midstream manufacturing operations, and downstream distributors using transport logs, meter-based energy records, scrap inspection sheets, and structured stakeholder interviews [citation:11]. Establish a comprehensive Scope 3 inventory across all 15 categories defined by the GHG Protocol.
Apply Environmental Value Stream Mapping (EVSM) coupled with life-cycle emission accounting to identify carbon-intensive hotspots across the supply chain [citation:11]. EVSM integrates lean manufacturing principles with environmental metrics to evaluate each activity's carbon impact and identify priority intervention points [citation:9].
Use cooperative game theory to model abatement opportunities for suppliers, manufacturers, and distributors [citation:11]. Shapley value allocation ensures fair distribution of emission reduction responsibilities and burdens across the supply chain [citation:9].
Track Scope 3 emissions reductions through continuous data collection and supplier performance monitoring. Generate audit-ready reports for CSRD, CBAM, and other regulatory disclosures. Document progress against Scope 3 reduction targets and communicate performance to stakeholders [citation:10].
ROI of Scope 3 Emissions Tracking and Reduction
Verified low-emission steel products command €100-300 per tonne premium over standard benchmarks — a 35-50% increase [citation:10]
Cooperative game-theoretic model shows full coalition formation between suppliers, manufacturers, and distributors generates highest net payoff [citation:11]
Shapley value allocation confirms manufacturer as major beneficiary of collaborative Scope 3 abatement [citation:11]
Scope 3 tracking and reduction programs typically pay for themselves within 6-12 months through green premiums, avoided CBAM costs, and improved supplier performance
Frequently Asked Questions
What are Scope 3 emissions in the steel industry?+
What is the biggest Scope 3 emissions driver in steel production?+
How can I start tracking Scope 3 emissions in my steel plant?+
What are the regulatory drivers for Scope 3 reporting in steel?+
Your Scope 3 Reduction Opportunities Are Already in Your Supply Chain Data — Find Them Before Your Competitors Do
Every supplier invoice, material delivery, and logistics record in your steel plant contains the data needed to identify Scope 3 reduction opportunities. Oxmaint's Scope 3 tracking module analyzes your supply chain data against industry benchmarks, identifies emissions hotspots automatically, and generates supplier engagement strategies that reduce your carbon footprint. No carbon consultants. No manual spreadsheets. Import your data, identify your hotspots, and start reducing Scope 3 emissions in your first 30 days.