In steel manufacturing, the gap between a process that is technically within specification and a process that is statistically under control is the gap between reactive quality management and predictive quality management. A hot strip mill producing coils that pass dimensional inspection today while running a backup roll bearing at 3.1× baseline vibration is a mill trending toward a quality escape — and a standalone quality system that is not integrated with CMMS condition monitoring data will not see it coming. Statistical process control provides the analytical framework; CMMS integration provides the equipment context that converts an SPC alarm from a signal into a root cause. Book a demo to see how OxMaint's Analytics & Reporting connects SPC quality variables, roll wear records, and equipment condition data across casting, rolling, and finishing operations.
Quality & Process Optimization · Steel Plant · Analytics & Reporting
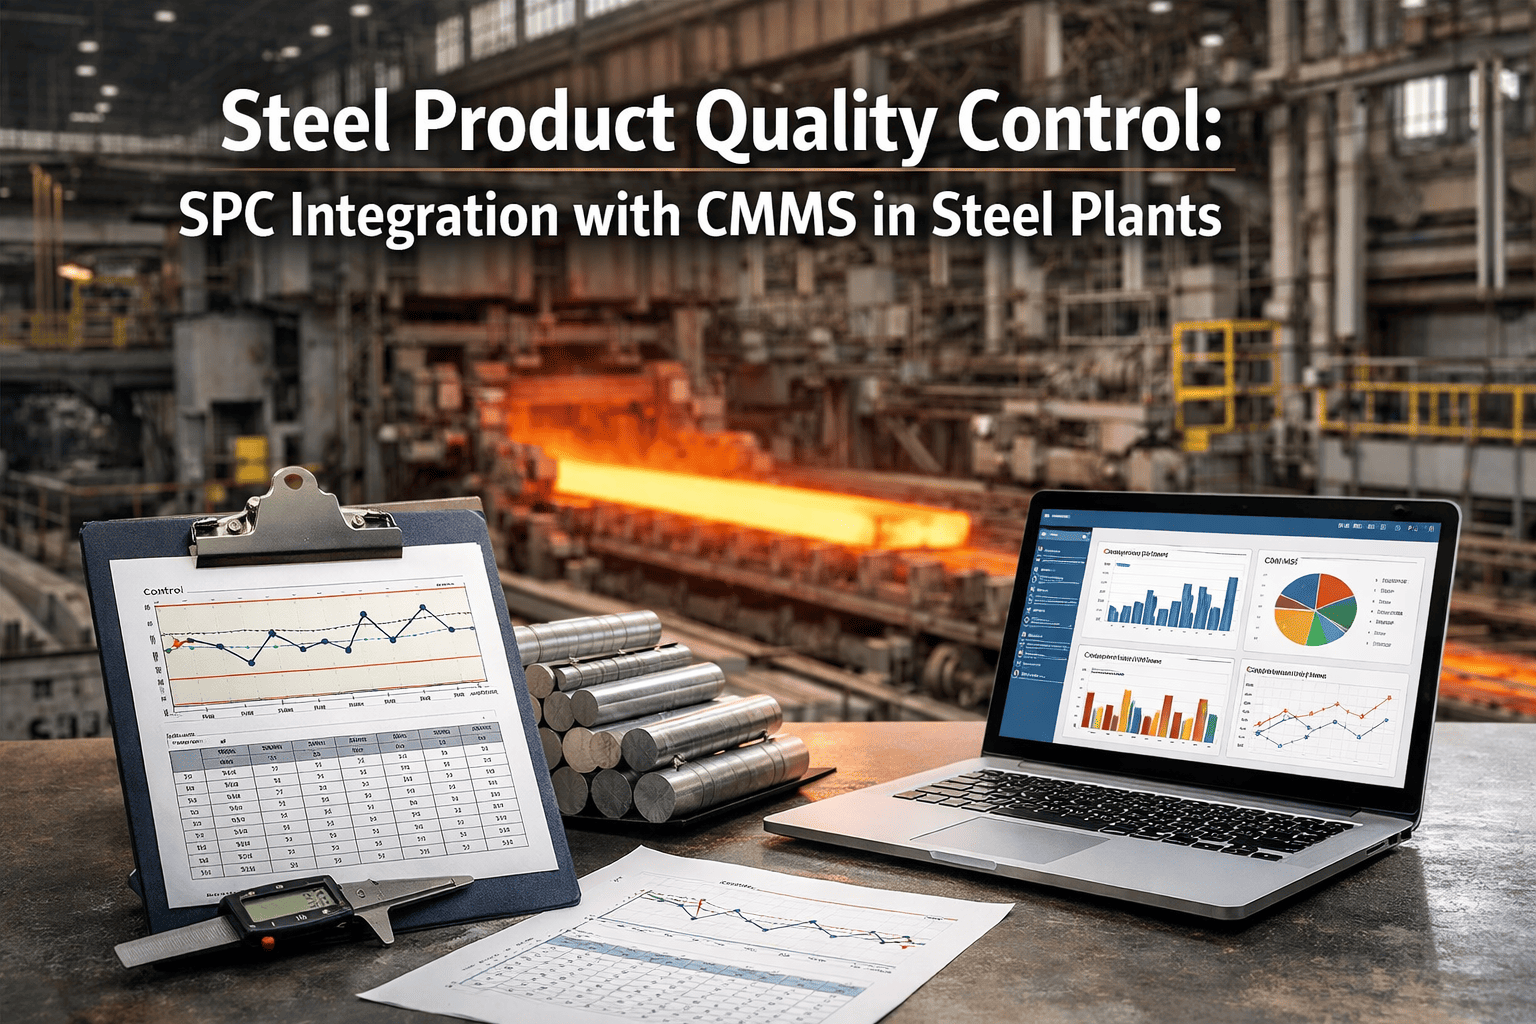
Steel Product Quality Control: SPC Integration with CMMS in Steel Plants
Process capability tracking, Western Electric rule monitoring, roll wear correlation, and defect root cause linkage — an integrated quality management framework for hot rolling, cold rolling, casting, and finishing in integrated and EAF steel plants.
Cpk >1.33
Process capability minimum for automotive & critical grades
±0.02 mm
Hot strip mill thickness tolerance requiring continuous SPC monitoring
8 Rules
Western Electric alarm rules — any violation indicates assignable cause
<200 ppm
Customer rejection rate target for standard flat-rolled steel grades
01 — Control vs Specification Limits
02 — SPC Chart Selection
03 — CMMS Integration Points
04 — Process Area Reference
05 — Defect Correlation
06 — Quality KPIs
Section 01
Control Limits vs Specification Limits: The Distinction That Defines Your Quality Programme
The most consequential conceptual error in steel plant quality management is using specification limits as if they were control limits. Specification limits define the acceptable range of a product characteristic — they are defined by the product standard, the customer order, or both. Control limits are calculated from the actual statistical variation of the process itself, typically set at ±3 standard deviations from the process mean, and indicate whether the process is in a state of statistical control. These are fundamentally different things.
A process operating within specification limits can be statistically out of control. Seven consecutive thickness measurements above the process mean, all still within tolerance, satisfy the specification but violate Western Electric Rule 2 — indicating a sustained process shift whose cause has not been identified and which is trending toward an out-of-specification condition. A quality programme that only monitors whether products pass specification limits will not detect this pattern. A programme using control limits will detect it three to five roll passes before the product goes out of specification. In steel terms, that is the difference between catching a roll wear or bearing degradation issue before a customer escape and after one.
Key principle: Process capability index (Cpk) measures how well the process is centred within specification limits relative to its natural variation. Cpk >1.33 means 6-sigma capability — the process could shift 1.5 sigma toward either spec limit and still maintain <3.4 ppm defect rate. Cpk <1.0 means the process cannot reliably meet spec without 100% inspection. Both Cpk and its trend over roll campaigns must be tracked — a declining Cpk from 1.45 to 1.28 across four campaigns is an actionable signal even if no single campaign is below target.
Section 02
SPC Chart Type Selection for Steel Plant Applications
The correct chart type depends on how quality data is collected, the subgroup structure available, and whether the variable of interest is continuous (dimensional, mechanical) or discrete (defect count, proportion defective). Using the wrong chart type for the data structure produces incorrect control limits and generates either excessive false alarms or missed out-of-control conditions — both of which erode confidence in the SPC system.
X̄-R Chart
Subgroup means + ranges
Best for: Thickness sampling across coil length, yield strength batch testing. Subgroup size n = 3–8. Most sensitive chart for detecting small process shifts.
Hot strip thickness · Cold mill gauge · Plate thickness
X̄-S Chart
Subgroup means + std deviations
Best for: Larger subgroups (n >10), coating weight testing, chemistry analysis. Better estimate of within-subgroup variation than R chart at larger n.
Coating weight · Chemistry per heat · Mechanical properties per batch
I-MR Chart
Individual values + moving range
Best for: Slow process variables where subgrouping is not practical. Single coil properties, heat chemistry where one value per heat is generated.
Heat chemistry · Reheat furnace temperature · Single-slab measurements
p-Chart / np-Chart
Proportion or count defective
Best for: Proportion of defective units per lot. p-chart when subgroup size varies; np-chart when subgroup size is constant.
Scarfing requirement rate · Surface inspection rejection rate · Slab defect proportion
c-Chart / u-Chart
Defect count per unit
Best for: Counting discrete defects per unit or per unit area. c-chart for constant inspection area; u-chart when area inspected varies.
Surface defects per coil · Inclusions per m² plate · Weld defects per metre
Section 03
CMMS Integration: Four Points That Deliver Diagnostic Value
Standalone SPC detects statistical anomalies. CMMS integration identifies their equipment cause. The four integration points below deliver the highest return because they connect the most common equipment-driven quality failure modes to the maintenance data that explains them.
01
Roll Change and Wear Tracking
Every roll change resets the SPC baseline for thickness, crown, and surface quality — roll wear between changes produces predictable quality drift that SPC detects before the roll change threshold is reached. CMMS integration provides the roll age (tonnes since last change), wear profile measurement history, and roll change log that allows the quality engineer to determine whether an SPC trend is wear-driven and at what point in the roll campaign the quality metric began deteriorating. Post-roll-change quality events — the elevated defect risk in the first 200–400 tonnes after a new roll set — are tracked per stand and campaign.
02
Bearing Condition Monitoring Correlation
Work roll and backup roll bearing degradation produces both vibration signatures and dimensional quality effects — typically appearing in SPC data as a gradually increasing process mean deviation or variance increase days before the bearing failure event registers in the condition monitoring system as a threshold alarm. Integrating bearing vibration trend data with thickness SPC charts produces a bivariate view where the quality effect and the mechanical cause are visible on the same timeline, enabling predictive quality intervention rather than post-failure investigation.
03
Maintenance-Induced Quality Variation
The period immediately following major maintenance is statistically the highest-risk production period. A bearing replacement that introduces a small misalignment, a hydraulic system service that leaves residual air in the AGC circuit, or a roll gap recalibration that has not fully settled all produce quality shifts that SPC will detect within a few coils. CMMS integration means every major work order completion automatically flags the subsequent production for enhanced SPC monitoring — the quality system knows which coils follow which maintenance events without manual annotation.
04
Planned Maintenance Window Alignment
Aligning roll change schedules, major bearing replacements, and descaler maintenance windows with production scheduling minimises the quality transition periods that occur during equipment changeover. CMMS-SPC integration enables the quality and maintenance planning teams to share a common view of which quality variables are approaching control limit violations and which maintenance interventions are most likely to stabilise them — converting reactive quality-maintenance interaction into coordinated quality planning.
Connect SPC quality variables to roll wear records, bearing condition data, and work order history — so every alarm arrives with its equipment context already surfaced.
Section 04
Control Chart Applications by Process Area
Continuous Caster
Controlled variables: Slab thickness, width, surface crack density, oscillation mark depth, bulging
Charts: X̄-R (dimensional) · u-chart (surface defects per slab)
Equipment drivers: Mould taper wear, oscillation frequency, secondary cooling flow uniformity, strand guide roll condition
CMMS link: Mould copper wear log, oscillator PM records, spray nozzle inspection history
Hot Strip Mill — Finishing Train
Controlled variables: Strip thickness (±0.02mm), width, crown, flatness, finishing temperature profile
Charts: X̄-R (thickness) · X̄-S (flatness) · I-MR (temperature)
Equipment drivers: Work roll thermal crown, backup roll wear and bearing condition, looper load cell accuracy, coiler tension
CMMS link: Roll schedule and wear tracking, bearing vibration history, looper calibration log, coiler PM
Cold Rolling Mill
Controlled variables: Strip thickness (±0.005mm), flatness (I-units), surface roughness (Ra µm), strip tension
Charts: X̄-R at 100% coverage (thickness) · u-chart (flatness defects per coil)
Equipment drivers: Work roll crown, roll force distribution, emulsion system concentration and temperature
CMMS link: Roll crown measurement log, emulsion concentration records, roll force actuator calibration
Galvanising / Coating Line
Controlled variables: Zinc coating weight (g/m²), coating uniformity, bath chemistry, surface appearance grade
Charts: X̄-R (coating weight per sample) · p-chart (surface defects per coil)
Equipment drivers: Air knife gap and pressure uniformity, zinc bath chemistry, pot roll and snout condition
CMMS link: Air knife setup records, bath chemistry log, pot roll inspection and change history
Section 05
Defect Classification and Equipment Cause Correlation
| Defect Category |
Defect Type |
Primary Equipment Cause |
SPC Detection Method |
| Dimensional |
Thickness deviation |
Roll gap control failure, AGC drift, work roll thermal expansion, backup roll bearing wear |
X̄-R chart thickness — Rule 1 (single point beyond 3σ) for sudden events; Rule 2 (7+ consecutive points same side) for drift |
| Crown & flatness |
Work roll thermal crown deviation, backup roll contour wear, coolant distribution uniformity |
X̄-S flatness chart — variance increase detectable before visible product defect |
| Camber (steering) |
Roll gap tilt, work roll end wear differential, drive torque imbalance between drive and operator sides |
I-MR chart on tilt measurement — sustained offset indicates mechanical asymmetry |
| Surface |
Roll marks / imprints |
Work roll surface damage, foreign material embedded in roll, cobble-induced roll bruising |
u-chart defect count per coil — sudden increase indicates roll damage event with assignable cause |
| Scale pits |
Descaler pressure insufficient (<180 bar), nozzle blockage, furnace atmosphere causing heavy scale |
p-chart surface rejection rate — systematic increase correlates with descaler PM overdue |
| Longitudinal scratches |
Guide or table roller surface damage, coiler wrapper roll condition, strip path obstruction |
u-chart — location of scratch within coil indicates which table section is the cause |
| Mechanical |
Yield / tensile out of spec |
Finishing temperature deviation, coiling temperature deviation, TMCP cooling rate uniformity |
X̄-R mechanical properties per heat — control limits from historical by-grade process data |
| Elongation failure |
Reduction ratio deviation, reheat furnace temperature uniformity, accelerated cooling uniformity |
I-MR chart per heat — furnace maintenance records provide assignable cause context |
Section 06
Quality KPIs for SPC-CMMS Integrated Steel Plant Analytics
Process Capability (Cpk)
Target: >1.33 (automotive) · >1.0 (standard)
Calculated per product grade and process area. Track trend across campaigns — 0.05 Cpk decline per campaign is an actionable leading indicator requiring root cause investigation before threshold breach.
OxMaint: Cpk trend chart per grade with campaign markers and maintenance event overlay
SPC Alarm Rate
Target: <5 Western Electric violations per 1,000 data points
Count of rule violations by chart type and process area per time period. High Rule 2 frequency indicates sustained equipment degradation; high Rule 1 frequency indicates intermittent acute events (roll damage, actuator fault).
OxMaint: Alarm frequency by rule type and chart, with CMMS maintenance event correlation per alarm
First-Pass Quality Rate
Target: >96% flat products · >98% coated products
Coils / slabs / plates passing all quality criteria on first inspection without rework, re-rolling, or downgrade. Track separately for post-roll-change product vs mid-campaign product to identify roll change procedure quality impact.
OxMaint: First-pass rate by product type and roll campaign position; post-change vs mid-campaign comparison
Customer Rejection Rate (ppm)
Target: <200 ppm standard · <50 ppm automotive grades
Tonnes rejected or returned by customers per million tonnes shipped. Linkage to in-process SPC history per rejection lot identifies which process area and which maintenance interval the quality escape originated from.
OxMaint: Customer rejection trend per grade, linked back to in-process SPC records for the specific production lot
Expert Review
What Steel Plant Quality Engineers Say
01
The integration that changed our quality investigation process most was connecting backup roll bearing vibration trends to the finishing mill thickness SPC chart. Before integration, a Rule 2 violation took two to three hours to root-cause. After connecting the CMMS vibration records, the same violation surfaced the relevant bearing trend data automatically — and in four out of five cases identified the cause while product was still on the mill rather than in the warehouse awaiting disposition.
Marcus Eidenschink, B.Eng, CRL · Quality & Reliability Systems Manager, voestalpine · 21 Years Hot Strip Mill Quality Engineering
02
Cpk trend monitoring across roll campaigns is what separates a quality programme from a quality reporting function. A Cpk of 1.38 today is not meaningful without context — but a Cpk declining from 1.65 to 1.38 over four campaigns, correlated with bearing condition data showing increasing running temperature on the drive-side backup roll, is an actionable prediction. Setting trend alerts at 0.05 Cpk degradation per campaign in OxMaint gives us three to four campaigns of lead time to address the root cause before the automotive grade specification is at risk.
Olusegun Adeyemi, MSc, CEng MIChemE · Process Quality Engineer, ArcelorMittal · 17 Years SPC and Process Capability Management in Steel
03
Post-roll-change quality events are the most preventable source of customer escapes in flat-rolled steel. The first 200 to 400 tonnes after a roll change are statistically the highest-risk product in the campaign — thermal crown is establishing, AGC is adapting to the new roll profile, and the roll surface is bedding into the strip pass line. Tracking first-pass quality rate separately for post-change product in OxMaint showed an 11% quality rate gap versus mid-campaign product. A specific roll change procedure revision closed that gap by 60% in one quarter.
Kenji Watanabe, Dr.Eng · Senior Flat Products Quality Engineer, POSCO Technical Research · 24 Years Rolling Mill Quality Control and SPC
FAQs
Frequently Asked Questions
How are SPC control limits established and when should they be recalculated in steel plant operations?
Control limits must be calculated from production data collected while the process is in statistical control — not from specification limits. The Phase 1 SPC study approach requires 25–30 subgroups of data from stable production runs. In steel plant practice, control limits for thickness, crown, and flatness should be recalculated at each major roll change type (new backup roll set), after any significant equipment modification, and at minimum quarterly. Process mean drift due to roll wear means that limits calculated from the beginning of a roll campaign do not accurately represent the process midway through — many plants use campaign-relative limits that reset at each roll change for wear-sensitive variables.
OxMaint stores the full quality data history per product grade enabling Phase 1 baseline recalculation from production records.
Which Western Electric SPC rules are most diagnostically useful for rolling mill applications?
Rules 1 and 2 are the highest-value for rolling mills. Rule 1 (any point beyond 3-sigma) indicates a sudden shift — typically assignable to a specific equipment event such as a roll mark, an AGC actuator fault, or a bearing failure. Rule 2 (9 consecutive points same side of centreline) indicates sustained shift — most commonly correlates with roll wear reaching a threshold, gradual bearing degradation, or reheat furnace temperature profile drift. Rule 5 (two of three consecutive points beyond 2-sigma) is useful for detecting accelerating wear or temperature trends before they reach 3-sigma. Rules indicating stratification or mixture are important for detecting measurement system issues or multiple product populations being mixed on the same chart.
Book a demo to see OxMaint's Western Electric rule implementation across steel process SPC charts.
Can OxMaint integrate with existing L2/L3 process automation systems for automatic SPC data import?
Yes. OxMaint connects to Level 2 process automation systems and process historians (including OSIsoft PI, Wonderware, and standard OPC-UA / REST API interfaces) to import process quality variables automatically, without manual data entry. Thickness gauge readings, coiling temperature records, and surface inspection system outputs can all feed directly into OxMaint's SPC charts in near real-time. CMMS records (work orders, PM completions, vibration readings) are stored natively in OxMaint, enabling the correlation between quality data imported from L2 and maintenance records maintained in OxMaint's CMMS module within the same analytics environment.
SPC Data Without Maintenance Context Is Half the Answer.
OxMaint's Analytics & Reporting connects your process quality variables to roll wear records, bearing condition trends, and work order history — so every SPC alarm arrives with the equipment context needed to find the root cause while product is still on the mill, not in the warehouse awaiting disposition.