When Midwest Steel Corporation faced mounting customer complaints and a 4.2% reject rate that threatened their automotive supply contracts, they knew incremental improvements wouldn't be enough. Their quality data lived in spreadsheets, defect tracking was manual, and root cause analysis took weeks. Within 18 months of implementing a digital quality control system , they achieved a 0.8% reject rate, saved $2.3 million annually, and became a preferred supplier for two major OEMs.
This case study examines how three steel plants—each facing different challenges—transformed their quality performance using digital quality management systems. Their experiences offer a roadmap for any steel producer seeking to move from reactive firefighting to proactive quality excellence.
Three Plants. Three Challenges. One Solution.
Midwest Steel Corp
High reject rates threatening automotive contracts
Pacific Rolling Mills
Surface defects causing excessive downgrades
Atlantic Specialty Steel
Slow root cause analysis delaying corrective action
Midwest Steel Corporation
Integrated flat products producer | 1.2M tons annual capacity | Automotive & construction markets
The Challenge
Midwest Steel faced a quality crisis in 2022. Their reject rate had climbed to 4.2%—well above the 1.5% threshold their automotive customers demanded. Customer complaints increased 340% year-over-year, and they received formal warnings from two major OEMs threatening to remove them from approved supplier lists.
The Solution
Midwest Steel implemented a comprehensive digital quality control system with four key components:
Centralized Quality Database
All inspection data, test results, and defect records consolidated into a single platform with complete coil-level traceability.
Real-Time SPC Dashboards
Live statistical process control monitoring at every critical process step with automatic alerts when parameters drift.
Automated Defect Classification
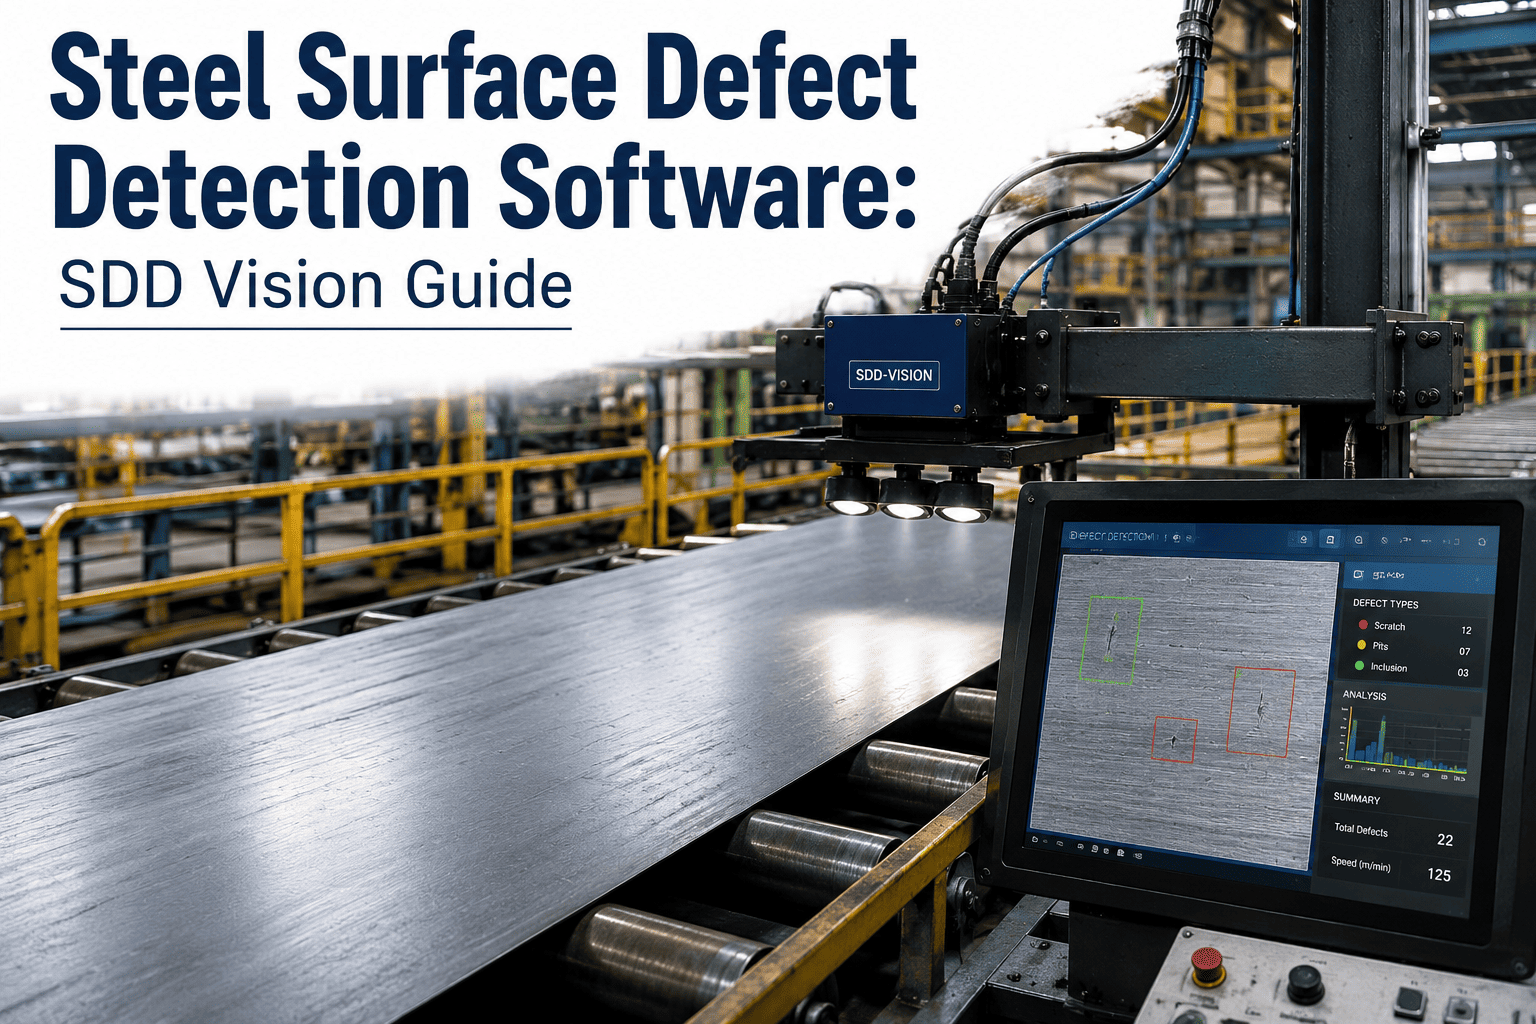
AI-powered defect recognition that categorizes and logs defects consistently, eliminating inspector subjectivity.
Integrated CAPA Workflow
Digital corrective action system that tracks issues from detection through resolution with accountability at every step.
The Results
"The digital quality system gave us visibility we never had before. For the first time, we could see patterns across shifts, lines, and products. Problems that had plagued us for years became obvious—and solvable."
Ready to Transform Your Quality Performance?
See how Oxmaint's digital quality control platform can deliver similar results for your steel operation.
Pacific Rolling Mills
Hot and cold rolling complex | 800K tons annual capacity | Appliance & construction markets
The Challenge
Pacific Rolling Mills' primary challenge wasn't outright rejects—it was downgrades. Surface defects on their cold-rolled and galvanized products forced them to sell 23% of production at lower-margin secondary grades, costing millions in lost revenue annually.
The Solution
Pacific Rolling Mills deployed a surface quality management system focused on early detection and process correlation:
Automated Surface Inspection
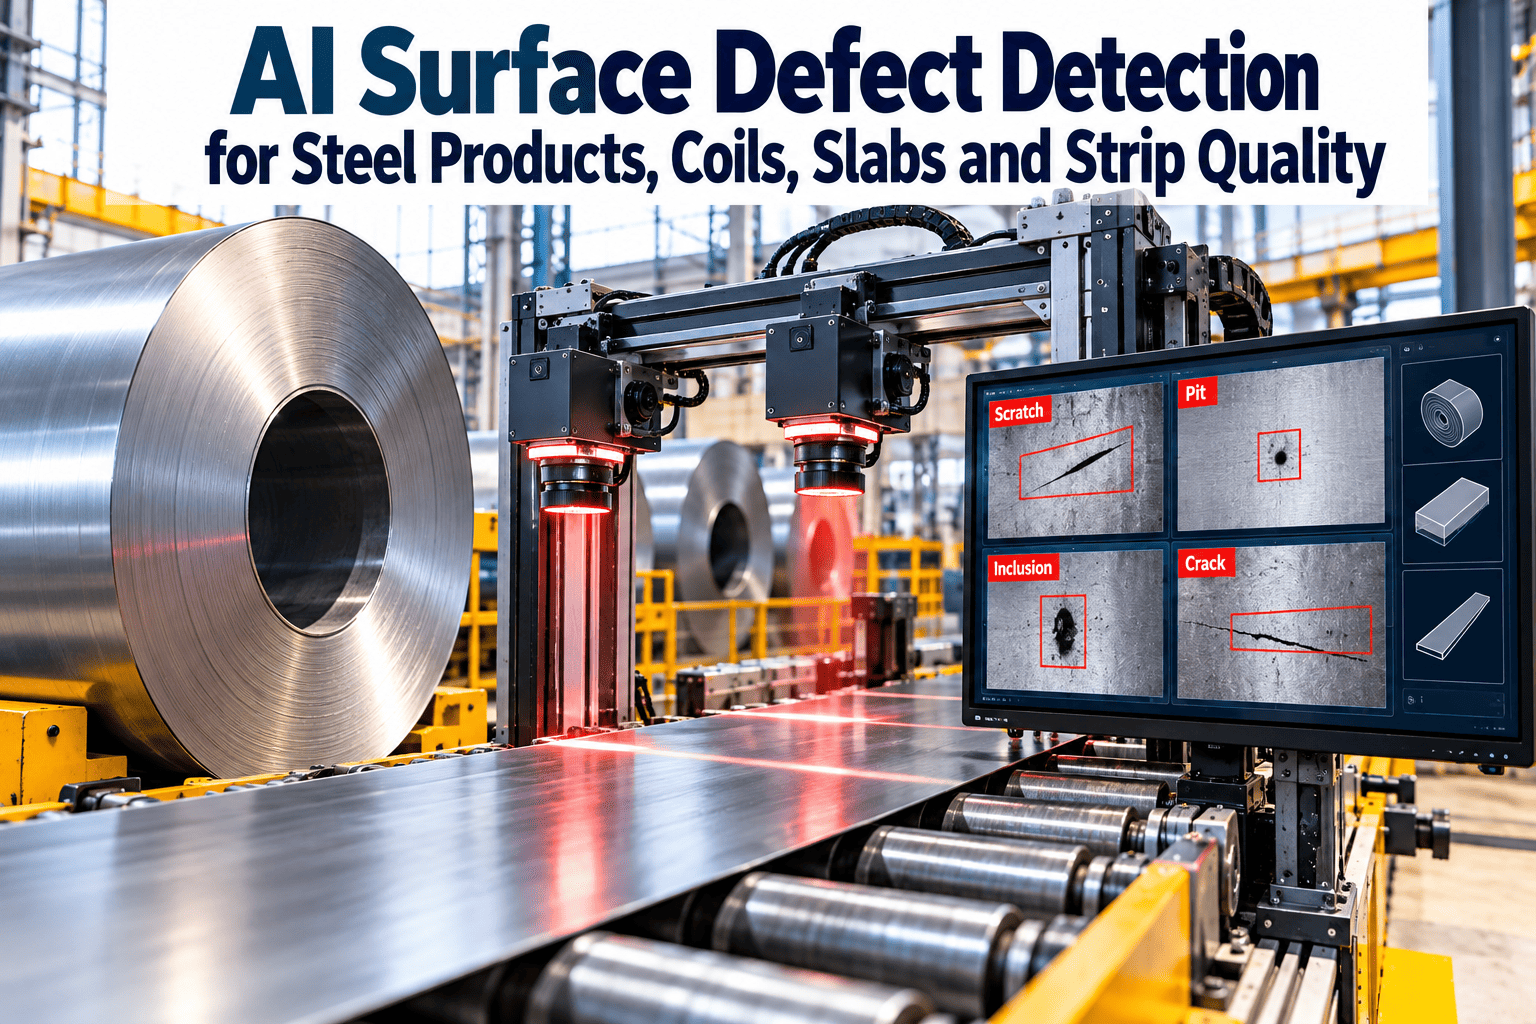
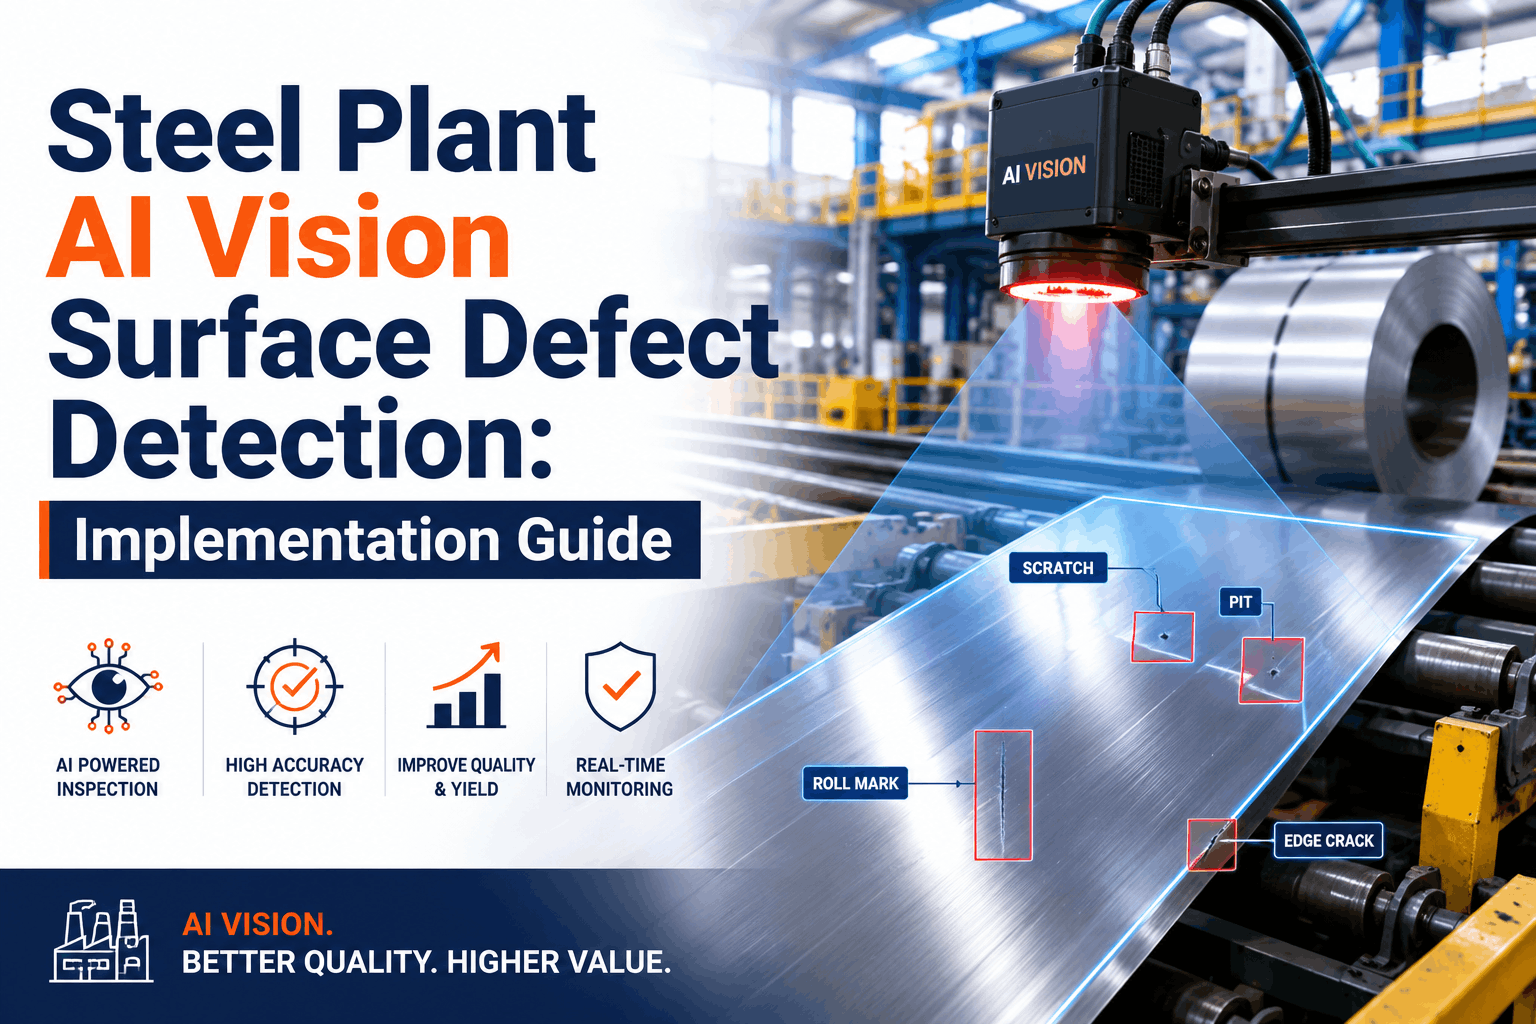
High-speed cameras at hot mill exit, cold mill exit, and coating line with AI-based defect detection and classification.
Through-Process Defect Tracking
Defect maps that follow each coil through processing, enabling correlation of downstream defects with upstream conditions.
Process Parameter Integration
Quality data linked to all process parameters (temperature, tension, speed, chemistry) for multivariate analysis.
Predictive Quality Alerts
ML models that predict surface quality issues before they occur, enabling proactive process adjustment.
The Results
"We discovered that 70% of our surface defects originated in the hot mill—but we were only finding them after coating. Once we could see defects in real-time and trace them back, the solutions became obvious."
Atlantic Specialty Steel
Specialty long products | 400K tons annual capacity | Aerospace, energy & medical markets
The Challenge
For Atlantic Specialty Steel, quality wasn't optional—their aerospace and medical customers required full traceability, certified test results, and rapid response to any quality concern. Their paper-based system couldn't keep up with customer audit requirements or internal improvement needs.
The Solution
Atlantic Specialty Steel implemented a quality traceability and documentation system designed for regulated industries:
Complete Heat Traceability
Every piece tracked from melt shop through finishing with full genealogy including all processing parameters and test results.
Automated Certificate Generation
Mill test reports generated automatically from verified data, with digital signatures and tamper-proof audit trails.
One-Click Quality Inquiry Response
Instant access to complete production history for any piece, enabling rapid response to customer questions.
Specification Management
Digital specification library with automatic compliance checking against customer and industry requirements.
The Results
"We went from dreading customer audits to welcoming them. Auditors are impressed when we can pull complete heat history in seconds. It's become a competitive advantage—customers trust our quality system."
Common Success Factors
Across all three implementations, several factors consistently contributed to success. Talk to our implementation team about how these apply to your operation.
Executive Sponsorship
Quality transformation requires top-down commitment. All three plants had C-level champions who made quality a strategic priority, not just a compliance checkbox.
Data Integration
Quality data alone isn't enough—it must connect to process data, maintenance data, and production data. Integration enables root cause analysis that isolated systems can't support.
Phased Implementation
None tried to boil the ocean. Each started with highest-impact areas, proved value quickly, then expanded. Quick wins built momentum and stakeholder confidence.
Operator Involvement
Systems designed with operator input and training saw faster adoption and better data quality. Operators became quality advocates rather than reluctant users.
Implementation Timeline
While every plant is different, these case studies followed similar implementation phases. Oxmaint's implementation team guides you through each stage.
Discovery & Planning
Configuration & Integration
Pilot & Validation
Rollout & Optimization
ROI Summary
Digital quality control systems typically deliver ROI within 6-12 months through multiple value streams. Get a customized ROI projection for your operation.
Start Your Quality Transformation
Join the growing number of steel plants achieving breakthrough quality performance with digital quality control systems.
Frequently Asked Questions
How long does implementation typically take?
Most implementations achieve initial go-live within 12-16 weeks, with full rollout completed by 24 weeks. The timeline depends on scope, data source complexity, and internal resource availability. Phased approaches allow you to see value quickly while building toward comprehensive coverage. We recommend starting with 1-2 high-impact areas rather than trying to implement everything at once.
What systems does digital quality control need to integrate with?
Typical integrations include Level 2 process control systems (for process parameters), laboratory information systems (for test results), MES (for production context), and ERP (for order and customer data). Modern platforms use standard protocols (OPC-UA, REST APIs, database connectors) that work with virtually any data source. The key is accessing data—not replacing existing systems.
What if our current data quality is poor?
This is actually one of the biggest benefits of digital quality systems—they expose and help fix data quality issues. The implementation process includes data validation and cleansing. Going forward, automated data collection eliminates manual entry errors, and validation rules catch problems at the source. Most plants see significant data quality improvement within the first few months.
How do we get operators to actually use the system?
Adoption depends on three factors: ease of use (intuitive interfaces designed for shop floor use), clear value (operators see how it helps them do their jobs better), and proper training. The case study plants involved operators in design, provided hands-on training, and celebrated early wins. When operators see problems solved faster, they become advocates rather than resistors.
Can we start small and expand later?
Absolutely—this is the recommended approach. Start with one production line, one defect type, or one customer segment. Prove value, refine processes, build internal expertise, then expand. The platform architecture supports this growth path. All three case study plants started with focused pilots before rolling out plant-wide.