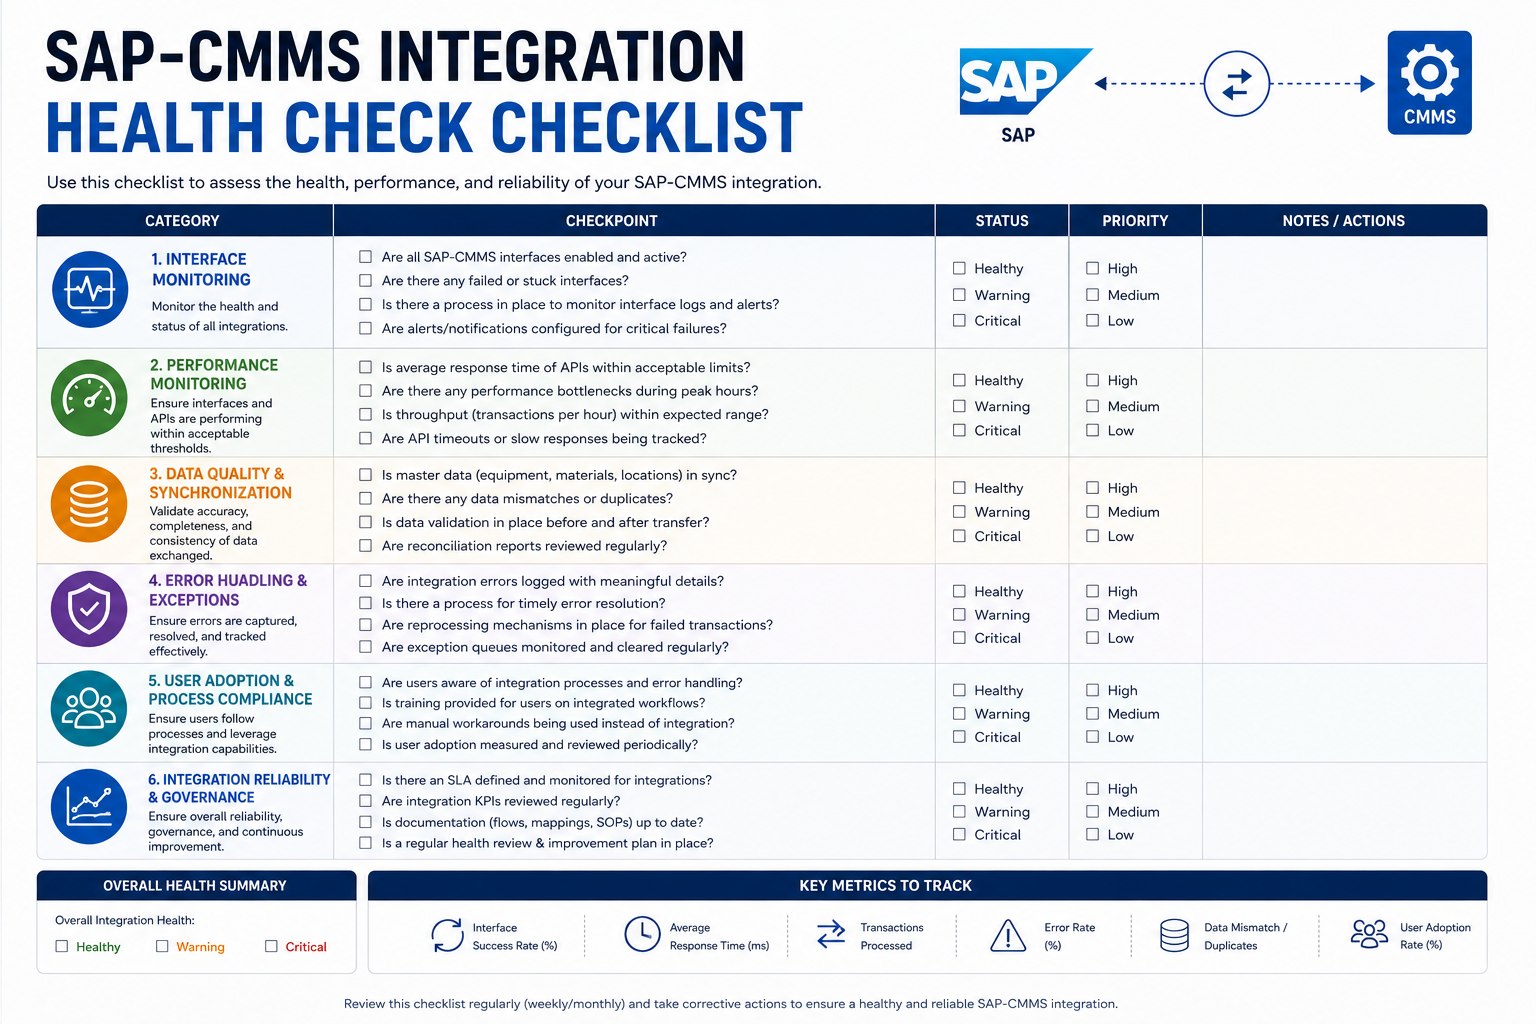
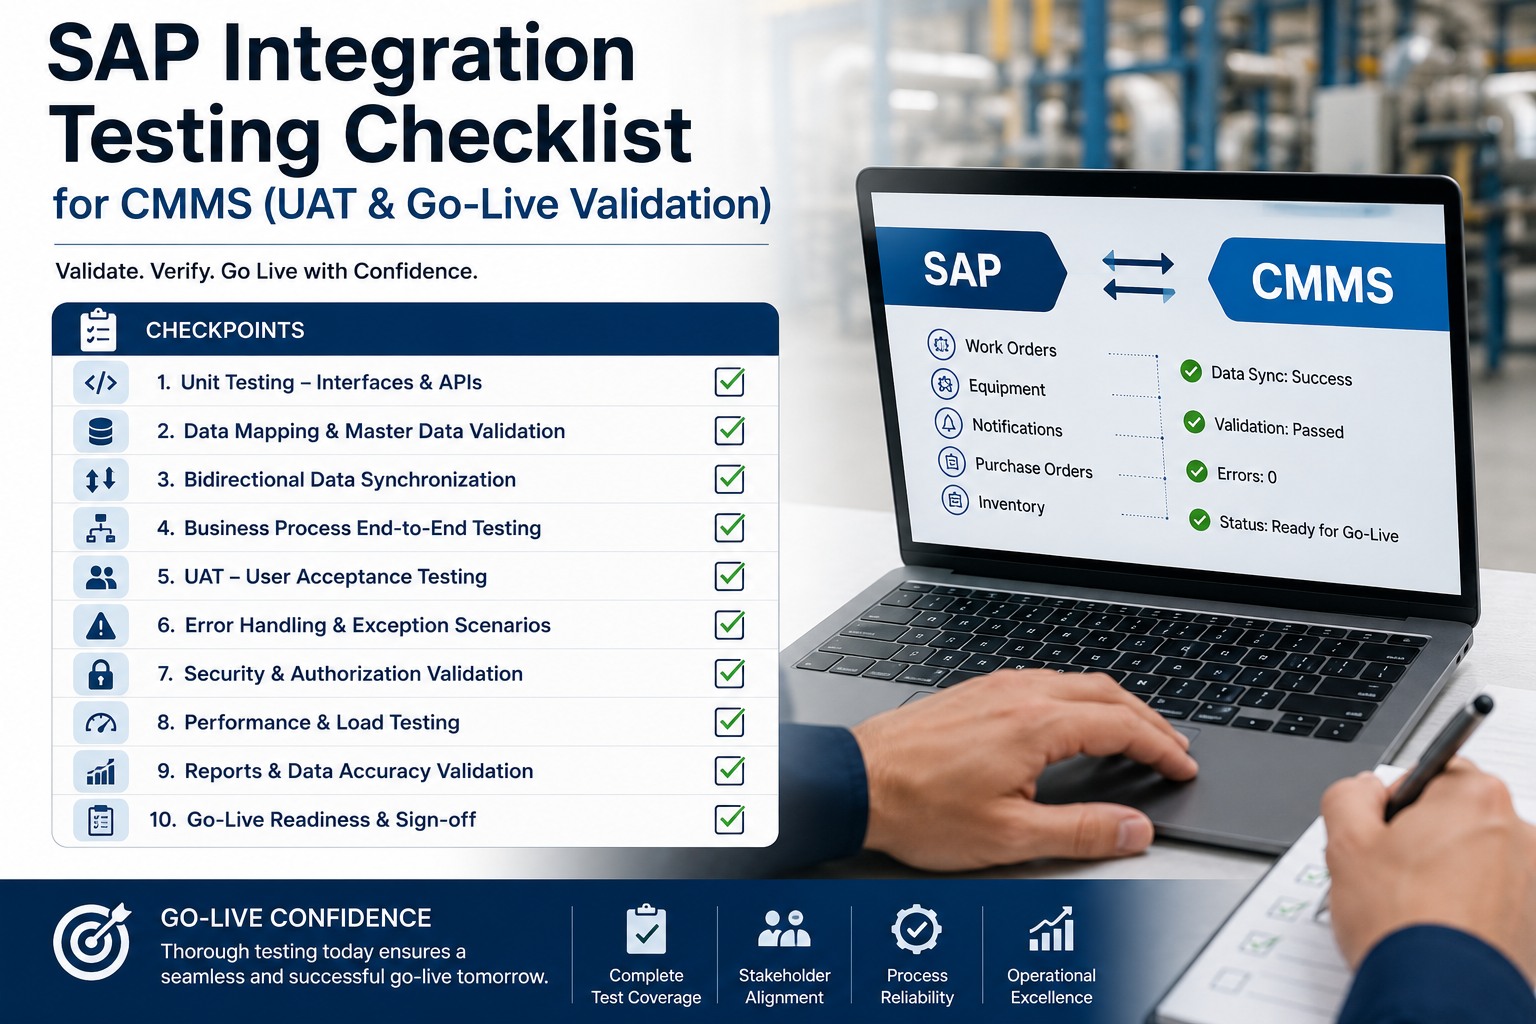
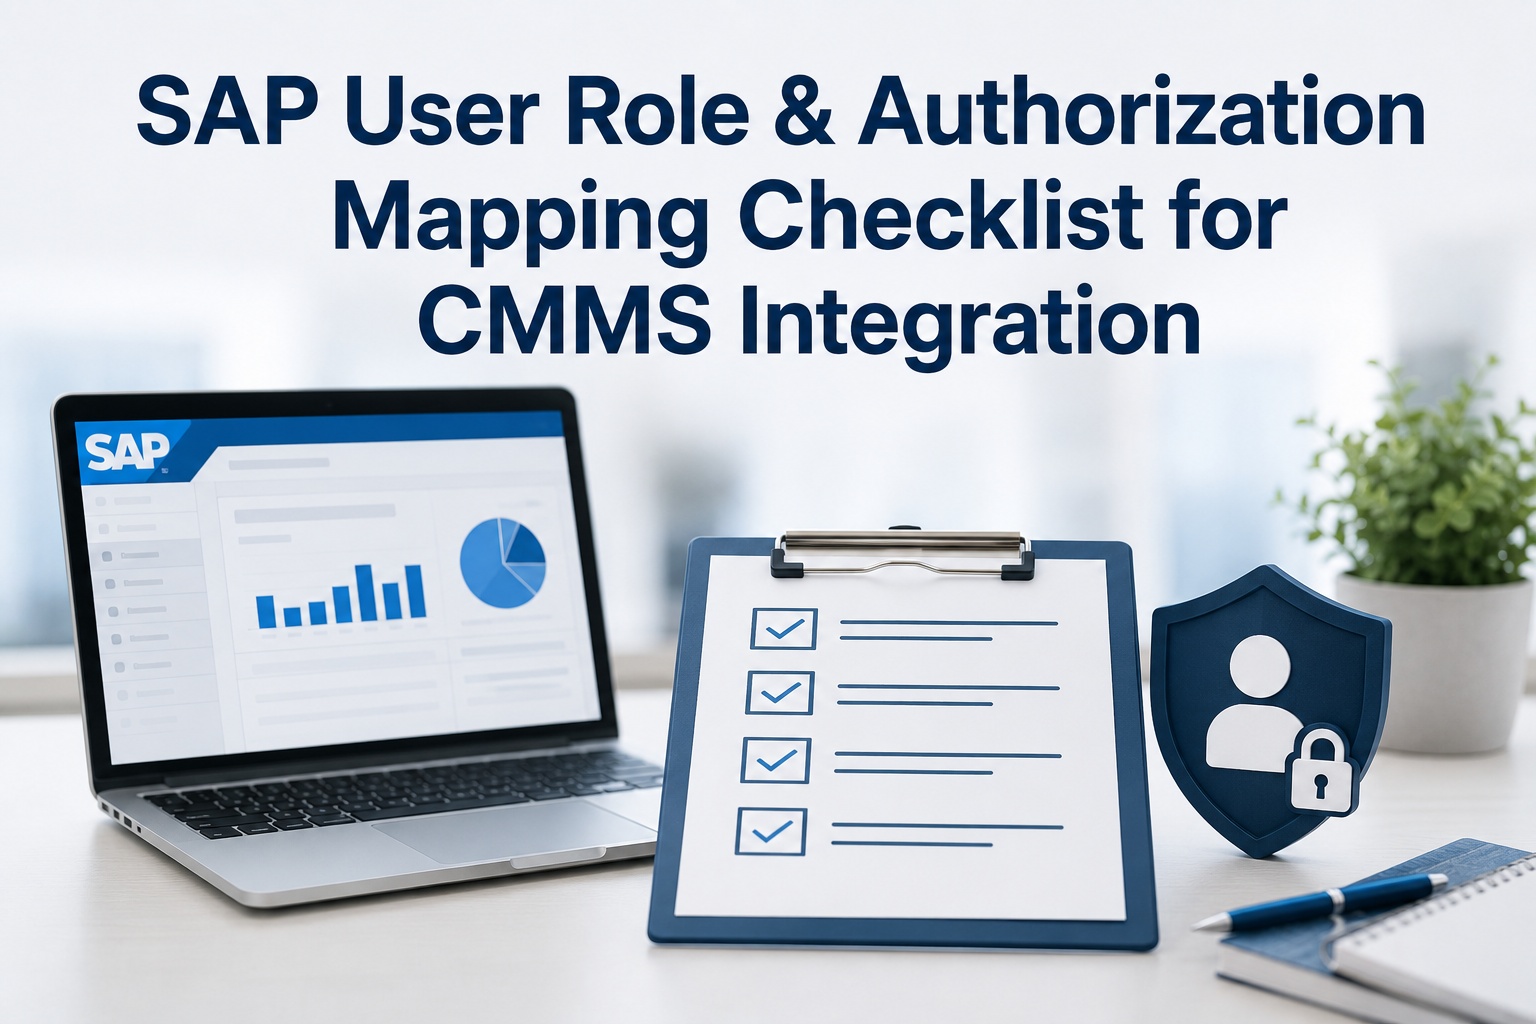
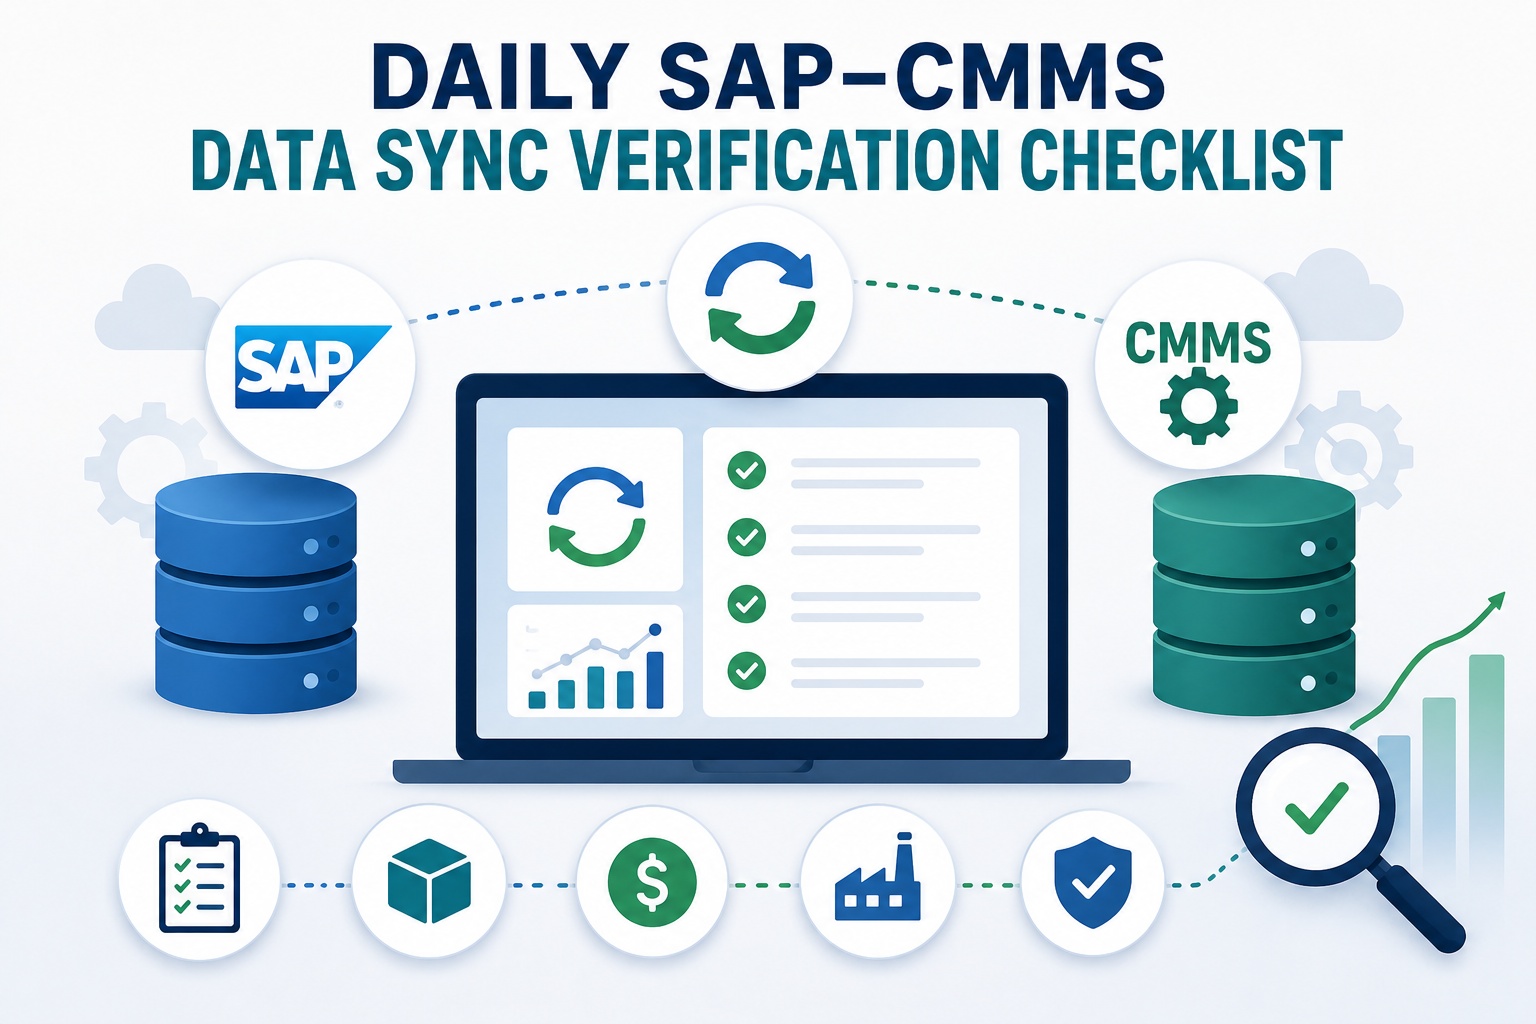
An SAP-CMMS integration installed eighteen months ago is silently degrading right now. Sync errors creep in, master data drifts apart, mobile adoption plateaus, audit gaps accumulate—and nobody notices until a quarterly compliance review or a finance escalation forces the discovery. The teams maintaining healthy integrations don't avoid these issues; they catch them within hours instead of months. This checklist gives you the eight integration health dimensions to monitor, the inspection routines that catch problems early, and the corrective actions that prevent silent degradation. Book a free demo to see health monitoring in production.
INTEGRATION HEALTH REALITY
Integrations Degrade Silently—Until They Break Loudly
18 mo
Average Drift Window
8
Health Dimensions
2-4 hr
MTTR With Monitoring
95%+
Audit Compliance Target
Why Integration Health Checks Are the Most Skipped Discipline
Maintenance teams pay attention to equipment health because failures are visible: the line stops, the alarm sounds, the production manager calls. Integration failures are different. Sync errors accumulate quietly in retry queues. Master data drifts slowly across systems. Mobile usage declines gradually until someone notices the dashboard adoption is flat. By the time the symptoms become visible to leadership, the underlying degradation has been building for months.
The discipline that prevents silent degradation is the same discipline maintenance teams apply to physical assets: routine inspection, threshold alerts, and standardized response procedures. Maintenance leaders ready to apply this discipline to their integration can Sign up free to baseline your integration health.
The 8-Dimension SAP-CMMS Integration Health Check Framework
The framework below covers the eight dimensions that determine integration health. For each dimension, the matrix shows the symptoms of degradation, the diagnostic inspection that confirms it, and the treatment that restores health. Apply consistently and silent degradation stops being possible.
8 DIMENSIONS · SYMPTOMS / DIAGNOSIS / TREATMENT
Integration Health Check Framework
PHASE A · Real-Time Health
PHASE B · Data Integrity
PHASE C · Adoption & Audit
01
Sync Error Rate CRITICAL · ANCHOR
Real-Time
SYMPTOMS
Records failing to sync · retry queues growing · status mismatches between SAP and CMMS
Cost posting accuracy check · time confirmation flow audit · settlement run review
TREATMENT
Posting logic review · master data alignment · cadence adjustment with finance team
3Critical
3High
2Medium
01Sync Errors Anchor
The framework's discipline is applying all three columns to every dimension. Symptoms alone produce vague concern; diagnosis without treatment produces analysis paralysis; treatment without diagnosis produces fix-symptom-not-cause cycles. The teams that maintain healthy integrations move through all three stages routinely—turning what could be a quarterly compliance scramble into a calm operational rhythm.
SEE IT IN PRACTICE
Watch Real-Time Integration Health Monitoring
30-minute walkthrough showing dashboards for all eight health dimensions running against live SAP-CMMS integration—and the alerts that catch degradation before users notice.
Health Check Cadence: Daily, Weekly, Monthly Routines
Each dimension needs inspection on a cadence matched to how quickly degradation becomes operationally damaging. Real-time dimensions need daily checks; data integrity needs weekly review; adoption and audit dimensions need monthly assessment with quarterly deep-dives.
DAILY
Real-Time Health
01
Sync Error Rate
02
API Response Performance
Automated alerts triggering on threshold excursions. Operations team reviews queues at start-of-day.
WEEKLY
Data Integrity
03
Master Data Integrity
04
Work Order Status
05
Field Data Completeness
Weekly reconciliation reports reviewed during integration team standup. Variances flagged for action.
MONTHLY
Adoption & Audit
06
User Adoption
07
Audit Trail
08
Cost & Time Reporting
Monthly review with steering committee. Quarterly deep-dive on adoption trends and audit posture.
Cadence discipline is what converts the framework from documentation into practice. Teams that establish the cadence catch degradation in days; teams that check ad-hoc discover degradation in months. Integration leaders ready to architect their cadence can Sign up free to build your monitoring cadence.
Red Flags That Indicate Integration Crisis
Some signals indicate the integration has moved past degradation into active crisis. When any of these appears, immediate intervention is required—not next sprint, not next week. Treat them as system-down events.
P95 API latency above 5 seconds disrupts mobile workflows. Field users will start working around the system within days.
Master Data Variance > 5%
Equipment master data variance above 5% across systems means reports are unreliable. Integration credibility collapsing.
Active Users Dropping > 20%
Week-over-week active user decline above 20% signals adoption collapse. Workarounds becoming the default workflow.
Each red flag corresponds to one of the eight health dimensions but at crisis severity. Catching them early requires the monitoring cadence; responding to them well requires the diagnosis and treatment discipline of the framework. Operations leaders ready to set up red-flag alerting can Sign up free to configure red-flag alerting.
ROI of Disciplined Integration Health Programs
The performance delta between reactive integration management and disciplined health monitoring shows up across every dimension that matters: how fast issues are caught, how reliably they're resolved, and how confident leadership remains in the integration's outputs.
REACTIVE MANAGEMENT vs DISCIPLINED MONITORING
Integration Operations Performance Delta
MTTR for Integration Issues
5-10 days
2-4 hr
−95%
Audit Compliance Score
60%
95%+
+35 pts
User Satisfaction
40%
80%+
+40 pts
Silent Data Quality Drift
15-25%/yr
<2%/yr
−90%
Unplanned Integration Outages
4-6 / yr
0-1 / yr
−85%
2-4 hr
Mean time to resolve integration issues with disciplined monitoring
<2% / yr
Annual silent data quality drift with framework discipline applied
The compounding gain comes from how the metrics reinforce each other. Faster MTTR maintains user satisfaction; high satisfaction keeps adoption strong; strong adoption produces complete data; complete data passes audits. Each dimension supports the others. Operations leaders ready to benchmark their monitoring discipline can Book a free demo to benchmark monitoring discipline.
Expert Perspective: Integrations Are Living Systems
"
The integration teams I've watched maintain genuinely healthy systems over multi-year horizons share an unusual mental model: they treat the integration as a physical asset that needs ongoing maintenance, not as a project that ended at go-live. The work isn't glamorous. Daily error log review. Weekly data reconciliation. Monthly user adoption check-ins. Quarterly threshold tuning. Each routine feels small in isolation, but the cumulative effect is an integration that runs reliably for years rather than degrading silently. The teams that skip the routines—usually because they feel like overhead during quiet periods—are the ones explaining to leadership in eighteen months why the integration nobody monitored is now in crisis.
01
Treat Integrations Like Physical Assets
Ongoing maintenance is required, not optional. Set up routines and protect them like you protect equipment maintenance schedules.
02
Routine Beats Heroics
Small daily reviews prevent the crises that require heroic recoveries. Boring discipline outperforms dramatic interventions.
03
Silent Failures Are the Real Risk
Visible failures get fixed fast; silent degradation accumulates for months before discovery. Monitoring catches the silent ones.
90-Day Health Check Program Roadmap
The 90-day program below establishes the baseline, monitoring infrastructure, and operational routines that turn the framework from documentation into ongoing practice.
90-DAY HEALTH PROGRAM ROADMAP
From Current Health Baseline to Operational Discipline
DAYS 1–25
01
Current Health Baseline
Run full 8-dimension assessment. Document current sync error rates, latency, data variance, adoption metrics. Establish where you start from.
DAYS 26–50
02
Monitoring Infrastructure
Set up automated dashboards. Configure threshold-based alerts. Build reconciliation reports. Establish red-flag escalation paths.
DAYS 51–75
03
Operational Routines
Train operations team on daily, weekly, monthly routines. Document escalation playbooks. Run first cadence cycle with team support.
DAYS 76–90
04
First Quarterly Review
Conduct first quarterly review with steering committee. Refine thresholds based on real data. Validate routine effectiveness with team feedback.
PROTECT YOUR INTEGRATION
Catch Silent Degradation Before It Becomes Loud Crisis
Eight dimensions monitored. Three diagnostic stages applied. Routine discipline operationalized. The architecture that keeps integrations healthy for years rather than months.
How do we know if our integration is currently healthy?
Start with the four critical dimensions: sync error rate (should be under 1%), P95 API latency (should be under 2 seconds for typical operations), master data variance between SAP and CMMS (should be under 2%), and weekly active user count (should be stable or growing). If any of these four metrics shows problems, your integration likely has additional issues you haven't detected yet. The full 8-dimension assessment provides the complete picture, but the critical four give you a fast read on whether deeper investigation is needed.
Who should own integration health monitoring within the organization?
The ownership model that works: IT/integration team owns the technical monitoring (sync errors, API performance, master data integrity, audit trails); maintenance operations owns the operational dimensions (user adoption, field data completeness, work order status); finance owns the cost and time reporting accuracy. A monthly cross-functional review brings all three groups together to discuss patterns spanning their domains. Single-owner models tend to fail because no one role has visibility across all eight dimensions—the integration touches too many parts of the operation.
What tools are needed to monitor integration health effectively?
The essentials: automated dashboards displaying real-time metrics for the 8 dimensions, threshold-based alerting that triggers on degradation patterns, reconciliation reports that compare data across systems, and ticketing integration that converts alerts into trackable work. Most modern CMMS platforms include health monitoring capabilities natively for integrations they support. The pattern that fails: trying to monitor through manual reports run on demand. Manual monitoring catches issues too late because the routine inevitably slips when other priorities emerge.
How do we measure the cost of integration drift?
Three categories capture most of the cost: rework cost (hours spent reconciling data, correcting reports, fixing downstream errors), credibility cost (decisions delayed or made wrong because the integration is questioned), and recovery cost (the eventual major intervention to fix accumulated drift). A typical mid-size organization running an unmaintained SAP-CMMS integration absorbs $200K-500K annually in these costs—much of it invisible in any individual budget line. The math reliably justifies the modest investment in disciplined monitoring.
What if we don't have engineering resources for this monitoring?
Modern CMMS platforms increasingly include integration health monitoring as a built-in capability rather than something requiring custom engineering. The configuration takes hours to days rather than weeks, with the platform handling the monitoring, alerting, and reporting infrastructure. The work that remains for your team is the operational discipline: who reviews dashboards on what cadence, who acts on alerts, who owns each escalation path. This is process work, not engineering work. Organizations that lack engineering resources can still run effective health programs by leveraging platform capabilities and focusing internal effort on the operational discipline.