ai-maintenance-analytics-for-executive-reliability-reviews

AI Maintenance Analytics for Executive Reliability Reviews


Maintenance teams generate more data than most executives ever see — and most of what gets reported upward is too late, too vague, or too disconnected from production impact to drive real decisions. OxMaint turns raw maintenance activity into leadership-ready reliability intelligence, so the numbers in your next review meeting actually reflect what's happening on the floor. Start your free OxMaint trial and run your first executive reliability report in under an hour.

Analytics & Reporting · CMMS · Executive Reliability

AI Maintenance Analytics Built for Leadership Review Cycles

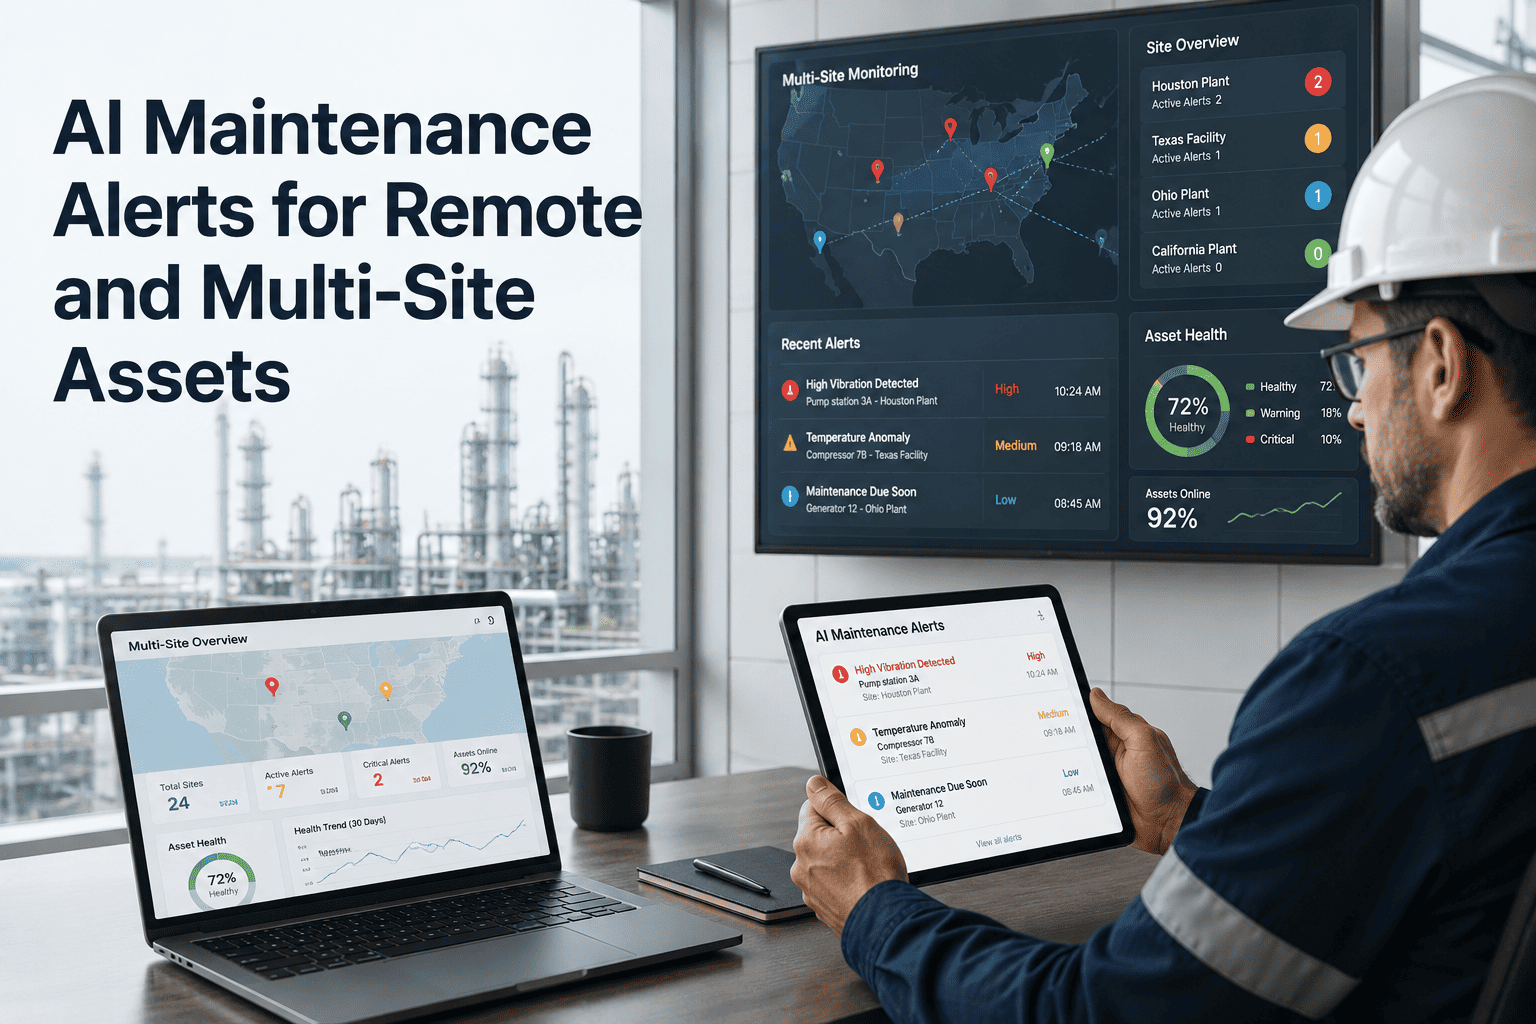
Stop assembling reliability decks from five different spreadsheets the night before a board review. OxMaint surfaces MTTR, MTBF, PM compliance rates, and cost-per-asset trends automatically — formatted for the decision-makers who need them.

Reliability Dashboard — Live View
94%
PM Compliance Rate

2.1h
Avg MTTR This Month

312h
Avg MTBF — Line A

18%
Cost Reduction YTD

The Gap Leaders Feel

Why Maintenance Data Rarely Reaches the Right People in the Right Form


Data Exists — Insight Doesn't
Work orders, downtime logs, and labor hours are recorded somewhere. The problem is that translating raw activity data into metrics like OEE impact or cost-per-asset trend requires hours of manual work that most teams simply don't have capacity to do before a leadership meeting.

Reports Built the Night Before
When reliability reports depend on someone exporting CSVs, running pivot tables, and formatting slides, the data is already stale by the time it reaches an executive. Decision-makers are reviewing last month's reality while this week's problems compound unnoticed on the floor.

No Common Language Across Teams
Maintenance teams track in one system, finance in another, and operations in a third. When these conversations happen without shared data, budget decisions get made on gut feel rather than demonstrated reliability performance — and maintenance always loses that argument.
Key Reliability Metrics

The Six Metrics Every Reliability Review Should Include — and What They Actually Mean

Metric What It Measures Industry Benchmark OxMaint Tracks It
MTTR Average time from failure detection to restored operation World-class: under 2 hours for critical assets Automatic
MTBF Average operating time between failures per asset Varies by asset class — trended improvement matters most Automatic
PM Compliance Percentage of scheduled PMs completed on time World-class: above 90% Automatic
Wrench Time Fraction of technician hours spent on direct maintenance work Industry average: 25–35%. High-performers: 50%+ Automatic
Cost per Asset Total maintenance spend allocated per asset over a period Benchmark to internal baseline and depreciation curves Automatic
Backlog Hours Pending work orders measured in estimated labor hours Healthy backlog: 2–4 weeks of planned work Automatic
OxMaint · Analytics & Reporting · Leadership-Ready

See Your Reliability Numbers — Before Your Next Review Meeting Demands Them

OxMaint pre-builds the reliability reports your leadership team expects. MTTR, MTBF, PM compliance, and cost trends — live, exportable, and ready in seconds instead of overnight.

How OxMaint Works

From Work Order to Executive Dashboard — How OxMaint Closes the Analytics Gap

1
Technicians Log Work in the Field
Every work order closure captures completion time, labor hours, parts used, asset condition, and corrective notes. No separate data entry step — the act of closing the work order is the data capture.

2
OxMaint Calculates KPIs Automatically
MTTR is calculated from the timestamp difference between failure report and work order closure. MTBF is derived from the interval between successive failures on the same asset. PM compliance is the ratio of on-time completions to scheduled tasks — all without manual formulas.

3
Dashboards Update in Real Time
As work orders are completed, dashboards update without anyone pressing refresh. Reliability managers see live KPI movement. Supervisors see technician workload. Executives see the summary metrics they care about — all from the same underlying data, filtered by role.

4
Reports Export in One Click
Filter by site, asset category, department, or date range and export a formatted reliability report with trend lines, exception flagging, and cost summaries. What used to take a reliability engineer four hours takes four minutes — and the result is more complete.
Expert Perspective

What Reliability Engineers Say About Maintenance Analytics Maturity


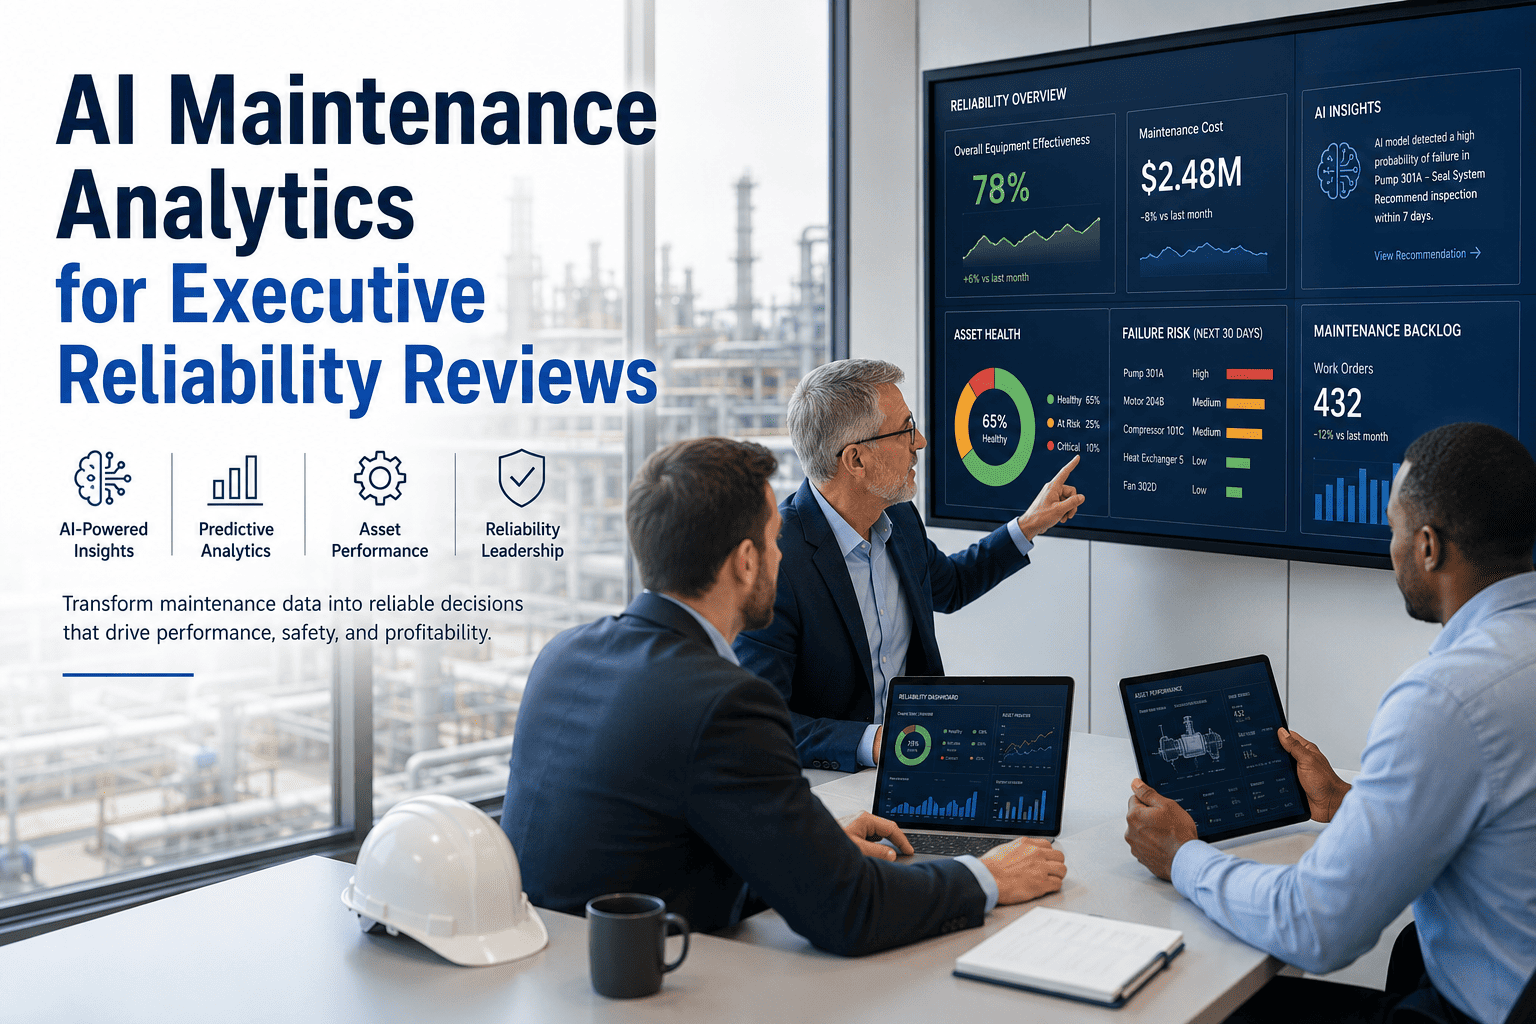
Organizations that present maintenance performance as a cost center will always struggle for budget. The ones that present it as a production reliability function — with data showing MTBF trends, PM compliance rates, and avoided downtime cost — consistently win capital investment for their programs. The analytics capability is what creates the credibility.


Reliability Engineering Consensus
Based on SMRP Body of Knowledge and industry reliability benchmarking studies, 2023–2024
25%
Average maintenance cost reduction when organizations move from reactive to data-driven PM programs
3.5×
ROI on CMMS implementation reported in facilities with consistent analytics use over 24 months
40%
Reduction in unplanned downtime events in plants using predictive analytics layered on top of PM compliance data
Frequently Asked Questions

AI Maintenance Analytics — Common Questions

What maintenance KPIs does OxMaint calculate automatically?
OxMaint automatically tracks and surfaces MTTR, MTBF, PM compliance rate, technician wrench time, work order backlog in labor hours, and maintenance cost per asset. Each metric is calculated from work order and asset data entered by your team during normal operations — no separate data input or formula maintenance required. Explore the full analytics dashboard in a free trial.
Can OxMaint produce reports formatted for executive or leadership review?
Yes. OxMaint's reporting module lets you filter by site, asset category, department, or date range and export a reliability summary that includes trend charts, exception flags, and cost breakdowns. The output is designed to be readable by non-technical stakeholders while remaining grounded in the detailed data that reliability engineers need for follow-up analysis. See a live export in a 30-minute demo.
How is OxMaint's analytics different from a spreadsheet-based reliability tracker?
A spreadsheet requires someone to manually collect data, run calculations, and build charts before every reporting cycle — and that process introduces errors and delays. OxMaint calculates KPIs continuously as work orders are completed, so dashboards are always current. The system also maintains a full history per asset, enabling trend analysis that spreadsheets cannot support without significant manual curation.
Does OxMaint support multi-site reliability reporting?
Yes. Multi-site organizations can view reliability metrics for individual facilities or roll them up into a consolidated view. This allows reliability managers to benchmark performance across plants, identify which sites have the strongest PM compliance, and direct improvement resources where the data shows the greatest gap. Start a free trial to configure your site structure.
OxMaint · Real-Time Analytics · No IT Setup Required

Your Next Reliability Review Deserves Better Than a Last-Minute Spreadsheet

OxMaint keeps your MTTR, MTBF, PM compliance, and cost data current and presentation-ready at all times. Go live in days, not months. No IT project required.


Share This Story, Choose Your Platform!