ai-anomaly-detection-for-pumps-motors-and-compressors

AI Maintenance Risk Dashboard for Production Leaders


Production leaders make throughput decisions every shift — and most of them are made without visibility into which assets are one failure away from a line stoppage. When maintenance risk lives in a separate system that operations can't read, downtime events keep coming as surprises. OxMaint's predictive analytics dashboard connects maintenance condition data to production risk so that your operations and maintenance teams are looking at the same picture at the same time. Book a demo and see how OxMaint connects maintenance risk to production impact in real time.

Predictive Analytics · Production Risk · Manufacturing CMMS

The Maintenance Risk Dashboard Production Leaders Have Been Asking For

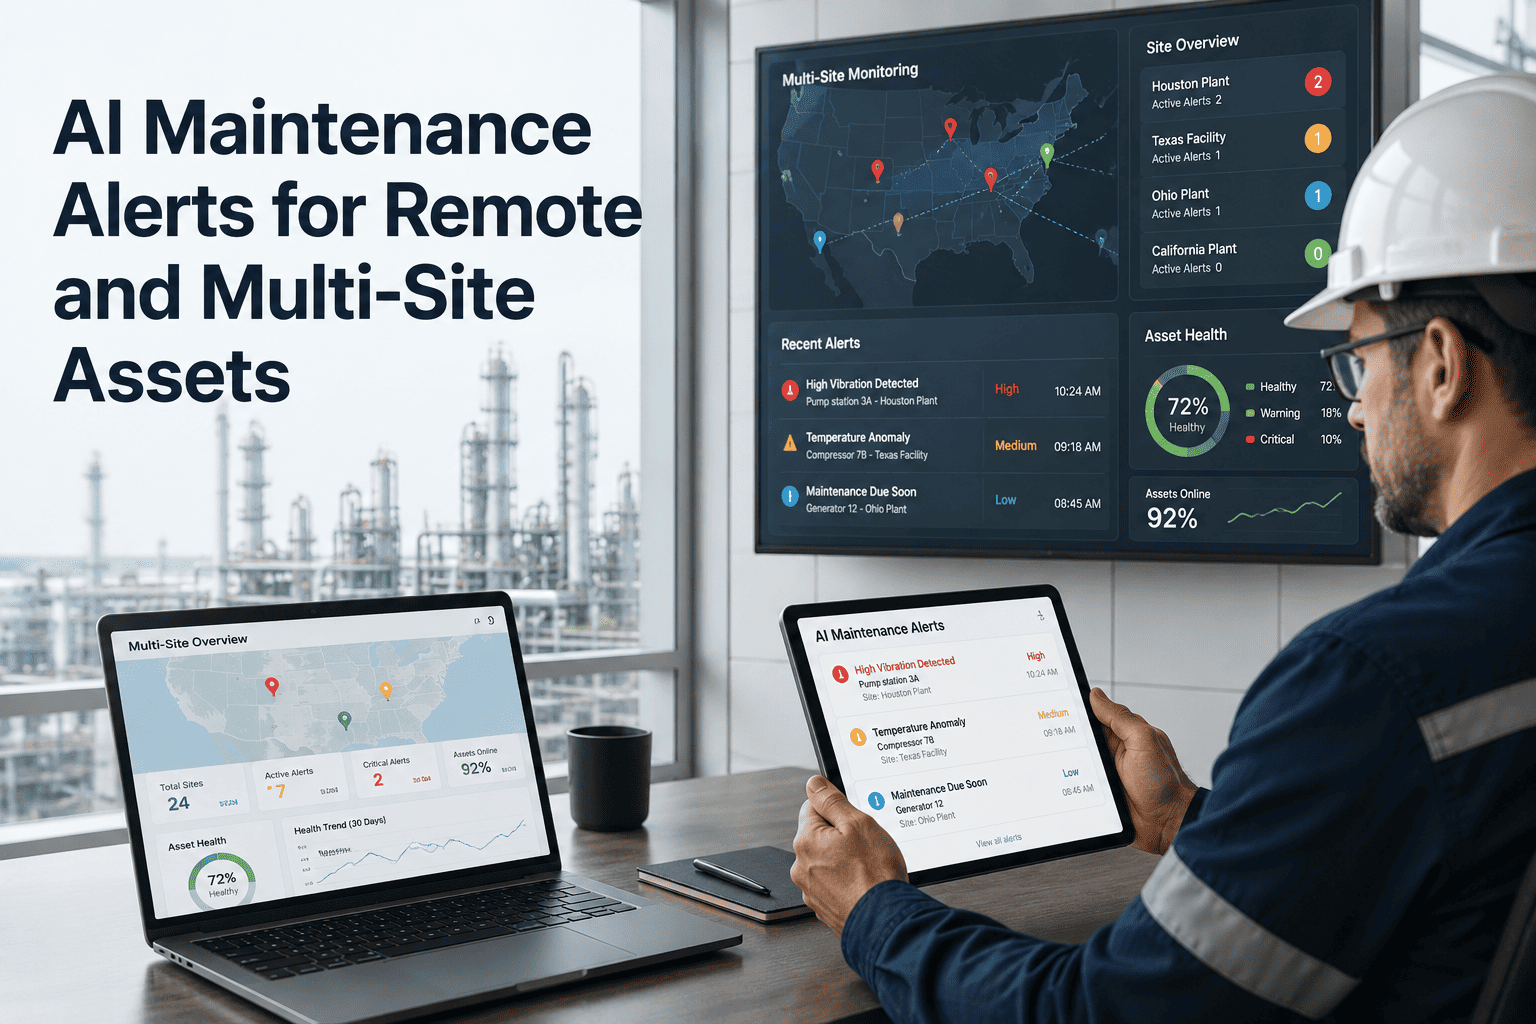
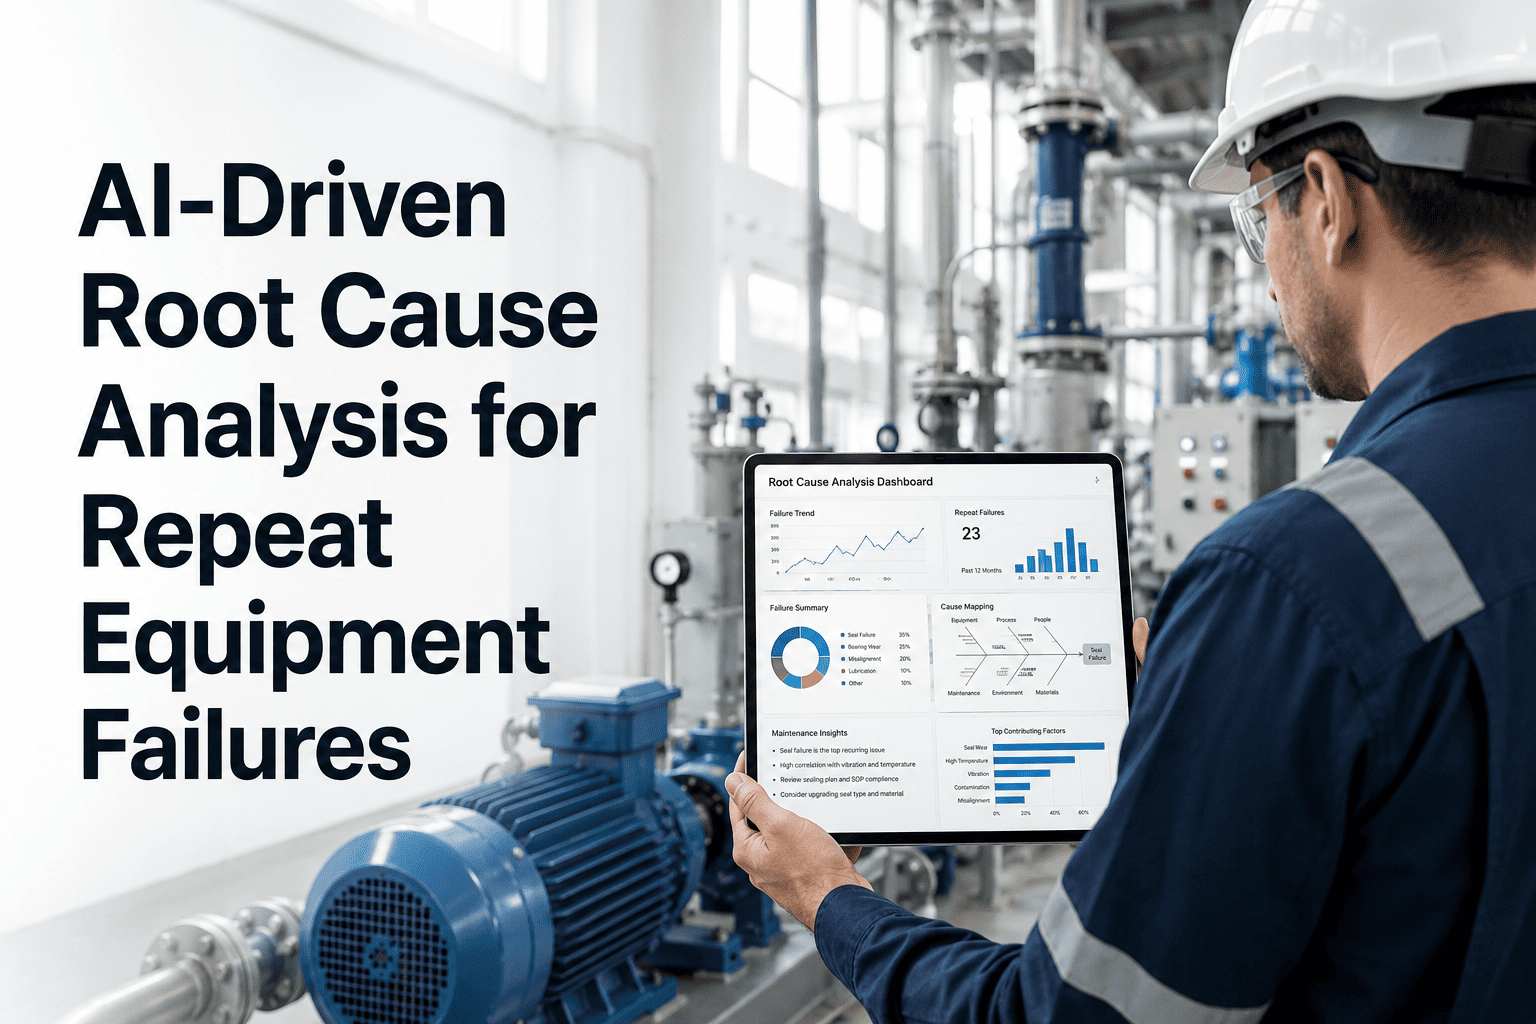
OxMaint translates asset condition, overdue PMs, and open corrective work into a risk-ranked production view — so shift supervisors, plant managers, and operations directors see exactly where their next downtime event is most likely to come from, and when.

Production Risk Register — Live

Low Severity
Medium Severity
High Severity
High Likelihood
3 assets
2 assets
1 asset
Med Likelihood
7 assets
4 assets
2 assets
Low Likelihood
12 assets
5 assets
3 assets
The Visibility Gap

Why Production Leaders Are Flying Blind on Maintenance Risk

Without OxMaint
Downtime events arrive as surprises with no warning window
Maintenance status communicated through shift hand-off meetings only
Operations and maintenance working from different data
Risk assessment is qualitative — based on experience, not data
Production plans made without knowing which assets are at-risk

With OxMaint
Risk-ranked asset list updated automatically from PM and WO data
Production leaders see asset condition in the same system as maintenance
Overdue PMs and open correctives surfaced as production risk flags
Probability-severity matrix generated from actual maintenance history
Shift planning informed by real-time asset risk status
Impact Data

What Risk-Informed Maintenance Programs Deliver — Industry Benchmarks

30–50%
Reduction in unplanned downtime events within 18 months of implementing risk-based PM prioritization

$47B
Annual cost of unplanned downtime across North American manufacturers — most attributable to deferred or untracked maintenance

2.5×
Improvement in maintenance planning efficiency when risk dashboards connect maintenance and operations teams in a shared system
OxMaint · Predictive Analytics · Production Risk Visibility

Give Your Operations Team a Maintenance Risk View They Can Actually Use

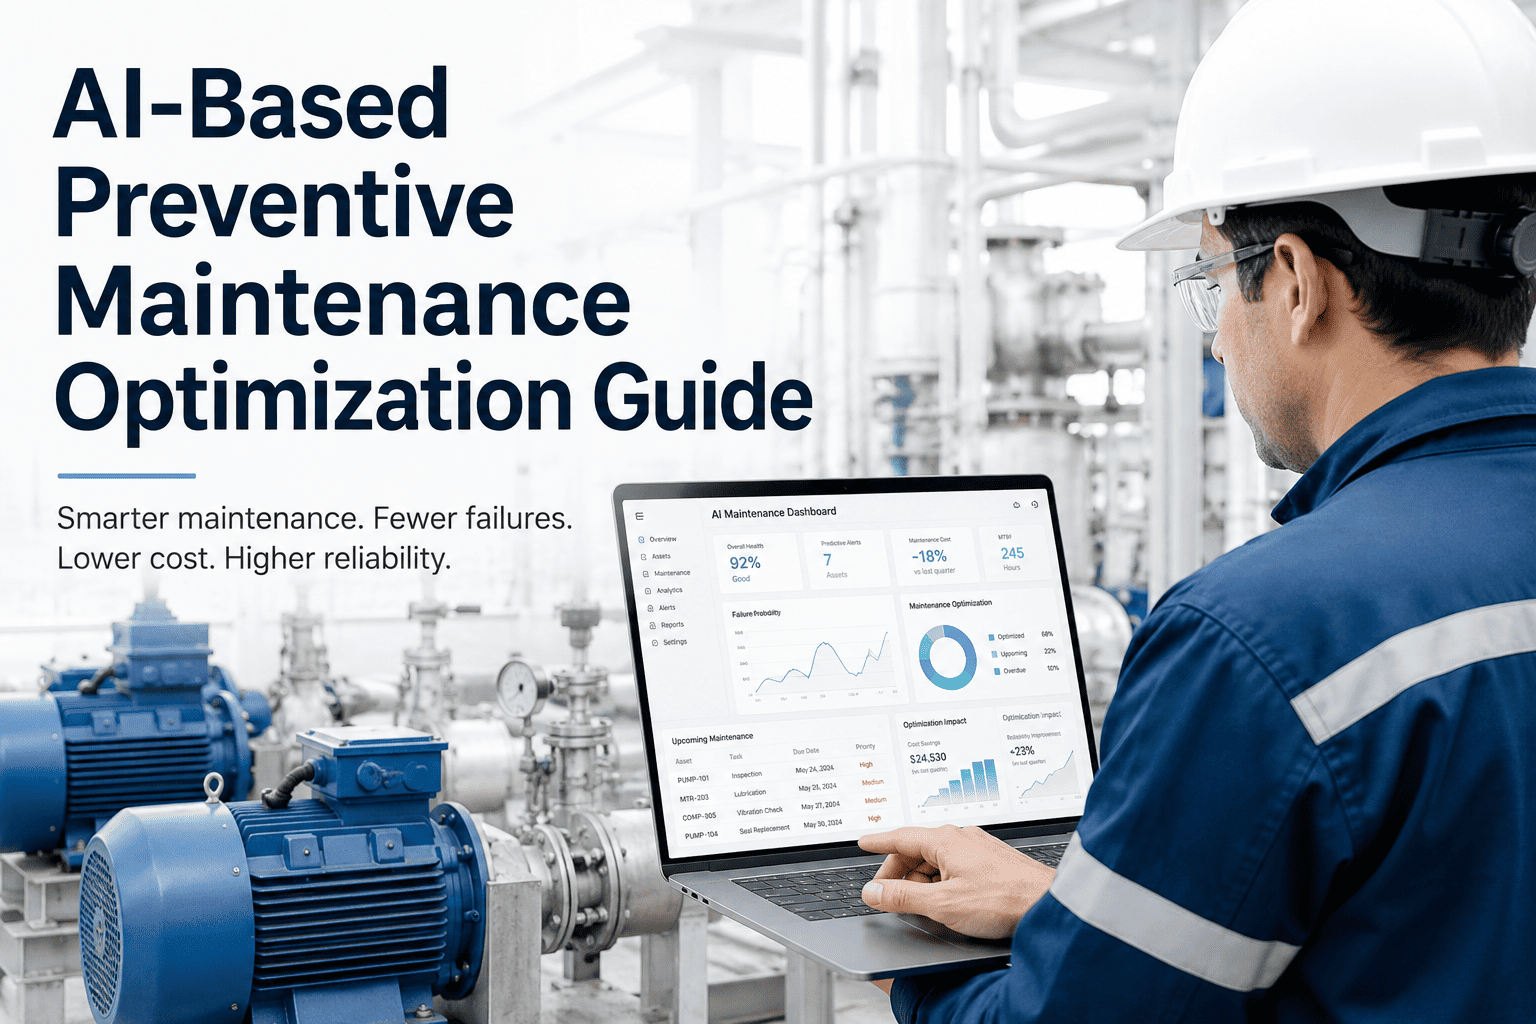
OxMaint's predictive analytics dashboard surfaces your highest-risk assets before they become downtime events. See it in action on your actual production line structure in a 30-minute demo.

Dashboard Features

What the OxMaint Production Risk Dashboard Shows Your Team

01
Risk-Ranked Asset Register
Every production asset scored by failure likelihood and downtime severity, ranked in a live list that updates when PMs are completed or overdue. Your team sees immediately which 5 assets to watch this week — not which 500 assets are in the system.
02
Overdue PM Risk Flags
When a PM falls overdue, OxMaint escalates the associated asset's risk rating and surfaces it on the production dashboard. Operations leaders see deferred maintenance as a production exposure — not as a maintenance backlog number they never check.
03
Open Corrective Work Visibility
Outstanding corrective work orders for production-critical assets are visible in the risk dashboard with age, priority, and assigned technician. Shift supervisors can identify which at-risk assets still have open correctives and prioritize accordingly without calling the maintenance office.
04
Historical Failure Pattern Analysis
OxMaint identifies assets that have failed repeatedly within the same maintenance window or season, flagging recurring failure patterns that point to root causes. Production teams can see which assets have a history of surprising them — and maintenance can see where engineering review is warranted.
Expert Perspective

What Manufacturing Reliability Research Says About Maintenance-Operations Alignment


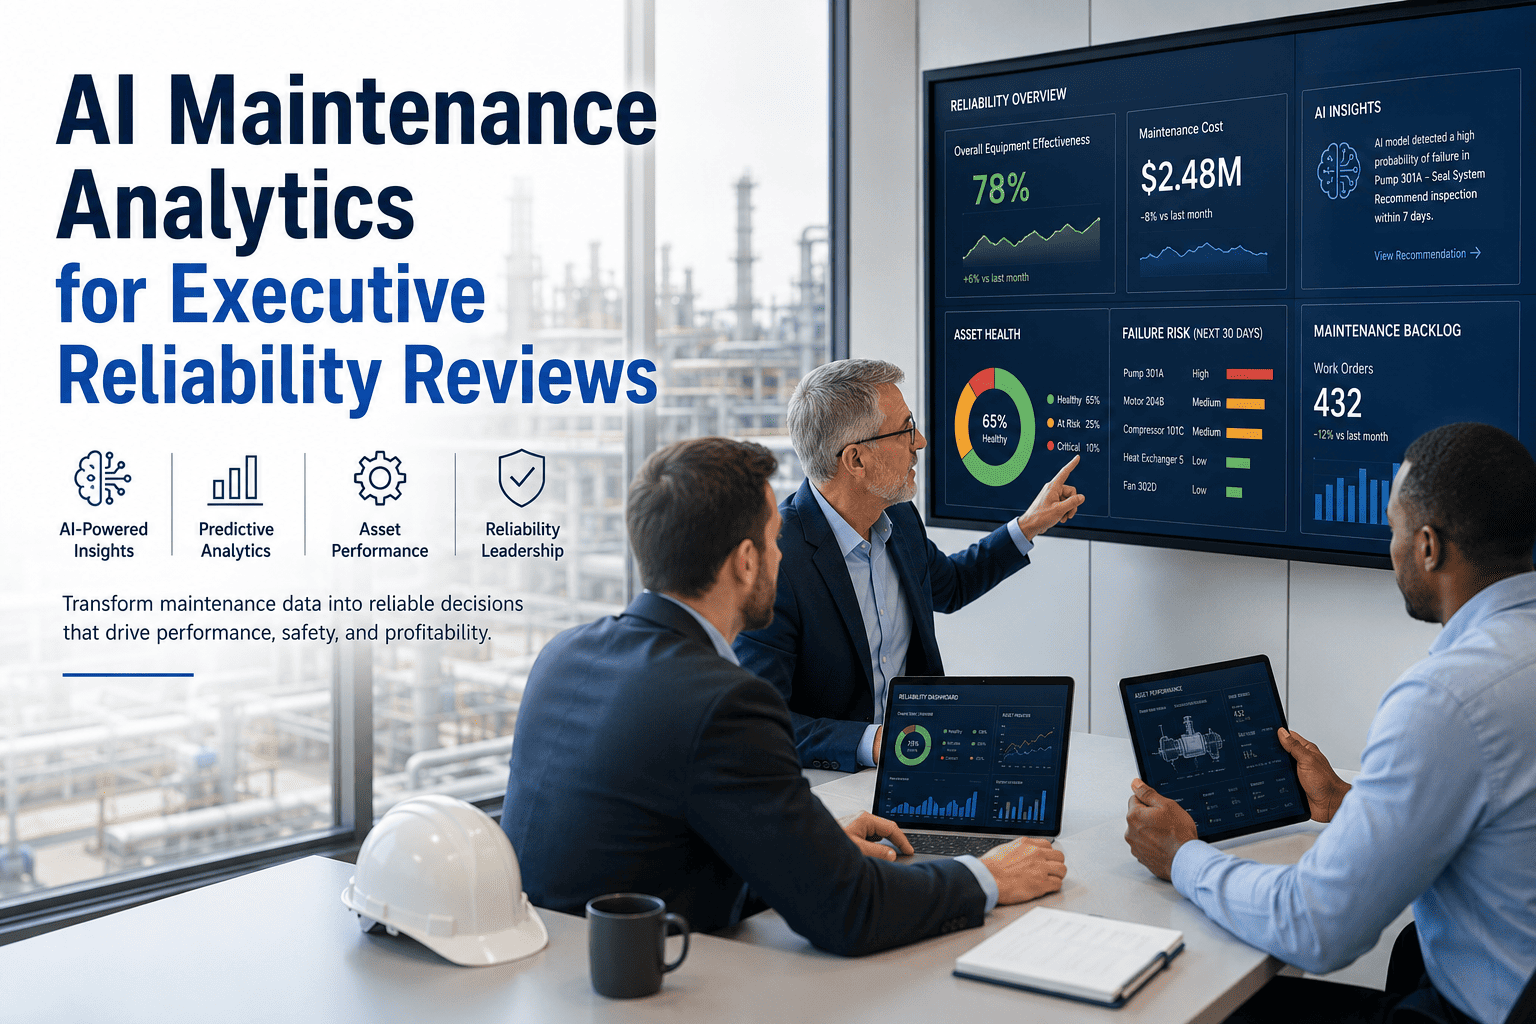
The highest-performing manufacturing sites we benchmark share one characteristic that underperformers almost never have: their operations managers and their maintenance managers are looking at the same data in real time. When maintenance risk is invisible to production leadership, every downtime event is a surprise. When it's visible, it's preventable planning input. The technology to enable this alignment has existed for years — what's been missing is adoption at the site level.

Manufacturing Reliability Benchmarking Study — LNS Research, 2023. Based on survey data from 437 manufacturing sites across automotive, food, pharmaceutical, and chemicals sectors.
Alignment Impact — Survey Data
Unplanned downtime reduction

72%
Maintenance budget efficiency gain

58%
PM compliance improvement

84%
Sites reporting improvement after adopting shared maintenance-operations dashboards
Frequently Asked Questions

AI Maintenance Risk Dashboard — Common Questions

How does OxMaint calculate production risk for individual assets?
OxMaint calculates asset risk from a combination of PM compliance status, open corrective work order age and priority, historical failure frequency, and asset criticality rating configured during setup. Assets with overdue PMs, repeated failure history, and high criticality ratings surface at the top of the risk register. The scoring updates automatically as work orders are completed or become overdue. See the risk scoring model in a live demo.
Can production supervisors access the risk dashboard without needing CMMS training?
Yes. OxMaint's production risk view is designed for operations leaders who need situational awareness, not maintenance system expertise. The dashboard shows a risk-ranked asset list with color-coded status indicators, overdue PM flags, and open corrective work — all in a read-access view that requires no work order creation or system configuration from the operations user. Create a free trial and explore the operations view.
How does the risk dashboard handle multi-line or multi-shift manufacturing environments?
OxMaint's dashboard supports filtering by production line, asset category, shift, and site. Multi-shift facilities can configure the view so each shift supervisor sees the assets relevant to their area of responsibility. Plant managers see a rolled-up view across all lines, and can drill down to any asset for the underlying maintenance detail that drives its current risk rating.
Does OxMaint integrate with existing production management or ERP systems?
OxMaint offers API-based integration with production management and ERP systems to enable bi-directional data flow between maintenance and operations platforms. Asset criticality ratings set in your ERP can inform OxMaint's risk calculations, and maintenance cost data from OxMaint can flow back to your financial systems. Discuss your integration environment in a demo call.
OxMaint · Risk Dashboard · Production Visibility · Free to Start

Your Next Unplanned Shutdown Is Already Visible in Your Maintenance Data. See It First.

OxMaint surfaces your highest-risk production assets from the maintenance data your team is already generating. No new sensors. No IT project. Go live in days and give your operations team the risk visibility they've been asking for.


Share This Story, Choose Your Platform!