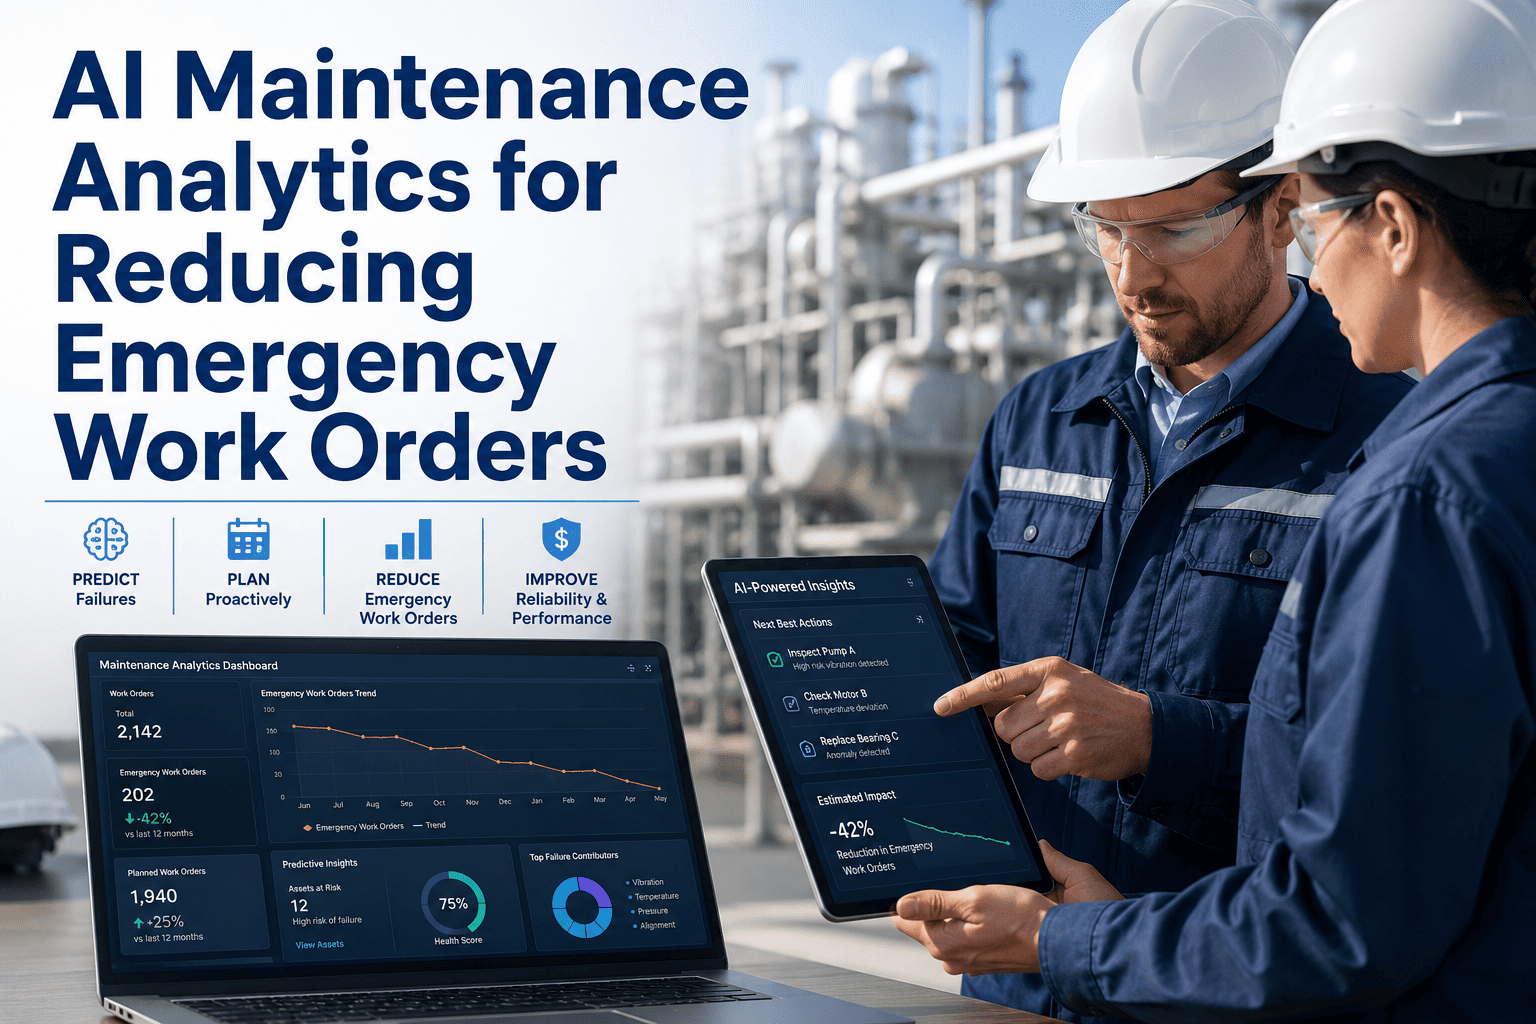
Emergency work orders are the most expensive, disruptive, and preventable category of maintenance activity — yet most facilities still operate with emergency WO rates above 30%, simply because no one is analyzing the patterns behind the failures. OxMaint's AI maintenance analytics surfaces repeat failures, overdue PMs on high-risk assets, and root cause clusters that human teams miss in flat work order lists — giving maintenance managers the insight to intervene before the next emergency, not after it. This article explains the analytics framework that works.
AI MAINTENANCE ANALYTICS
Turn Emergency Work Orders Into Preventable Incidents — With AI Analytics
Find the repeat failures, high-risk assets, and overdue PMs hiding in your CMMS data — and act on them before the next unplanned stoppage hits your production floor.
Typical WO Mix
World-class target: Emergency WOs < 10%
The 4 Analytics That Actually Reduce Emergency Work Orders
Identifying assets that generate 3+ emergency work orders in 90 days — they are almost always candidates for a PM frequency increase, component rebuild, or replacement decision. Most CMMS platforms won't surface this automatically; OxMaint flags repeat-failure assets on the dashboard without requiring manual report runs.
Impact: 40–60% reduction in emergency WOs on flagged assets
An asset that is 30 days overdue on a quarterly PM has a statistically higher failure probability than one that was just serviced. OxMaint's risk scoring combines PM overdue days, asset criticality, and historical failure frequency into a single risk index — so you can triage the most dangerous gaps in your PM calendar first.
Impact: Prioritize the top 10% of overdue PMs that carry 60% of risk
If five different assets in the same facility all show electrical failures in summer months, that's a pattern — not coincidence. AI clustering groups work orders by failure type, asset class, and time period to surface environmental and systemic root causes that individual work orders would never reveal to a maintenance manager reviewing one at a time.
Impact: Root cause resolution vs. symptom treatment every time
Emergency work orders cost 3–5× more than planned maintenance for the same repair — labor premium, expedited parts, production loss, and overtime. OxMaint's cost analytics separate planned vs. unplanned spend by asset, by location, and by failure type — making the true cost of deferred PM impossible to ignore in budget conversations.
Impact: Build the business case for PM investment with real numbers
Emergency Work Order Rate — Industry Benchmarks
| Industry Sector |
Average Emergency WO % |
World-Class Target |
Primary Driver |
OxMaint Analytics Used |
| Discrete Manufacturing |
28–35% |
<10% |
Mechanical failure — bearings, motors |
Repeat failure + PM overdue scoring |
| Food and Beverage |
35–45% |
<12% |
Sanitation compliance + refrigeration |
Failure mode clustering + cost analysis |
| Facilities / Commercial |
30–40% |
<15% |
HVAC, electrical, elevator failures |
Asset health scoring + PM calendar |
| Utilities / Water |
20–30% |
<8% |
Pump and valve failures |
IoT integration + predictive triggers |
| Healthcare Facilities |
25–35% |
<5% |
Life-safety system failures |
Compliance calendar + escalation rules |
3–5×
higher cost for emergency vs planned maintenance for the identical repair task
20%
of assets typically account for 80% of all emergency work orders — the Pareto rule holds
63%
of emergency work orders follow a missed or deferred preventive maintenance task
What Does Your Emergency WO Rate Look Like Right Now?
OxMaint's analytics dashboard can show you your repeat-failure assets, highest-risk overdue PMs, and emergency WO cost breakdown in your first session. Book a demo and we'll run the numbers live.
From Data to Action — The Analytics Loop
1
Work Orders Close
Every closed work order feeds failure code, asset ID, labor time, and parts data into the analytics engine.
2
AI Identifies Patterns
Repeat failures, PM gaps, and cost spikes are flagged automatically — no analyst required.
3
Dashboard Surfaces Risk
High-risk assets and overdue PMs appear on the maintenance manager's dashboard with priority ranking.
4
PM Schedule Adjusted
Maintenance manager increases PM frequency or adds new PM tasks based on failure pattern data.
5
Emergency Rate Drops
Root causes addressed — emergency work orders on those assets decline measurably over the next 60–90 days.
EXPERT REVIEW
Dr. Priya Nair, PhD, RE
Reliability Engineer and Maintenance Researcher — 15 Years in Petrochemical and Automotive Manufacturing
The conversation about predictive maintenance often jumps straight to IoT sensors and machine learning models — but most plants haven't exhausted the intelligence sitting in their existing work order history. Emergency work order patterns, when properly analyzed, are among the most actionable data a maintenance manager has. You don't need a sensor to know that a pump that failed three times in six months is going to fail again. The question is whether your system is telling you that before the fourth failure or making you piece it together after the fact. AI analytics should be making the obvious patterns obvious — and fast.
Frequently Asked Questions
How much historical work order data does OxMaint need to generate useful analytics?
Meaningful pattern detection typically requires a minimum of 90 days of work order history, with more reliable insights emerging after 6–12 months. For customers migrating from an existing CMMS, OxMaint imports historical work order data — so analytics start from a richer baseline from day one. Even with 90 days of data, repeat-failure flags and PM overdue risk scores are operational and actionable.
Sign up free to see the analytics setup process.
Can OxMaint analytics identify which technicians or shifts have higher repeat-failure rates?
Yes, with an important nuance. OxMaint can segment work order data by technician, shift, and crew — and surface patterns like higher return-visit rates for specific individuals or time windows. This data is intended to guide training and scheduling decisions, not punitive reviews. Most managers find that shift-level patterns reveal systemic issues — missing parts during night shifts, specific equipment with complex procedures — rather than individual performance gaps. All workforce analytics are visible only to appropriate roles.
How does OxMaint define an "emergency" work order for analytics purposes?
OxMaint classifies work orders by priority type — Emergency, Urgent, Routine, and PM — either through manual selection at work order creation or through automated rules based on asset criticality, failure code, or sensor trigger. Analytics dashboards can be filtered by any work order type, and the Emergency vs. PM ratio is tracked as a key performance indicator. You can customize the definition of "emergency" to match your organization's own maintenance triage standards.
Can OxMaint analytics integrate with our existing BI tools for leadership reporting?
Yes. OxMaint's analytics data — including emergency WO rates, repeat failure counts, PM compliance scores, and asset health indexes — can be exported via API or scheduled CSV to Power BI, Tableau, Google Looker, and other BI platforms. This lets maintenance KPIs sit alongside production, quality, and financial metrics in the same leadership dashboards.
Book a demo to see the BI integration workflow and available data fields.